Last updated: Oct 16, 2025
ℹ️ This blog series focuses on hosted data services in ArcGIS Online and ArcGIS Location Platform (more about the scope).
Note: This article was previously titled “Retrieval and Loading Time Differences” and has been renamed to “Behind the scenes and SDK trade-offs” to better reflect its scope and intent.
If you are planning to build (or already developing) a custom application using ArcGIS hosted data services and want to better understand why one SDK or data service can be more performant than others, or how scalable apps can be built with performance in mind, keep reading 🙂.
In the previous article, we not only discussed which tools are best suited for each task and how to automate processes, but also explained some performance optimizations that can be made from the backend.
Before reading on
This article explains the factors that affect performance across services and SDKs, along with concepts not required for daily use but useful for understanding their strengths, limitations, and the optimizations each SDK implements.
It is not a step-by-step optimization guide; instead, it highlights what happens behind the scenes and what developers should consider when making decisions.
What this article covers
This article is intended for client-side application developers working with web or native SDKs. It takes a technical look at what these APIs return and the optimization mechanisms that influence latency, tile sizes, and data transfer formats:
- Tile retrieval (latency)
- Optimization mechanisms
- Tile size
- Data returned
- Transferred data format
- Rate limiting and tiers
- SDKs integration
- Next steps
By the end, you’ll know what impacts data access and performance, so you can design apps that load faster and run smoother.
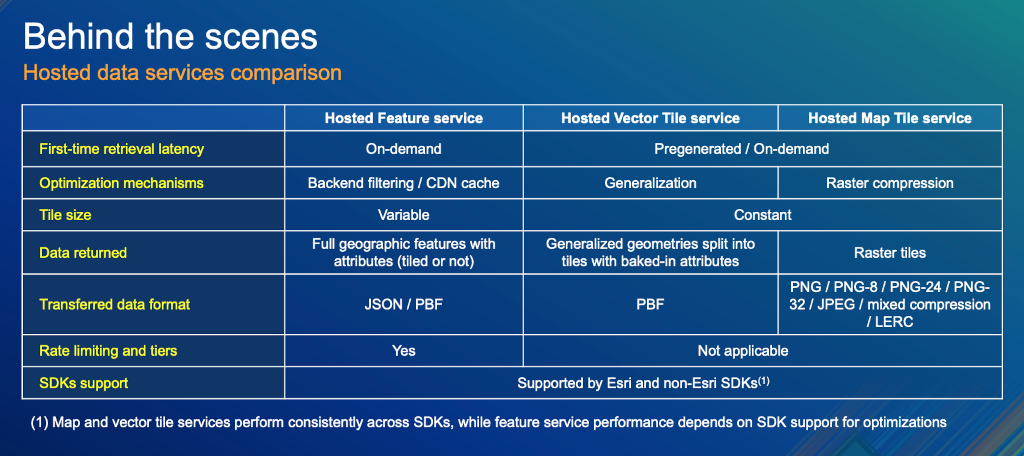
[TL;DR] Short on time? This table gives you the key highlights at a glance:
Notes on accuracy: Surviving the test of time …
As introduced in the first article of this series, this series is a unified resource to save you time and clarify differences between similar technologies, based on information from official sources.
Technology evolves rapidly, so some details may become outdated. Each article includes references to official documentation, which contains the most up-to-date information. In case of discrepancies, the official documentation takes precedence.
If you find something unclear or notice an error, contact us at developers@esri.com
Tile retrieval (latency)
All three services can deliver data as tiles, though for feature services this is optional.
Tile services
Map tiles and vector tile services are very fast since they return pre-generated tiles.
Note: When published with on-demand generation, map tile services render unseen tiles on first request, adding latency, but serve them from cache thereafter.
Feature services
Feature services aren’t pre-generated, so requests may query the underlying database. To minimize latency, they support several optimizations:
- Tiled queries: When
resultType=tileandcacheHint=trueis added to requests, it enables tile caching of spatial and non-spatial results. - CDN caching: For public services, you can configure how requests are routed through the CDN.
- Generalized geometries: Supports storing simplified geometries to reduce retrieval time.
- Indexes: Provide index configuration (rowstore, columnstore, and full-text field indexes) to speed up initial queries.
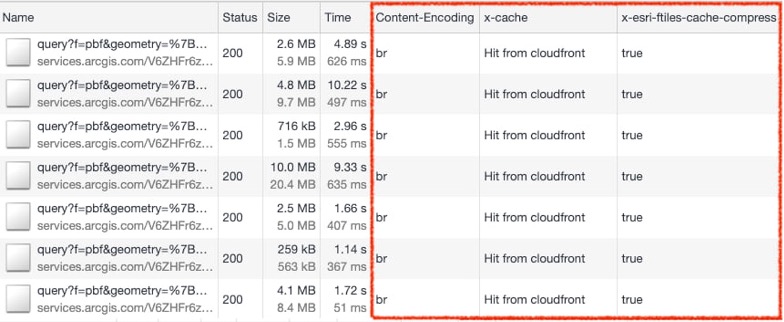
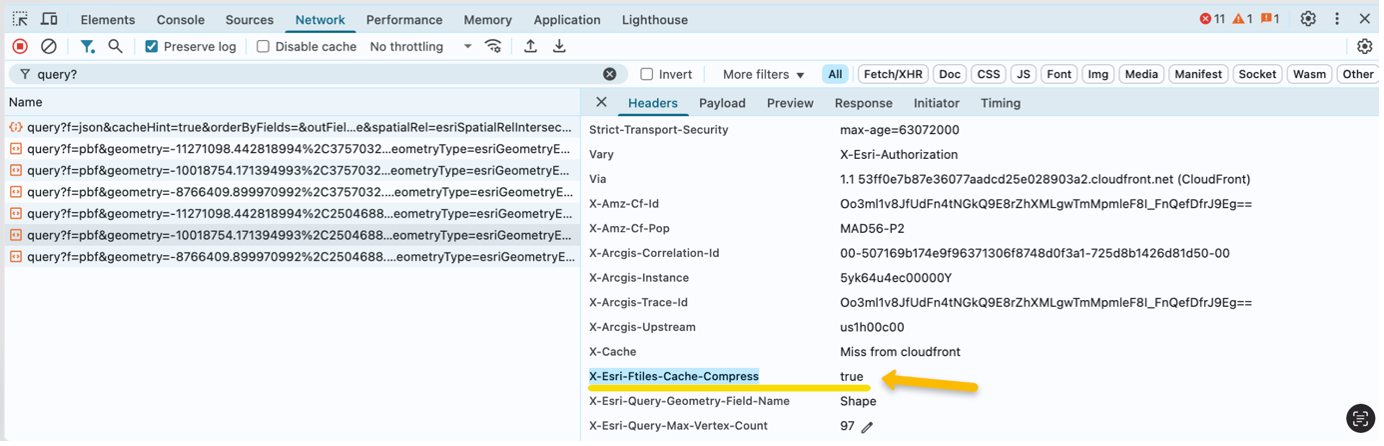
To confirm if some of these optimizations are applied, inspect the HTTP response headers:
- For tiles cache: Check if the header ‘x-esri-ftiles-cache-compress’ is set to ‘true’.
- For CDN cache: Check if the header ‘x-cache’ shows ‘Hit from CloudFront‘ (see the “ArcGIS Maps SDK for JavaScript: Max Speed & Capabilities of the Feature Layer” demo).
Where to learn more about applying these optimizations …
These are great resources:
- ArcGIS Maps SDK for JavaScript: Max Speed & Capabilities of the Feature Layer.
- ArcGIS Online: Tips & Tricks for Viral Maps.
- Handle large geometry with Optimize Layer Drawing.
- Scalable hosted feature layers in ArcGIS Online: Tile queries and response caching.
All of these resources apply to ArcGIS Online and ArcGIS Location Platform.
As we will explain in “SDKs integration“, some of them take advantage of this by generating repeatable queries using predictable extents (bounding boxes or envelopes).
Optimization mechanisms
Different hosted data services apply optimizations in different ways. Tile services focus on performance at generation time, while feature services expose REST API parameters that let developers control the size and detail of responses at query time.
Tile services
Map tile services and vector tile services are optimized at the time of generation through:
- Generalization: Geometries are simplified in vector tiles to reduce file size and improve rendering performance, and PBF encoding.
- Format selection: Choosing the most suitable tile format (e.g., PNG, JPEG, etc) for your dataset and symbology.
There is no way to query or filter any of these tiles from the backend at the time of request. For example, when you request vector tiles, you always receive all the attributes that were baked into them at generation.
About map tile formats …
Depending on your source data and visualization needs (such as color schemes or transparency), you can choose from several output formats: PNG, PNG-8, PNG-24, PNG-32, JPEG, mixed compression, and LERC. To learn more, check out the CartoRedux video or the “Generate Tile Cache Tiling Scheme” documentation in ArcGIS Pro.
Feature services
Feature services implement multiple API parameters to optimize server response size:
- Feature filtering: Using
WHEREclauses and applying spatial filters passing a geometry withspatialRelto limit the rows (features) returned. - Attribute filtering: Using
outFieldsto request only the fields you need (or none, if you only want geometries). - Geometry control: Using
returnGeometry=falsewhen you only need attributes andgeometryPrecisionto control the number of decimals in the returned geometry coordinates. - Quantization: Using
quantizationParametersto reduce the number of vertices in complex geometries (as explained here). - Pagination: Using
resultOffset(starting record) andresultRecordCount(page size) to retrieve large datasets in smaller chunks. - Output format: as explained below in the “Transferred data format” section, using
f=pbf, responses can be requested in this binary format, which is smaller than JSON and faster to transfer and parse.
Note: These optimizations are key for large or complex layers (many features, dense geometries, wide tables), in mobile/low-bandwidth scenarios, and in cases where you don’t know in advance what data the user will need.
More about the Query capabilities within hosted feature services
SQL parser
Hosted feature services support SQL-like queries for filtering, sorting, and aggregating data.
Below is an overview of the capabilities they provide, along with some operations that aren’t part of this query model:
- What can be done:
- Filter rows: Using the
whereparameter (SQL-92 syntax) on layer fields:- Comparison operators: (`=`, `<>`, `<`, `>`, `<=`, `>=`).
- Logical operators (`AND`, `OR`).
- Other operators: `LIKE`, `IN`, `BETWEEN`.
- Aggregate functions: Such as `SUM`, `AVG`, `COUNT`, `STDDEV`, `MIN`, `MAX`, and `VAR` are available through the
outStatisticsparameter. - Sorting: Sorting results using
orderBy. - Joins: If a relationship class exists (a predefined join), you can use queryRelatedRecords to fetch related features or tables, . Another option is to create a joined hosted feature layer view, as described in the previous article.
- Filter rows: Using the
- What cannot be done:
- Ad-hoc joins: `LEFT JOIN`, `RIGHT JOIN`, or `FULL OUTER JOIN`.
- Subqueries: Nested SQL queries.
- Inline SQL aggregates: Aggregation is only available through the
outStatisticsparameter. - Complex transformations: Advanced calculations, custom expressions, or arbitrary data transformations.
Note that the SQL parser has a size limit on expressions that may cause query failures.
Other query capabilities
In addition to response optimizations and the SQL capabilities mentioned above, feature services also support:
- Spatial reference: Return geometries in a different coordinate system using
outSpatialReferenceoroutSR. - Attachments: Use queryAttachments to list or download files linked to each feature
- Specialized analytics: Use queryAnalytic for advanced calculations like running totals or ranks.
- Binning: Use queryBins to group features into spatial bins (grid or hex shapes) and summarize them, or queryDateBins to group by time intervals.
- And more that exceeds the scope of this article.
Tile size
As you just learned, map and vector tiles have a fixed size, while the response size of feature services varies depending on the request parameters.
Data returned
Each service type delivers data in a different form:
- Map tile service: Always returns raster tiles.
- Vector tile service: Always returns vector tiles with geometries (can mix geometry types, be simplified, and clipped) and the attributes baked into each feature.
- Feature service: Returns flexible vector data (tiled or untiled, simplified or full geometries, spatial or purely tabular data) depending on the request.
Transferred data format
The actual payload format varies by service:
- Map tile service: Returns raster image tiles (.jpg or .png if transparency is required).
- Vector tile service: Return vector tiles with serialized JSON data encoded as PBF, that can be decoded with arcgis-pbf.
- Feature service: Returns vector data in JSON, with several output options:
- Standard JSON: Supports Esri JSON (
?f=json), prettified Esri JSON (?f=pjson) and GeoJSON (?f=geojson). - Protocol Buffers (PBF): When set
?f=pbf(explained here, demo). Once decoded, it represents the same feature data you would obtain in JSON, but it differs from both Esri JSON and GeoJSON.
- Standard JSON: Supports Esri JSON (
About Protocol Buffers
It is a compact binary format that is faster to transfer and parse than JSON, especially for large datasets. It is combined with HTTP compression (Brotli, gzip/deflate) to reduce payload size further.
Note: Style information in vector tile services and feature services is provided as a plain JSON file.
Rate limiting and tiers
Hosted feature services have request rate considerations, which are discussed in this presentation.
For a broader view of usage policies and pricing, see the article on “Terms of Use & Pricing Differences”.
SDKs integration
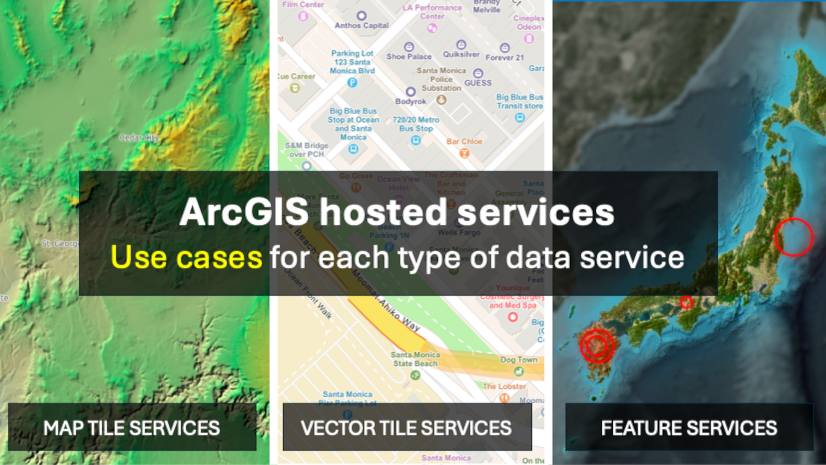
All three hosted data services can be loaded across multiple client SDKs:
- Map tile services: Delivered as XYZ raster tiles, a de facto standard that is supported by virtually all mapping SDKs.
- Vector tile services: Hosted vector tiles are encoded using the MVT specification, allowing them to be consumed directly by both Esri and non-Esri SDKs.
- Feature services: Since responses can be requested as GeoJSON, they are compatible with any client.
In terms of client-side layer performance:
- Map and vector tile services perform consistently across SDKs.
- Feature service performance, however, depends on how well each SDK supports available optimizations.
Note: When an SDK implements all feature service optimizations, performance is often indistinguishable from vector tile services.
Feature service optimizations by SDK
Next, we’ll compare the SDKs documented on developers.arcgis.com to show which feature service optimizations each one supports.
Esri’s ArcGIS Maps SDKs
Esri’s ArcGIS Maps SDKs (web and native) implement all these feature services performance optimizations out of the box, as explained in the Feature Tiles video.
Note: Although the video refers to the ArcGIS Maps SDK for JavaScript, the same optimizations apply to the ArcGIS Maps SDKs for Native Apps
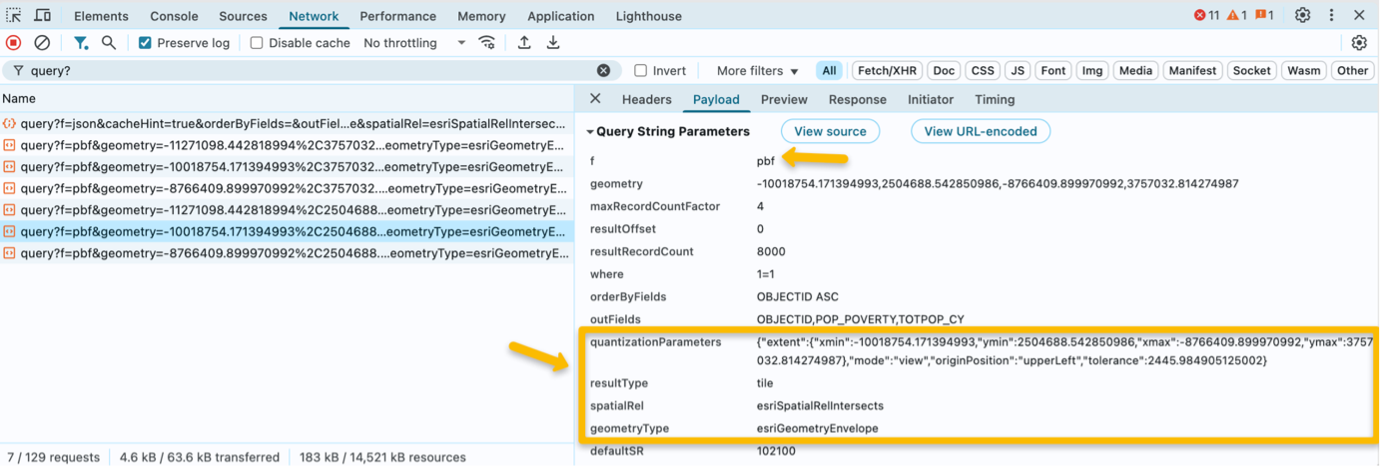
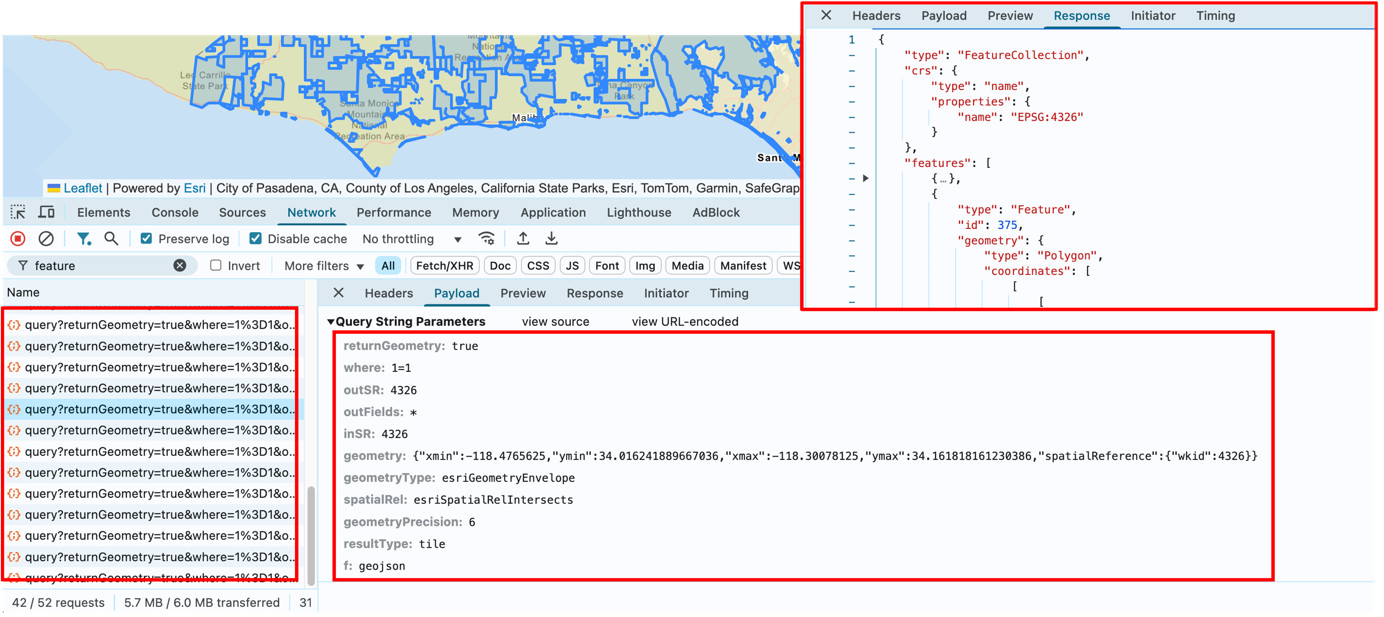
For example, if you inspect network requests in the Data-driven continuous color sample built with the ArcGIS Maps SDK for JavaScript, you’ll see queries returned as cached, quantized tiles, compressed with PBF.

To see cacheHint in action (which tells the service to cache query results), check the Intro to FeatureLayer example.
ArcGIS Maps SDKs go further than using PBF, quantization, and tiled queries; they also:
- Handle editing workflows automatically: when full geometric fidelity is required, the SDK fetches the complete data behind the scenes.
- Optimize attribute requests by default, querying only the fields needed for symbology and labeling unless you explicitly ask for more.
Additionally, ArcGIS Maps SDKs for Native maintain an in-memory geodatabase of requested features, and also track requested tiles and make use of ETags to avoid redundant queries. This reduces network traffic and leans on the local cache as much as possible.
Note: While in theory, any mapping library could support these feature services optimizations, at present, only the ArcGIS Maps SDKs have them all implemented.
Leaflet
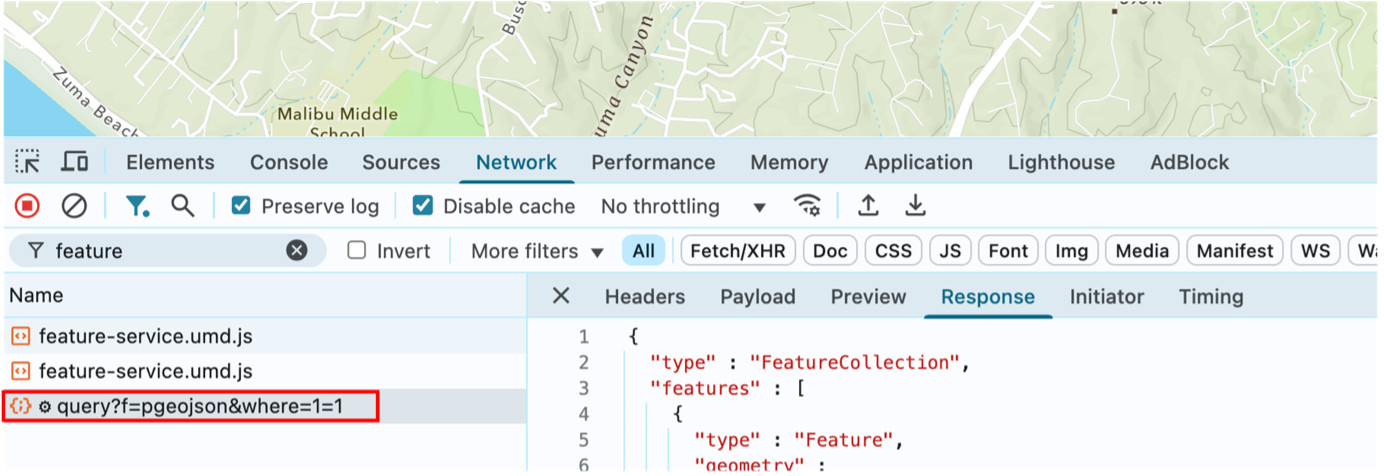
With the Esri Leaflet plugin, you can easily load feature services.
Network requests show that it also implements tiled queries, but by default, it doesn’t yet support PBF encoding or quantization.
MapLibre GL JS, OpenLayers, and CesiumJS
These SDKs load feature services through their GeoJSON output, but they don’t currently implement any of the optimization mechanisms available in feature services.
Note: Similar to Esri Leaflet, this new MapLibre GL JS plugin may implement some of these features in the future.
Next steps
In this article, we looked at how data is retrieved and transferred through REST APIs, and the key factors that shape the user experience. We also compared how different SDKs handle these services, noting where performance may vary.
Important note: If your application will use feature layers with large datasets and/or you expect high traffic, use the ArcGIS Maps SDKs or manually implement the remaining optimizations to avoid scalability and performance issues.
Do you want to go deeper? Here are some recommended resources:
- Explore step-by-step tutorials in the Portal and data services guide.
- Watch the “Road Ahead and Best Practices with Hosted Feature Services”.
- Read “Enhancements for Mapping More Data, More Efficiently in the Browser”.
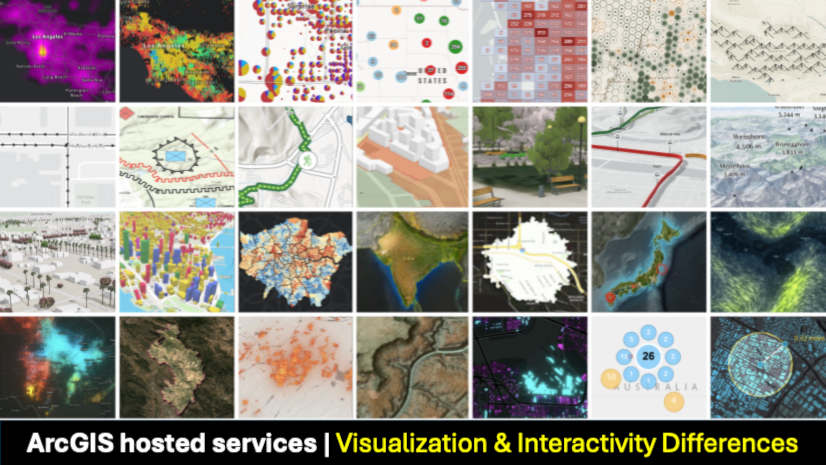
Don’t miss the next article, “Visualization & Interactivity Differences“, to learn more about what you can do with these services.
If you have questions, join the conversation in Esri Community > Developers. Or if you found something confusing or believe you’ve spotted an error or inconsistency in this article, reach out to us at developers@esri.com. Your input helps us improve the clarity and accuracy of this content.
Finally, if you found this article useful and believe others in your professional network may benefit from it, we would greatly appreciate it if you could share or engage with the post on LinkedIn, Bluesky, or X.
Thank you to everyone who contributed to the content of this article. You rock! Extra special thanks to Matt George, Nick Furness, Paul Barker, and Emily Hu.


Article Discussion: