Last updated: Sep 19, 2025
ℹ️ This blog series focuses on hosted data services in ArcGIS Online and ArcGIS Location Platform (more about the scope).
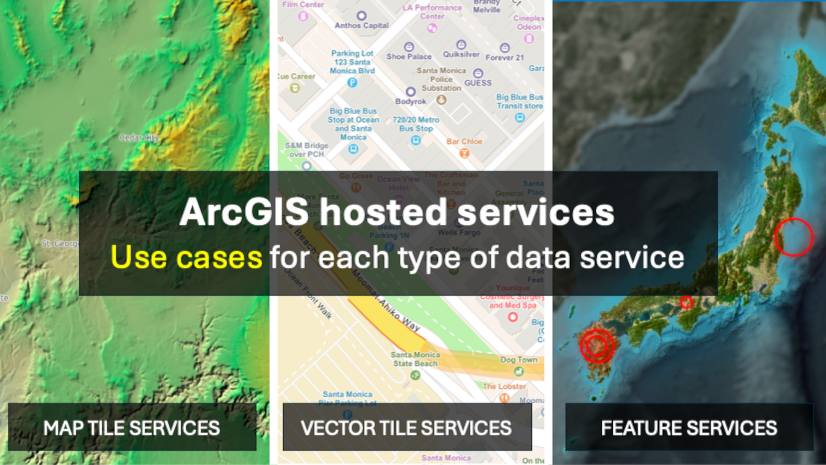
This second article in the blog series provides a high-level overview of hosted feature services, hosted vector tile services, and hosted map tile services.
We’ll look at what each service is designed for, how it compares to technologies you might already know, the kinds of data it’s typically used with, and common use cases for building applications with each type.
This article is intended for product managers, product owners, solution architects, and similar roles.
While this isn’t a very technical article, it will help you understand the key differences between these services.
Table of contents:
Why was this presentation order selected? …
Throughout this series, we will present the services in a progression, from the simpler and less commonly used to the more powerful and widely adopted.
Unlike the developer documentation, we present the services here in order from the most accessible to the most advanced to support initial understanding.
Beginner with geospatial data? You’ll want to read this first …
If you’re new to working with geospatial data, I highly recommend reading “What’s special about geospatial data?” before continuing with this article. It will help you get familiar with the basics and vocabulary (e.g., map tiles, data layers, vector data, etc) needed for this and the following articles.
Other ArcGIS data services (e.g., hosted image services) …
As we explained in the previous article, there are other popular and useful data services within the ArcGIS system optimized for other purposes, such as hosted image services, hosted scenes services, etc. Still, we won’t cover them since they are not available for ArcGIS Location Platform users.
Hosted map tile services
 PNG map tile
Map tile data services provide access to static, pre-rendered raster map tiles, typically in PNG format. They are frequently used as a background or to provide contextual data when combined with other, more interactive data layers.
Map tile services are straightforward to use, following the XYZ tiling scheme, a de facto standard. They are particularly well-suited for displaying:
- Spatially continuous data.
- Non-interactive reference data (e.g., background data).
- Large static datasets that don’t require frequent updates.
- Data that needs to be consumed by older SDKs or low-power devices.
If we had to compare map tile services to an alternative technology, WMTS would be the closest. Map tile services use a simple /z/x/y URL template, making integration very fast and straightforward. WMTS, although it also uses the XYZ tile schema, also relies on a more verbose request format, requiring an initial capabilities request, and it also has its own advantages: richer metadata, support for multiple projections, and more.
Map tile services use cases
Examples of application use cases that benefit from using map tile services:
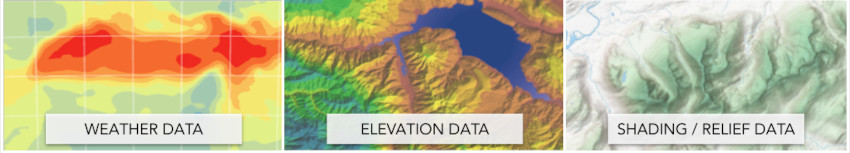
- Apps showing before and after images of disasters, visual comparison of areas affected by fires, floods, earthquakes, or hurricanes using pre- and post-event satellite images.
- Orientative maps of broadband/Internet coverage for telecom websites.
- Mobile signal maps using heatmaps to show 4G/5G coverage levels across different areas.
- Shaded relief maps offer a more realistic visual representation of terrain, such as mountains and valleys (e.g., in hiking or biking apps).
- Historical traffic maps that visualize average congestion levels.
- Urban activity visualizations showing where people concentrate (e.g, population density heatmaps, and urban noise).
- Estimated solar energy potential on rooftops showing accumulated solar radiation on building surfaces to help evaluate suitability for solar panel installation (used in sustainability apps or property platforms).
- Forecasted weather conditions visualized on maps (e.g., rainfall, temperature, or wind).
Map tile services shine for raster data and fast contextual maps, but when you need lighter, more interactive layers, vector tile services are the next step.
Hosted vector tile services
 PBF vector tileVector tile services provide access to pre-processed vector tile data, which consists of geographic features (such as points, lines, and polygons) along with their associated attribute data. Note that these tiles often contain clipped geometries.
It also includes a customizable style definition that controls the visual appearance of features based on attributes. The data is typically packaged in PBF format for efficient rendering.
This data service also uses the XYZ tile schema and is optimized for the following:
- Displaying large data sets that do not change frequently.
- Contextual data layers that support basic user interaction.
- Dynamic and optimized display of features and labels at different zoom levels.
- Limited interaction and on-the-fly style customization (compared to feature services).
If we had to compare vector tile services to an alternative technology, the closest would be MVT and OGC API – Tiles. Esri vector tile services use the same compact MVT format (fully compatible with the standard), but add a Vector Tile Index to support overzooming and improve storage usage. It is interoperable across both Esri and open-source ecosystems.
Vector tile services use cases
Examples of application use cases that benefit from using vector tile services, and how interaction and customization could be used:
Note: Keep in mind that many of these use cases are also well-suited for feature services, particularly when your data changes frequently, involves spatial analysis, or requires persistent edits. In practice, apps often combine vector tile services with feature services, so the choice of service type depends on your specific requirements.
- Hotel and rental search apps where users can interactively toggle POIs by category (e.g., restaurants, highlight landmarks, museums, or metro stations), and apply dynamic styling (such as coloring neighborhoods by price range).
- Property valuation tools where users can filter parcel boundaries and land use zones, toggle POIs by category (schools, parks, public transport), highlight elevation or flood zones on hover, and view popups with details like parcel size, tax value, or zoning rules to assess property value and livability.
- Turn-by-turn navigation app where users can switch between road and street styling by travel mode or dark/light theme, view and filter building footprints and POIs (points of interest) such as gas stations or rest stops, customize label language to their locale, and benefit from smooth rotation and dynamic styling for an intuitive navigation experience.
- Outdoor sports apps where users can view and toggle trails, contour lines, parks, green spaces, and amenities (e.g., water points, rest areas), access interactive popups with more details, and see highlighted elements.
- Retail locator maps where users can view shops, banks, or gas stations, filter results by brand or category, interact with pins showing store details, highlight locations on hover or tap, and style to emphasize nearby amenities or walking/driving access.
- Conference or trade fair maps where users can view indoor and outdoor POIs such as exhibitor booths, restrooms, stages, or floors, filter by category (e.g., booth type or talk type), open popups with exhibitor or speaker details, and use highlight-on-select navigation for easier wayfinding.
- Music festival maps where users can view event different zones, trails, and access paths, temporary infrastructure like stages or entrances, and POIs such as food vendors, toilets, or merch booths, interact with tap zones, follow highlighted accessibility paths, and read labels in their preferred language.
- Electoral results maps where users can view administrative boundaries from countries down to municipalities, de-emphasize non-populated areas, and see POIs like polling stations or campaign offices, apply dynamic styling by vote percentage, click regions to view detailed results, highlight turnout or winning parties on hover, and use custom legends or filters to compare across regions and elections.
Vector tile services are fast and lightweight to interact with, but they offer limited styling options and do not support real-time edits or advanced queries. For those needs, feature services are the better fit.
Hosted feature services
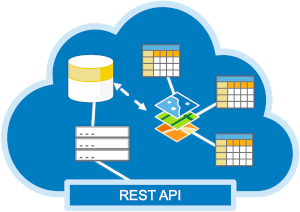 Feature service diagram
Hosted feature services provide access to spatial and non-spatial vector data. The data represents a collection of geographic features (points, lines, or polygons) and attributes. The data is usually packaged in PBF format and served as tiles for efficient rendering.
Similar to the previous data service, this is also a tiled service, optimized for:
- Visualizing large and detailed feature data.
- On-the-fly advanced style customization.
- Advanced user interactions, such as client-side spatial analysis.
- Performing SQL and server-side spatial queries.
- Interactive editing with persisted updates (online and offline).
- Simplify the data maintenance process.
Unlike the previous services, which access pre-rendered static tiles from disk, a feature service is a RESTful API that provides access to a spatial database with query and editing capabilities. To maintain performance, it employs mechanisms such as tiling, caching, and replicas. Feature services are designed to support collaborative, concurrent workflows (both online and offline) across multiple platforms.
It is important to note that although all types of services benefit from metadata and the ArcGIS geoinformation model, feature services embed richer metadata that exposes additional elements of the model, such as editable business rules and advanced styling preferences. As a result, you can inherit and reconfigure consistent configurations automatically, without requiring manual replication of settings across different clients.
About the ArcGIS geoinformation model
ArcGIS uses a layer abstraction system based on a cascading configuration model (similar to CSS) that lets you override default service configurations with an extended schema. This extended schema includes options such as chart configurations, graphical parameters, and other advanced customizations.
This approach makes services more flexible and reusable across multiple apps and platforms with minimal code, saving significant development time. It also ensures greater consistency (apps look and behave similarly by default), reducing the likelihood of human-introduced errors.
Learn more about this in “The ArcGIS geoinformation model video. A helpful tool for exploring how this model works is ArcGIS Assistant; however, it is not an official Esri product and is not covered by Esri Support. Be sure to read the warning page carefully before using it.
Hosted feature services use cases
Example of application use cases that benefit from using some data layers as feature services and how queries, edits, customization, and spatial analysis could be used:
- Infrastructure and inspection management where users can edit assets (buildings, pipelines, solar parks, roads, rail lines) from the office or the field, report issues, update status, and attach photos online or offline. Offline edits sync automatically once connectivity is restored. Features can be symbolized in real-time by inspection status (e.g., overdue in red, completed in green), and spatial queries highlight overdue inspections or stalled projects.
- Workforce coordination and task assignment, where users can manage editable features for worker locations and task status, update assignments online or offline, and symbolize tasks by role or priority. Spatial queries and joins can assign tasks based on proximity or within editable service areas, with updates syncing across devices.
- Fleet and route monitoring tools where users can track vehicle locations and planned routes, compare actual vs. scheduled movement, and identify delays in real time. Routes and vehicles can be styled in real time based on performance metrics (e.g., on-time, late). Dispatchers can edit stops directly in the service and run spatial analysis to optimize schedules.
- Asset and service availability tracking, where IoT systems or external feeds feature services with EV charging stations, bike parking, delivery lockers, and similar assets with real-time status and capacity. Symbolize features immediately by availability (e.g., complete, available, out of service) and use spatial analysis to identify underserved areas.
- Field survey and reporting where users can capture data for survey responses, inspections, or issue reports from mobile devices, attaching photos and form values. Supports real-time edits and offline collection with automatic sync. Data can be clustered, filtered, symbolized, and analyzed spatially (e.g., buffer reports to check which fall within or intersect a zone).
- Commercial site selection where users can combine editable parcel data with zoning, infrastructure, and competitor locations to identify the best parcels for expansion. Run spatial queries (e.g., “all parcels within 300 m of a transit stop but outside competitor buffers”) and style parcels by land value or permitted use. Users can sketch, compare, and share candidate sites.
- Environmental conservation planning where users can overlay habitats, wetlands, and protected areas with editable project boundaries to assess impact. Spatial analysis highlights conflicts (e.g., parcels overlapping migration corridors), and styling can show suitability scores based on sensitivity. Uses can also model alternative layouts and share proposals.
- Coverage and gap analysis, where users can visualize customer locations, service zones, and infrastructure as editable layers. Use overlays and filters to detect underserved areas or inefficiencies. Symbolize coverage intensity (e.g., color ramps for density) and edit zones to model scenarios, test alternatives, or apply manual corrections.
- Live election and results dashboard representing voting zones as polygon layers with real-time vote counts. Symbolize zones by leading candidate, turnout, or margin of victory. Use spatial filtering and aggregation to compare data across regions, and display charts on top of the map that update in real-time. Spatial analysis highlights anomalies such as unusually low turnout compared to neighboring areas.
About working with big data
If you are looking to address big data issues (velocity, volume, variety, etc.), you should manage them in specialized distributed systems like ArcGIS GeoAnalytics Engine, ArcGIS Velocity, or GeoEvent Server. You can then use these three services as intermediate layers to visualize and explore the pre-processed results.
Summary
Some datasets are inherently raster (e.g., aerial images or elevation models). Others originate as vector features (e.g., utility networks or traffic density), but may be pre-rendered as non-interactive raster tiles or vector tiles to improve performance, protect sensitive information, and, in the case of raster tiles, also to support clients with limited rendering capabilities.
Feature services can store the same types of data as vector tile services, but you are working with a database, which makes them better suited for scenarios that require highly interactive maps, allowing you to run performant server-side and client-side queries (including advanced spatial statistics) and manage real-time data updates (whether manual or automated).
A common issue is that developers sometimes try to build advanced experiences with vector or map tile services when feature services would be a better fit. While it is possible to replicate some of these capabilities, doing so typically requires more effort than expected. Beyond implementing client-side and server-side logic and connecting to a self-managed database and API, you also need to design and maintain update workflows to republish services whenever the underlying data changes (a task that is rarely straightforward and can quickly become complex).
For specific examples of geospatial data types supported by these services, see the drop-down menus below.
Examples of types of geospatial information delivered as map tiles
- Imagery and scanned maps:
- Satellite or aerial imagery: High-resolution photographs of the Earth’s surface captured from satellites, drones, planes, or helicopters.
- Historical or scanned paper maps: Digitized versions of archival cartography, including cadastral, archaeological, military, nautical, and topographic maps.
- Urban and infrastructure data:
- Connectivity and coverage: Mobile network signal coverage, broadband or fixed internet availability, and utility networks (e.g., water, electricity, gas, telecommunications, or sewage).
- Mobility and transportation: Traffic density, congestion or average travel time maps, public transport frequency or coverage, parking zones or use of public space.
- Urban activity and human behavior: Population density, pedestrian flows, energy consumption, and urban noise.
- Urban planning and services: Municipal service coverage, land use zoning, and urban expansion areas.
- Environmental and scientific data:
- Climate and weather models: Historical, predictions, or near-real-time data such as temperature, rainfall, wind speed, or storm intensity.
- Air quality data: Pollutants, noise levels, or ozone concentration.
- Geological and seismic hazards: Landslide risk zones, fault lines, earthquake-prone areas, or volcanic activity maps.
- Land cover, land use, and environmental condition: Rasterized categories describing how land is used (urban, forest, agriculture, water bodies, etc.), along with derived indicators such as vegetation health (e.g., NDVI) and soil moisture.
- Hydrology and water flow: Simulations of how water moves across terrain, where it collects, or areas at risk of flooding.
- Elevation and terrain data:
- Digital Elevation Models (DEM) and derived layers: Hillshade, slope/aspect, contours, terrain ruggedness, and results of viewshed analysis.
Examples of types of geospatial information delivered as vector tile services and feature services
The following examples include point, line, and polygon data types. Keep in mind that vector tile services are highly effective at optimizing the rendering and delivery of polygons and polylines, where simplification, tiling, and overzooming provide significant performance benefits, but they offer less benefit for point-heavy datasets
- Administrative boundaries:
- Administrative divisions: Countries, states, provinces, municipalities, and ZIP/postal codes.
- Environmental protection areas: National parks, marine reserves, and biosphere reserves.
- Parcels and cadastral units: Property boundaries and land parcels.
- Transportation networks:
- Roads and streets: Highways, roads, bike lanes, pedestrian paths, and bridges.
- Railways: Train lines, subway systems, and tram networks.
- Air transport: Airports, runways, airstrips, terminals, and helipads.
- Water transport: Ferry routes and water-based public transport.
- Trails and outdoor mobility: Hiking paths, bike routes, and walking trails.
- Utilities and infrastructure:
- Utility networks: Pipelines, power lines, and other visible infrastructure.
- Buildings and facilities:
- Building footprints: Residential, commercial, and industrial structures.
- Public facilities: Hospitals, fire stations, police stations, and city halls.
- Sports and recreation facilities: Stadiums, sports fields, gyms, and public pools.
- Land use and zoning:
- Urban land use: Residential, commercial, and industrial zones.
- Land cover classification: Urban, agricultural, industrial, and forested areas.
- Places and amenities:
- Commercial points of interest: Restaurants, shops, banks, and gas stations.
- Tourist attractions: Landmarks, monuments, museums, and viewpoints.
- Transport services: Bus stations, train terminals, and taxi stands.
- Parks and green spaces: Urban parks, playgrounds, gardens, and nature reserves.
- Natural features:
- Hydrography: Rivers, lakes, coastlines.
- Elevation-based layers: Contour lines.
Next steps
We hope this article has clarified the different use cases for each service type and provided a clear overview to help you better understand when to use each data service.
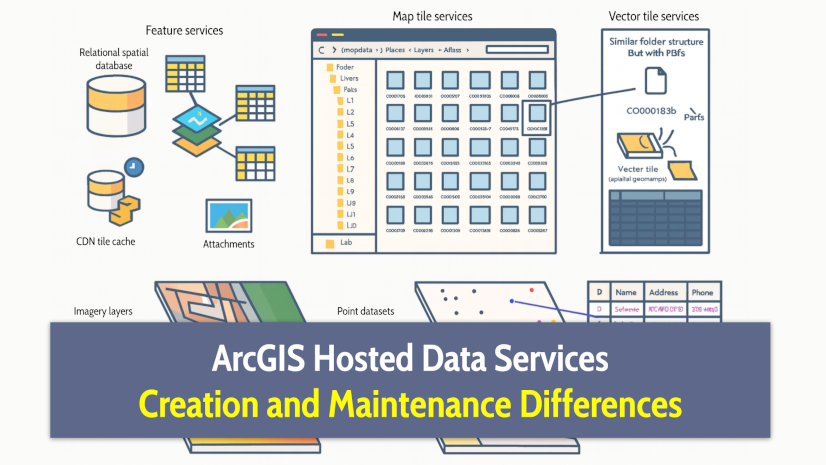
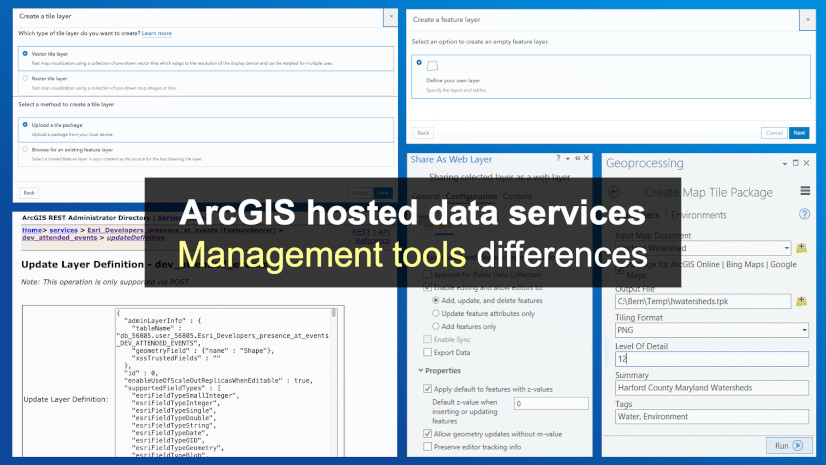
In the next article of this series, we’ll dive deeper into the technical side, how these hosted services are created, configured, and maintained: ArcGIS Hosted Data Services Creation and Maintenance Differences.
For hands-on guidance, see the Portal and data services guide > Data services chapter, where you’ll find detailed instructions and tutorials to get started with all three services.
If you feel something is unclear, spot an inconsistency, or notice that we’ve missed an important use case or data type for any of the services, we’d love to hear from you. Please reach out to us at developers@esri.com so we can keep improving the clarity and completeness of this content.
Finally, if you found this article useful and believe others in your professional network may benefit from it, we would greatly appreciate it if you could share or engage with the post on LinkedIn, Bluesky, or X.
Thank you to everyone who contributed to the content of this article. You rock! Extra special thanks to Matt George, Allan Laframboise, and Nico Loza.


Article Discussion: