by David Northup, GIS Analyst, Integrated Spatial Solutions Inc. (ISSI)
 The modeling application was designed for a hydroelectric power production system in CA. The system is located in the central Sierra Nevada Mountains, and is comprised of 6 major reservoirs, 27 dams, 9 powerhouses, and miles of interconnecting infrastructure. To better understand water volumes and flows on a real-time basis, the modeling application provides regular reports on the details of impending changes based upon current operation protocols, forecasts, and observed weather conditions. Operation managers use this information to adjust water volumes among the different reservoirs and control flows based on forecasted scenarios generated by the hydrologic and hydraulic (H&H) models.
The modeling application is a real-time, fully automated application that simulates the water cycle based on meteorological data and real-time field data.
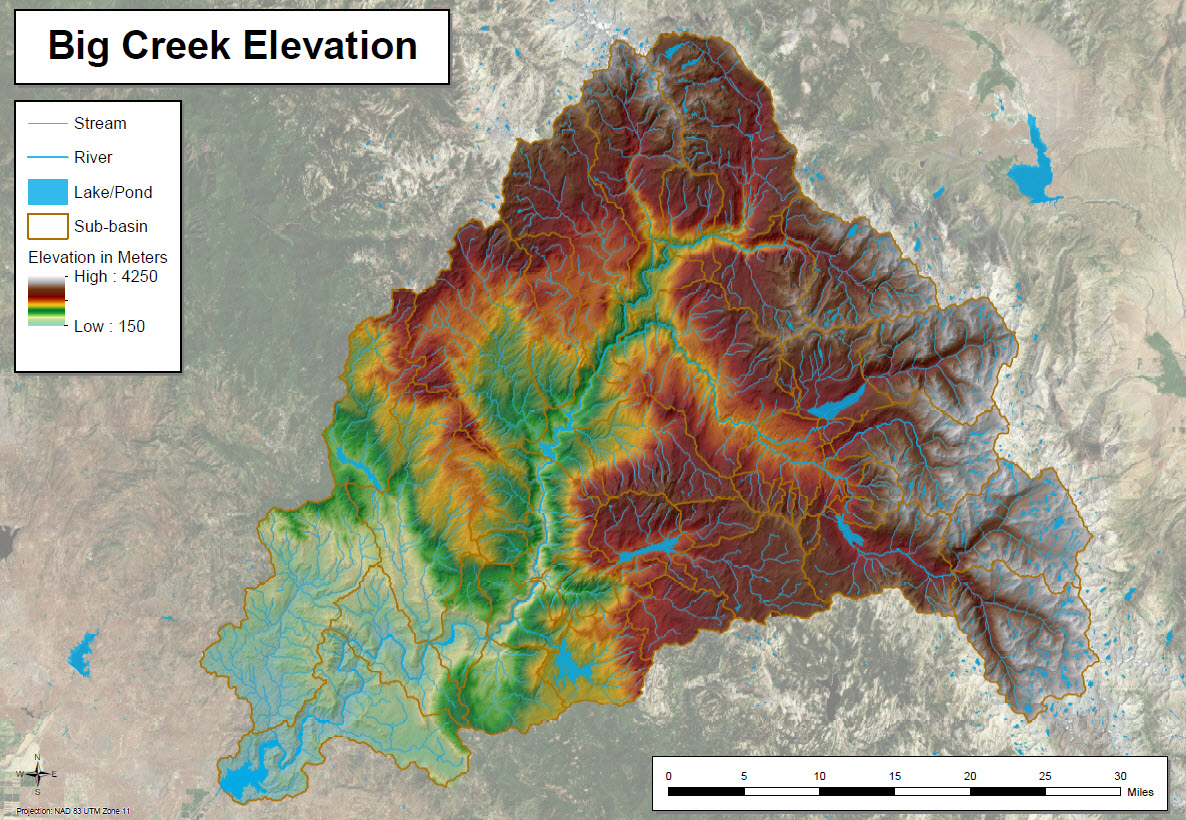
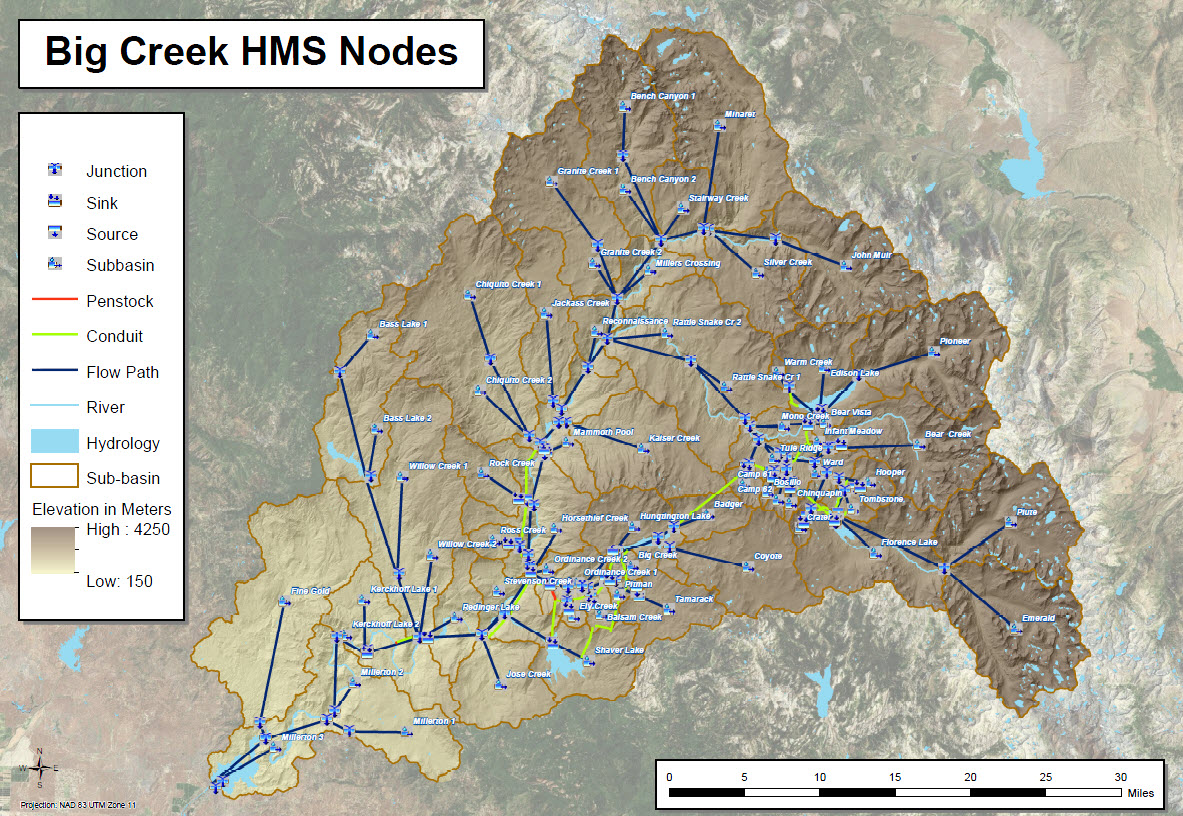
The areas power company collaborated with ISSI to integrate these systems and data sources by implementing ArcHydro and combined the reservoirs, conduits, and streams to produce a spatial network of the area. This network was then used to configure the underlying H&H models. These H&H models integrate all software packages contributing data to the core modeling system, Real-Time System (RTS) program. RTS includes HEC-RAS, HEC-HMS, and HEC-ResSim H&H models to simulate the water cycle on live data feeds, including current and forecast gridded meteorological data, and real-time field data from reservoirs and conduits.
To make all of these systems and data sources come together we implemented Arc Hydro and combined the reservoirs, conduits, and streams to produce a spatial network of the area. This network was then used to configure the underlying H&H models. These H&H models integrate all software packages contributing data to the core modeling system, Real-Time System (RTS) program .

Figure 1: Screen shot of the HEC-RTS stream network and watershed.
To simulate the forecasted scenarios within the hydroelectric system, we needed a variety of different data sources to be continually connected to, and data extracted from these to be aggregated and processed. This required the integration of several software packages. To access the real-time field data (such as reservoir water levels or conduit flow speeds), we used beta middleware to connect ArcGIS to the power companies hydrologic time-series database. Perl and Shell scripts were developed to check for and retrieve meteorological data from third party suppliers. Python and ArcPy were utilized to process this data into formats consumable by the Corps of Engineers RTS program suite.

Figure 2: Gridded temperature and precipitation data Metrologic input.
Currently, the modeling application runs every six hours and generates simulated results including reservoir levels, network flow volume, and river hydraulics. These results are extracted and formatted into a PDF report for review by hydrologists. For more additional information please see the modeling application technical paper or contact Integrated Spatial Solutions Inc.


Article Discussion: