Starting with the October 2023 release of Esri’s Vintage 2023 Time Series Totals, historical data are provided for every year from 2010 up to the most current vintage of Esri’s Updated Demographics. These data are designed for temporal analysis so that users can track changes in total population, housing units, and households across time using the latest geography.
What are the benefits of historical demographic data?
Historical demographic data can be leveraged for
the following uses:
Accurate temporal analysis
Working across unified boundaries
Incorporating Census corrections
Understanding intercensal trends
Let’s examine each one of these uses individually.
- Temporal Analysis
Esri Time Series Totals provide a lookback to the year 2010 so that you can know how an area has changed over time. Population and housing growth or decline has traditionally been measured by comparing the change from a previous decennial census to estimates from the current year of Esri Updated Demographics. While this approach is valuable, change over multiple years is not linear, and many analysts want a better understanding of how an area has transformed from year to year. Esri’s Time Series Totals are built to provide a consistent temporal dataset that can be used to evaluate year-over-year change.
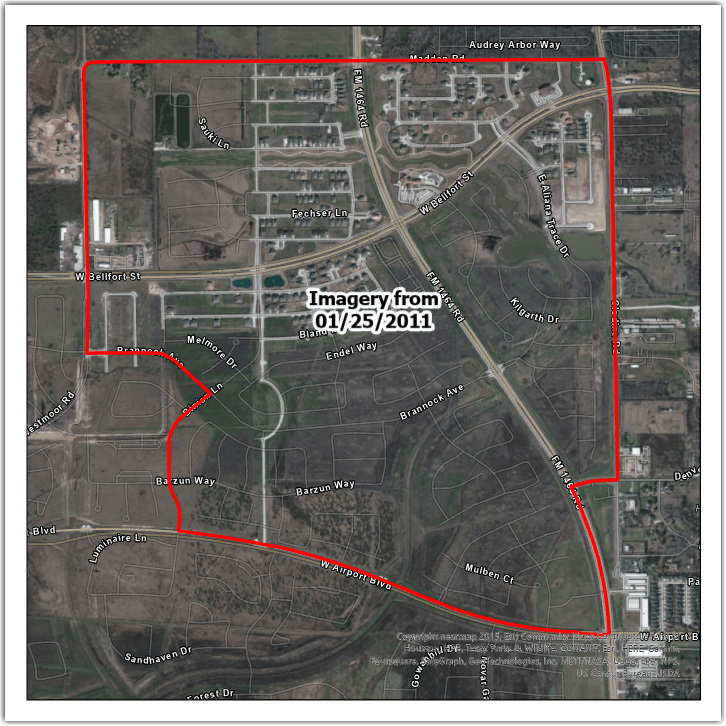
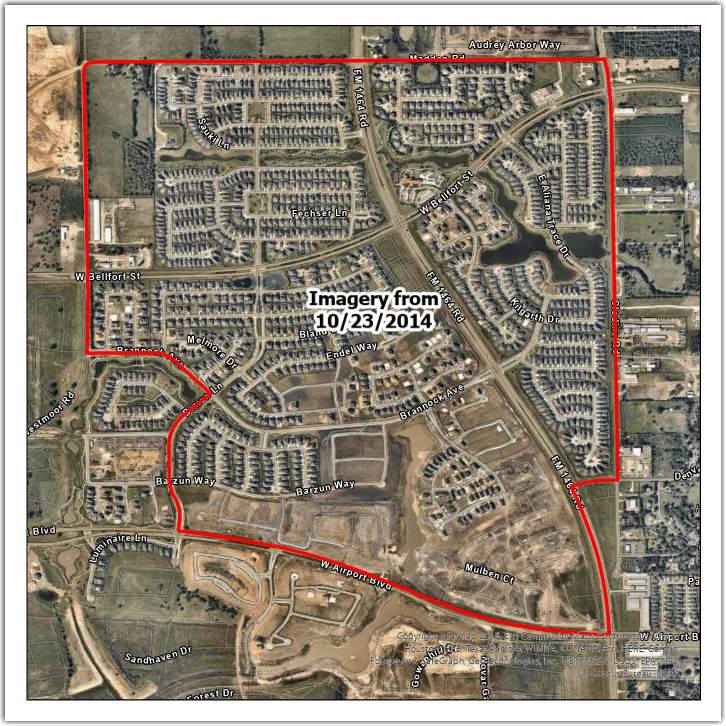
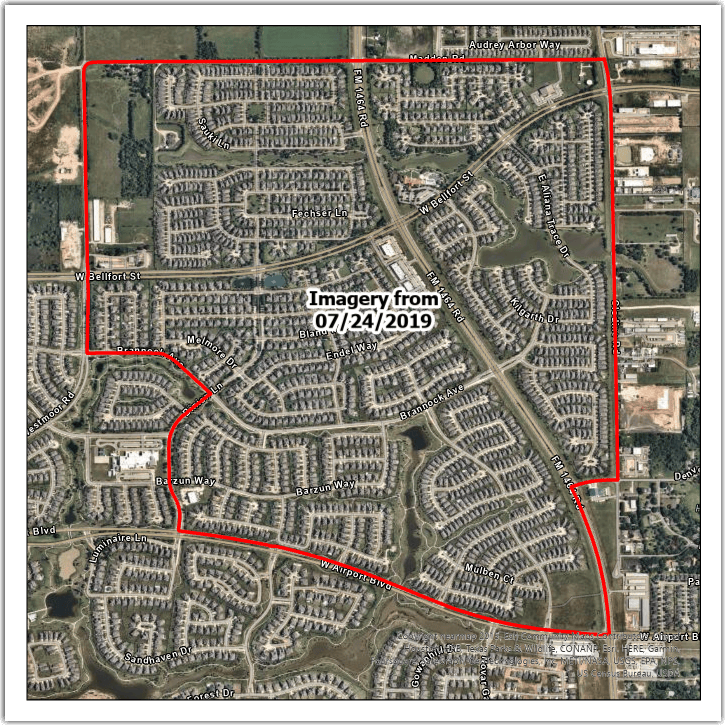
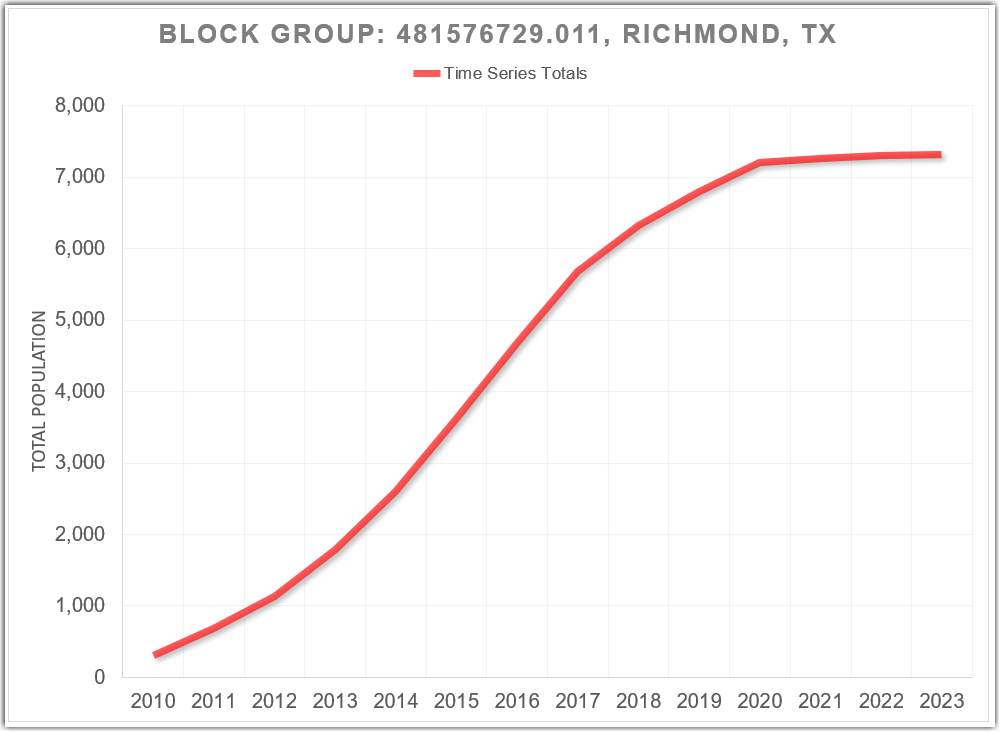
Looking at a single Census Block Group (481576729.011) in Richmond, Texas we can see how this area grew from around 300 people in 2010 to over 7,300 people in 2023.
New housing development starts after the Census 2010 count.
Much of the development is complete by 2014.
The block group is nearly fully built out by 2019.
The chart below displays the full total population time series for this block group. This chart shows multiple patterns of growth. Looking at the change from 2010 to 2020 we see that the population in this block group grew by over 2,000 percent. However, looking at the change from 2020 to 2023 the growth is flat. This is because the block group is nearly built out, and there is little available land left for new housing. Leveraging Esri’s Time Series Totals data allows users to better understand nuanced patterns of change when yearly change is not linear.
- Unified Boundaries
Data are collected for legal, administrative, and statistical boundaries which can change over time. For example, ZIP Codes areas change, places change as they annex or de-annex land, congressional districts are redrawn by state legislatures, metropolitan designations change with population size and commuting patterns, and standard census geographies like blocks, block groups and tracts are redrawn every ten years to better reflect current population and housing. It can be challenging to analyze data for an area when the underlying boundaries have changed. Often this work requires building a correspondence or crosswalk from the older boundary to the newer boundary. Esri’s Time Series Totals solve this problem by doing the conversion work for our users and applying current geographical boundaries for all years of data in the time series.
In this example we want to understand how much the total population of the Virginia Beach-Norfolk-Newport News metropolitan area has grown from 2017 to 2023. This analysis is complicated by the fact that the metro area boundary changed between 2017 and 2023. In 2020 Esri Updated Demographics incorporated the Core Based Statistical Area (CBSA) changes for this metro area, including the addition of two Virginia counties and one North Carolina county. Looking at the 2017 and 2023 maps we can see the expansion of the boundary between the two time points.
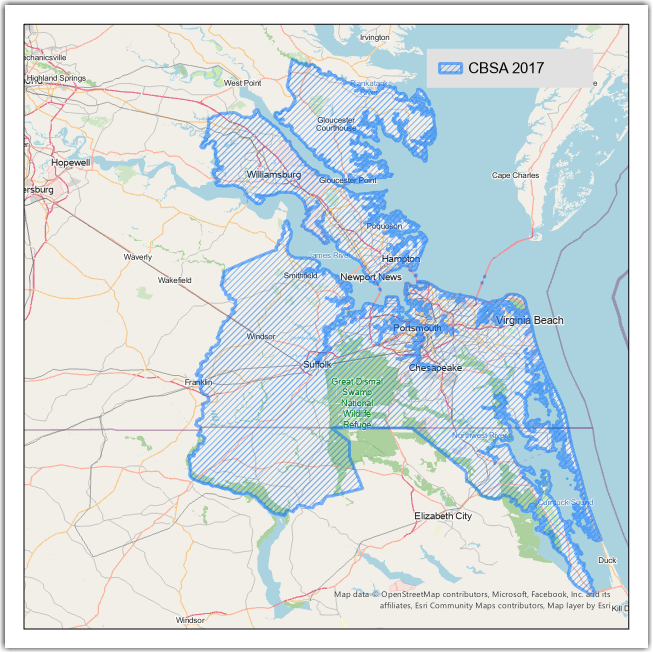
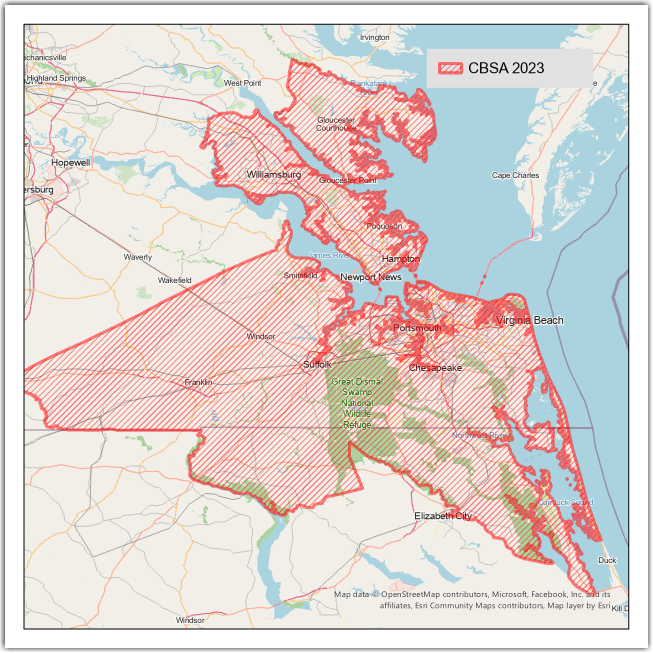
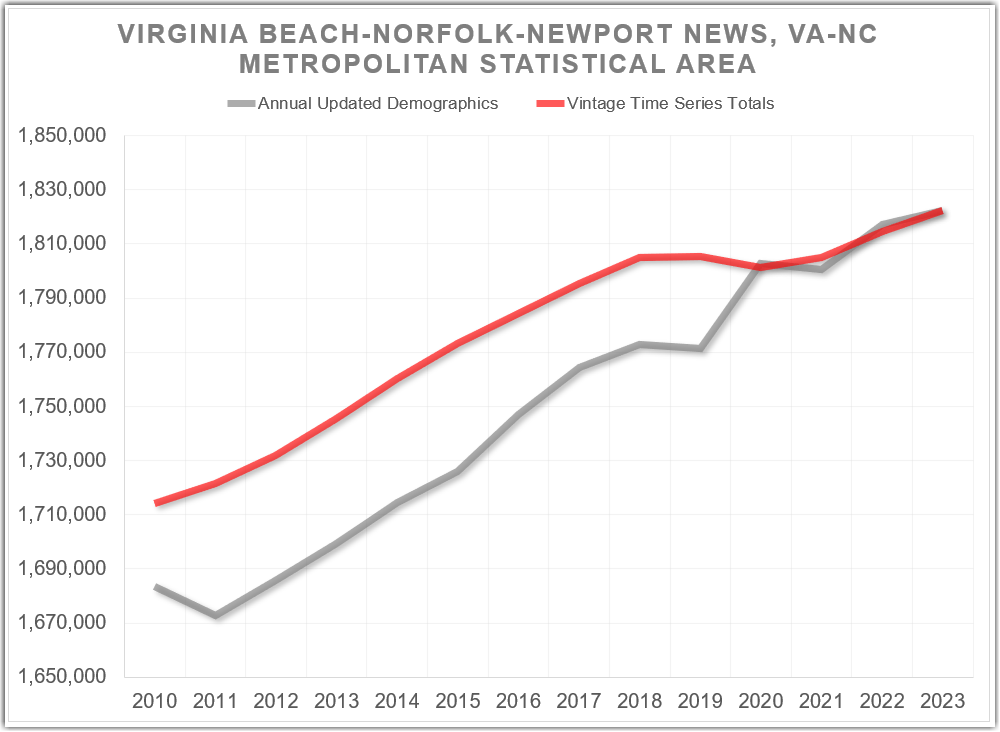
Annual releases of Esri Updated Demographics, shown in grey in the chart below, indicate a large increase in the population of the Virginia Beach-Norfolk-Newport News metropolitan area from 2019 to 2020. This increase is largely due to the addition of the three counties to the CBSA.
We want to know how much the area has grown from 2017 to 2023 using the current boundaries for the metropolitan area. To answer that question, the Time Series Totals, in red, show the year-over-year pattern of population growth based on current geography.
- Census Corrections
Although the decennial census is the most complete count of America’s population and housing, it is not perfect. Throughout the decade the Census Bureau will release official corrections. Analysts at Esri also discover errors with the Census enumeration. Typical census errors include missed housing units, demolished housing, housing units counted where there are none, and group quarters that were misclassified or counted in the wrong location. Both errors published by the Census Bureau and errors discovered by analysts at Esri are corrected in Time Series Totals for the decennial years 2010 and 2020.
In addition to enumeration errors, Census 2020 also includes impossible and improbable statistics, the product of a new privacy protection technique called differential privacy. Esri has made corrections for these irregularities so that decennial census data maintain the demographic consistency that we have become accustomed to. Examples of impossible statistics from Census 2020 include households but no household population, household population but no households, and more households than household population. Examples of improbable statistics from Census 2020 include extremely large average persons per household. Both impossible and improbable statistics from Census 2020 are realigned in Esri’s 2020 Time Series Totals data.
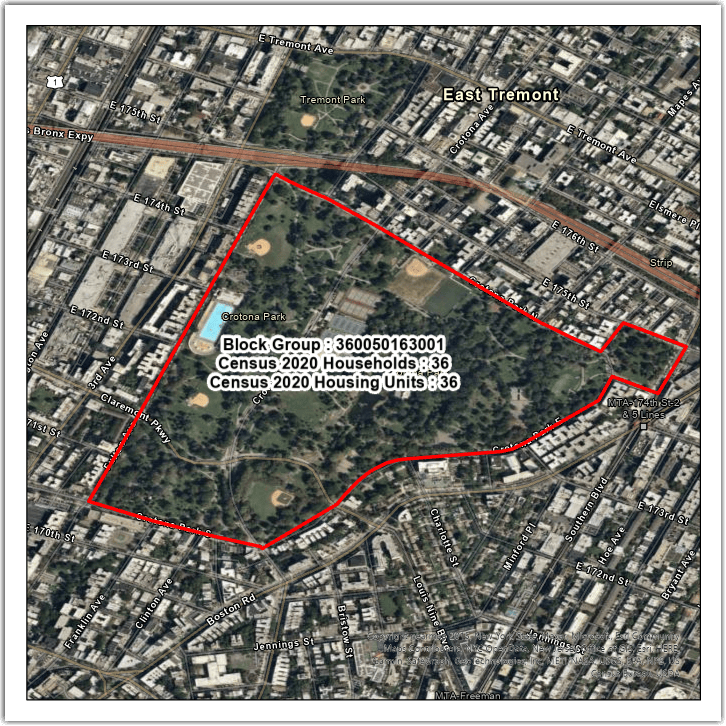
Here we see an example of an enumeration error from Census 2020 where the Census Bureau counted 36 households and 36 housing units in Crotona Park in the South Bronx, New York City. However, there is no actual housing in this block group so Esri realigned the 2020 data in the Time Series Totals to reflect this correction.
- Intercensal Trends
Esri releases Annual Updated Demographics each June. These are ‘postcensal’ estimates, meaning that they build off the last decennial census as a starting point. Esri 2011 to 2021 estimates were built off the Census 2010 base. Esri 2022 and 2023 estimates were built off the Census 2020 base.
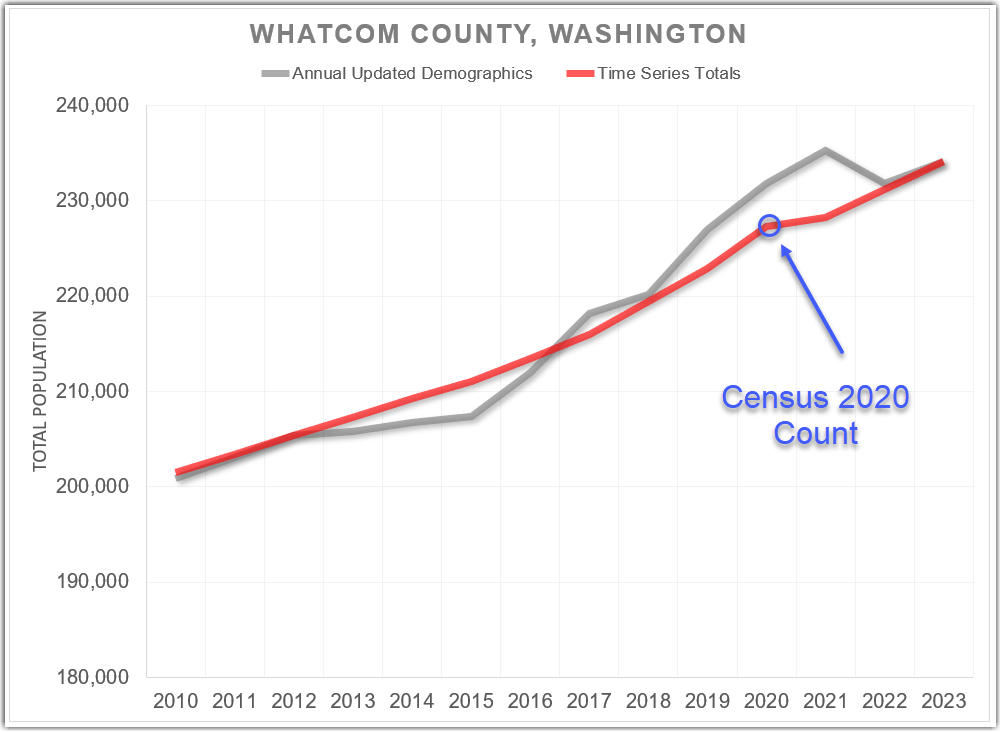
When estimates are developed between two decennial census points, they are called ‘intercensal’ estimates. The 2011 to 2019 Time Series Totals have been converted to current 2020-based geography and smoothed to match the 2010 to 2020 endpoints. These intercensal Time Series Totals distribute the difference between Esri’s 2020 postcensal estimate and the Census 2020 count, or error of closure, to all years in the 2011 to 2019 time series using multiple algorithms. This provides a consistent time series between known decennial census counts while adjusting for the annual fluctuation from Esri’s Annual Updated Demographics.
Annual releases of Esri Updated Demographics, shown in grey, show that Esri overestimated the 2020 total population for Whatcom County, Washington compared to the Census 2020 count. Time Series Totals, shown in red, are adjusted to hit the Census 2020 count while fitting the 2011 to 2019 estimates within the Census 2010 and Census 2020 known counts.
- Accessing the Data
With Esri’s October 2023 demographic release, Time Series Totals data are extended from a 2020 to 2023 times series to a 2010 to 2023 time series. Data are available for all geographic levels and any user-defined polygons such as rings or drive times. A more detailed methodology statement for Esri Time Series Totals can be found here.
To purchase Esri’s Time Series Totals dataset, contact our data sales team at 800-447-9778 or email your request to datasales@esri.com.
For more information about U.S. demographics click here.


Article Discussion: