Esri is committed to helping our users understand and leverage data from the United States Census Bureau. The decennial census is our once-a-decade snapshot of population and housing in the United States and has long been considered the gold standard for demographic data analysis. No two censuses are alike, and the 2020 decennial census includes notable changes to protect individuals’ privacy. As privacy protections are strengthened, some statistics at smaller levels of geography are compromised. Esri has realigned many of these irregularities so that Esri Updated Demographics provides the highest quality small area analysis possible.
What decennial census data have the Census Bureau released?
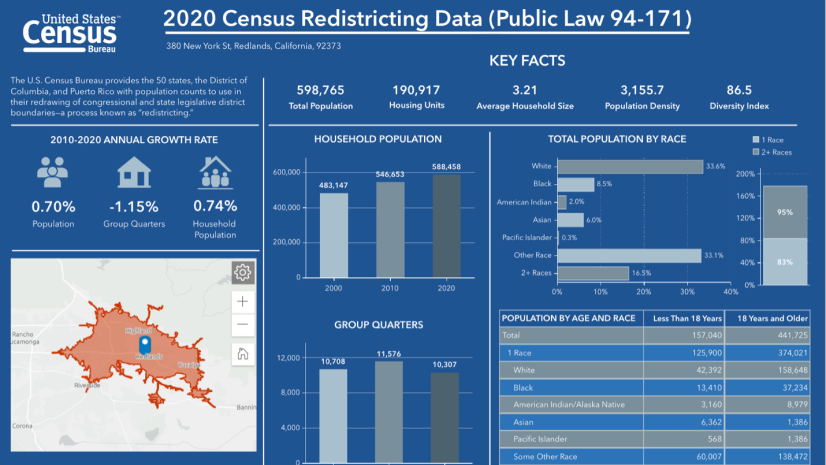
Due to the impact of the COVID-19 pandemic, data products from the decennial census are behind schedule relative to last decade. Redistricting Data (P.L. 94-171) from Census 2020 was released August 12, 2021. This product consists of census data at the block level and above for six tables covering race, ethnicity, population above and below 18 years of age, housing and group quarters. This product is used by the states and local jurisdictions to delineate voting districts for the next decade.
What’s different about decennial census data this decade?
The Census Bureau is required to maintain the confidentiality of individuals’ data under Title 13 of the United States Code. To satisfy this requirement, the Census Bureau changed to a new type of disclosure avoidance system for Census 2020. This system, called differential privacy, is an approach that aims to provide mathematical privacy assurances by adding uncertainty, or “noise,” to statistics. Census 2020 represents the first large-scale application of this new privacy system in the public data sphere.
What does “noise” in Census 2020 data look like?
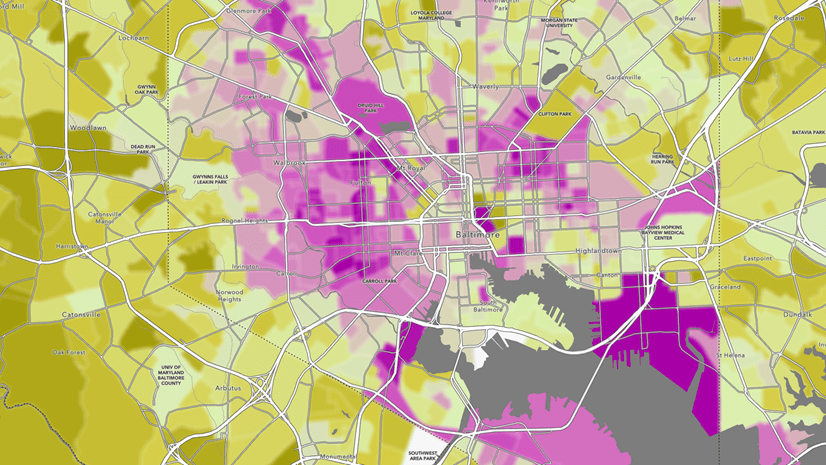
There has always been intentional noise in decennial census data, however differentially privatized data can produce results that users are not accustomed to. The magnitude of noise chosen by the Census Bureau aims to find a balance between accuracy and privacy. In general, noise will be less evident in large areas and more evident in small areas. Similarly, noise will be less evident in large groups of population or households and more evident in smaller groups of population or households. Differential privacy treats housing and population universes separately. Many of the irregularities such as negative or non-integer values created by this approach have been corrected by the Census Bureau through post-processing, however some spurious results remain in the published data. Although preventing respondent reidentification is critical, in some cases the results of this technique can produce impossible or improbable statistics.

What is Census 2020 Realignment by Esri?
For many variables in Esri Updated Demographics, Esri uses decennial census data as a base for current year estimates. Rather than building upon data that are known to be suspect or in error, Esri has realigned the Census 2020 data at the block group level to ensure that our current year estimates are built upon a more accurate base. Esri used detailed imagery, prior census data, third-party data and internal Esri databases to make modifications to the 2020 redistricting data to eliminate known instances of impossible or improbable data at the block group level.
Let’s examine some of the redistricting data anomalies that Esri has targeted for realignment.
Improbable Statistics
While not impossible, these statistics are considered very improbable and warrant additional scrutiny.
- Large average persons per household
Some numbers released in the Census 2020 redistricting data are highly unlikely based on what we know about typical living arrangements. In 2020, the national average number of persons living in the same household is 2.5. Only in rare cases does a neighborhood consist of more than ten persons living together in a typical household. In Census 2010, there were 3 block groups with over ten persons per household. In Census 2020 there are 238.
- All persons under 18 years of age
In rare cases children under 18 may live alone without any adults, but the likelihood of an entire block group containing all children under 18 is next to zero. In 2010 there were no block groups with only children under 18, but in 2020 there are 30 such block groups.
Impossible Statistics
While no census is perfect, past decennial census data have never reported impossible statistics. These statistics are considered impossible because they violate the definitions of the terms they are reporting on.
- Households but no household population
Households are, by definition, occupied housing units. Persons are required to occupy a housing unit for it to be considered a household, therefore you cannot have households without household population. There are 30 of these block groups in Census 2020. None existed in 2010.
- Household population but no households
Similarly, you cannot have household population without households. There are 223 block groups with this condition in Census 2020. None existed in 2010.
- More households than household population
Since households must be occupied by at least one person the smallest number of persons per household is one. If there are more households than household population then we wind up with fractions of persons per household. There are 60 block groups that break this rule in 2020, but none did in 2010.

Building better data
Realigning the redistricting data to better conform to possible and probable standards is not a straightforward process. To complete this work, Esri combined multiple datasets and leveraged their strengths to make informed decisions on where and how to alter the data. In some cases, current detailed imagery was used to correct the inventory of housing units. Some block groups were realigned based on detailed address-level data. In other cases, likely statistics from larger geographies were used to make informed predictions. Additionally, Esri used Tapestry Segmentation to realign some block groups with the characteristics of similar areas. In total, Esri realigned data in over 500 block groups. In addition to making these realignments, Esri continually makes corrections to decennial census data when errors are discovered. This effort will help to improve small area analysis in these areas when using Esri Updated Demographics.
Accessing the data
Esri Updated Demographics data that incorporates the realigned Census 2020 information can be accessed through various products or purchased as a stand-alone dataset. In addition to serving as a revised base for Esri Updated Demographics, Esri’s realigned 2020 data can be found in the Time Series Totals dataset. Esri’s Time Series database contains data for every year between the previous decennial census and Esri’s current year estimates at all levels of geography down to the block group level. These data are intended for temporal analysis and will always include the most up to date changes to the 2020 base data.


Article Discussion: