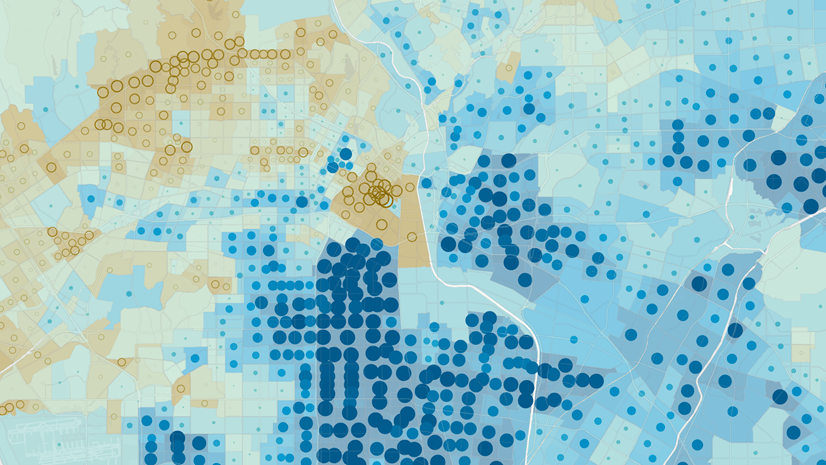
Esri’s 2023 U.S. Demographics include a variety of important updates that reflect the demographic and socioeconomic landscape of the U.S. Not only do the 2023 estimates incorporate the latest available sources and methodology improvements, they also include some new data measures to help users understand socioeconomic status and income inequality more effectively.
What’s New
Esri 2023 U.S. Demographics are available for all standard Census geographic levels (states, counties, census tracts, and block groups) as well as Core Based Statistical Areas (CBSAs), Designated Market Areas (DMAs), Congressional Districts (CDs), Places, County Subdivisions (CSDs), and residential ZIP Codes. This release reflects new boundaries for Places, DMAs, Congressional Districts, and ZIP Codes.
Esri Updated Demographics represent the suite of annually updated U.S. demographic data that provide current-year and five-year forecasts for more than two thousand demographic and socioeconomic characteristics. New in the 2023 release:
- Data updated to 2023 and 2028
- New socioeconomic variables: Socioeconomic Index, Gini Index, Ratios of Income Inequality, Households in Income Tiers for 2023 and 2028 (see Definitions)
- New Labor Force variables by male and female
- Read more in the Release Notes.
Esri Census Demographics include the U.S. Census Bureau’s 2017-2021 American Community Survey (ACS) 5-year data, 2020 Census data, and portions of Census 2010 and 2000 data in 2020 Census geography. New in the 2023 release:
- Data are updated to represent 2023 boundary revisions as noted above.
- New Poverty Index added in the ACS 2017-2021 5-year data.
- Read more in the Release Notes.
Esri Tapestry Segmentation provides a detailed description of America’s neighborhoods—U.S. residential areas are divided into distinct segments based on their socioeconomic and demographic composition. Neighborhoods with the most similar characteristics are grouped together, and neighborhoods showing divergent characteristics are separated. New in the 2023 release:
- Data updated to 2023
- Read more in the Release Notes.
Esri Consumer Spending includes details about the products and services that consumers are buying. Data are reported by product or service and include total expenditures, average spending per household, and a Spending Potential Index (SPI). Current-year and five-year consumer spending forecast data are available. New in the 2023 release:
- Data updated to 2023 and 2028.
- Esri has integrated the latest Consumer Expenditure Surveys (CEX), 2019-2021, from the Bureau of Labor Statistics (BLS).
- Read more in the Release Notes.
Esri Market Potential provides details about what type of goods, services, and activities consumers use and demand. It includes consumer attitudes on topics such as spending, health, and the environment. The database is based on survey data from MRI-Simmons and provides the expected number of consumers and a Market Potential Index (MPI). New in the 2023 release:
- Data updated to 2023
- 129 new attributes covering food delivery/take-out, video streaming services, IM/video chat, digital payment services, and more.
- 37 attributes removed that are no longer applicable or replaced by other attributes.
- Esri has integrated the latest MRI-Simmons Doublebase 2022.
- Read more in the Release Notes.
Esri Business Summary summarizes businesses for specified North American Industry Classification System (NAICS) and Standard Industrial Classification (SIC) summary categories by geography and includes total number of businesses, total sales, and total number of employees. New in the 2023 release:
- Data updated to 2023
- Data reflect the transition to the newer 2022 NAICS classification system resulting in removal of two categories: N19 Misc Retailers and N20 Nonstore Retailers. Businesses formerly in those categories are now included in other more applicable NAICS categories.
- Read more in the Release Notes.
Get Started
Esri U.S. Demographics are accessible in various ways from Esri…
ArcGIS Online and ArcGIS Pro
- Use Enrich Layer to append location-based data to points, lines, or areas.
ArcGIS Business Analyst
- Identify sites and evaluate markets with ArcGIS Business Analyst, demographic mapping software.
ArcGIS Platform
- Enhance workflows and apps with the ArcGIS GeoEnrichment Service – Enrich data with additional location-based information about people and places in a specific area.
Reports and Data
- Just need a report? Buy Esri Reports
- Just need data? Contact datasales@esri.com.


Article Discussion: