The Census Bureau will soon be releasing the first counts from the 2020 decennial census. This first release of data will contain the 2020 state population counts for use in congressional apportionment. Apportionment is the process of allocating the 435 seats of the U.S. House of Representatives among the 50 states based on the population totals. The District of Columbia and US territories are not included in apportionment as they do not have seats in the U.S. House of Representatives. The population counts used in apportionment include the resident population of the 50 states plus overseas federal employees (military and civilian) and their dependents living with them who could be allocated to their home states.
Esri produces annual Updated Demographics that estimate total population along with thousands of other demographic and economic variables. Esri Updated Demographics are available down to the census block-group level. However, for this exercise we will be focusing on state-level estimates. Each decade we like to have a little fun by using our population estimates to predict the apportionment of House seats before the Census releases the official counts. In 2010, Esri managed to correctly predict the allocation of all 435 seats.
Esri 2020 Updated Demographics were released in June 2020. These estimates reflect a July 1st point-in-time estimate. The decennial census uses an April 1st reference point for its enumeration. To make our best estimate of apportionment population we adjusted our 2020 July estimates to match the census April 1st date.
To serve as a source of comparison, the US Census Bureau Population Estimates Program (PEP) produces demographic estimates for states as well as smaller jurisdictions including data on age, sex, race and ethnicity. The most recent PEP estimates were released in December 2020. The PEP estimates also use a July 1st point in time estimate. To make for an apples-to-apples comparison we adjusted the July 1st PEP estimates to also reflect the April 1st date. The process for adjusting back to April was the same for Esri Updated Demographics and PEP estimates*.
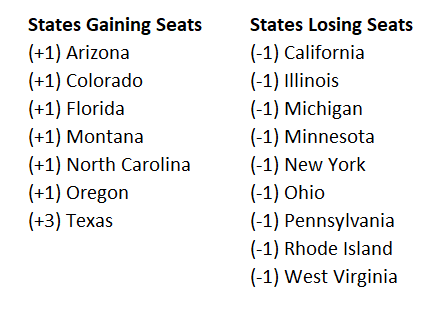
Based on the Esri 2020 April 1st values, it is estimated that, compared to the current seat apportionment determined by the 2010 Census, nine states will lose one seat, six states will gain one seat, and one state will gain three seats. The final five seats in the apportionment process (seats 431-435) are given to Alabama, Montana, Texas, Arizona, and California. These “bubble” states are at the highest risk to lose seats as a result of any differences between the population projections and the actual Census 2020 counts. On the other hand, the five states that are closest to gaining additional seats are West Virginia, Minnesota, Ohio, Rhode Island, and Florida (four of which are projected to lose a seat when compared to the current 2010 apportionment). Based on these projections this would be the first time since statehood that California would lose a congressional seat.
Click the map for more information. Click on a state to reveal specific details including a timeline of seat apportionment from 1910 to 2020.:
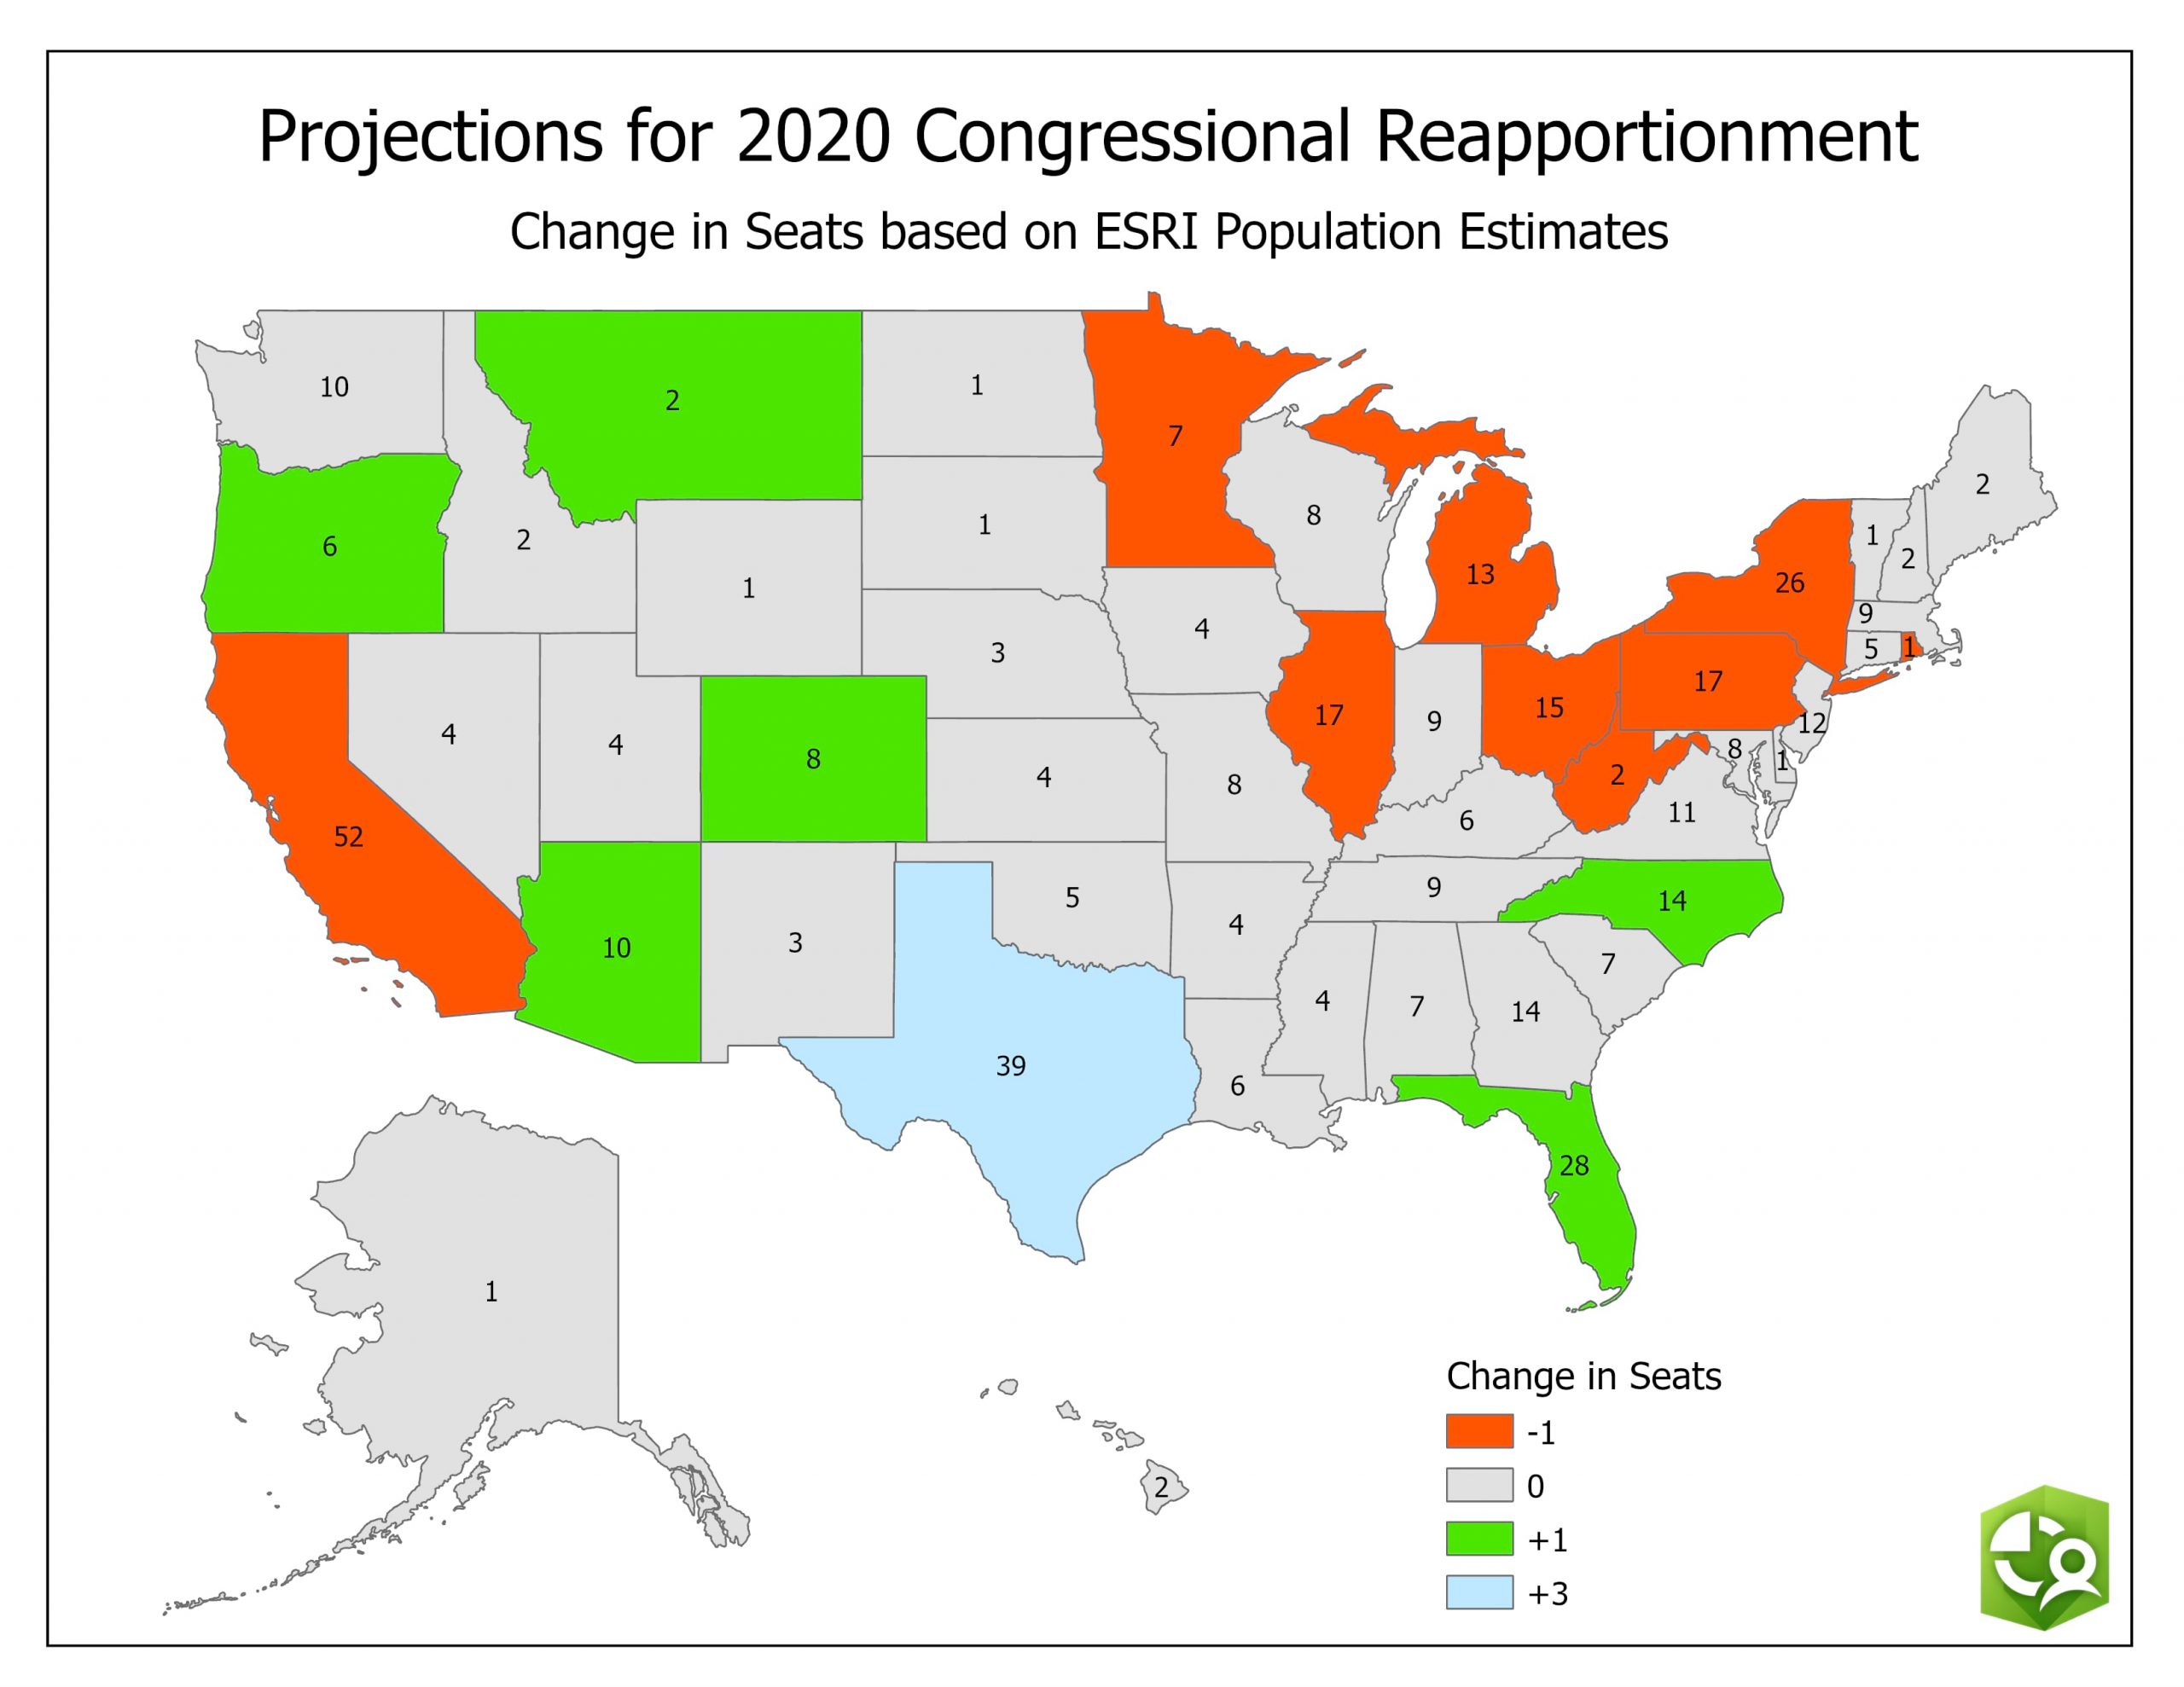
Although the PEP April 1st estimates largely paint the same picture there are a few differences. Based on the Census Bureau’s PEP estimates, Florida is expected to pick up two seats in the U.S. House of Representatives and New York is expected to lose two seats.
Esri and PEP use very different methods to derive these estimates. The Census uses a cohort-component method whereas Esri uses a mixture of public and private data in a modified housing unit-based method. The fact that both sources are in general agreement offers a fair amount of conviction that Esri and PEP are in the ballpark for our respective 2020 predictions. However, we will not be certain until the official numbers are released.
*July 1st estimates were converted to April 1st estimates using a combination of annual growth rates from 2010 through 2020. This growth rate was applied to the July 1st estimate to subtract a quarter year of growth and derive an estimate representing April 1st.
Accessing the Esri 2020 Congressional Apportionment Projections story map will provide additional information on the apportionment projections. Click on a state to reveal specific details including a timeline of seat apportionment from 1910 to 2020.


Article Discussion: