The US Census Bureau has been working diligently to refine the Disclosure Avoidance System (DAS) for the Census 2020 data releases. The DAS is an essential component of this decade’s census data releases because the Census Bureau is required by law to protect individual privacy under Title 13 of the United States Code. The DAS represents a compromise between accurate data and privacy protection. In prior censuses the Census Bureau used various forms of disclosure avoidance. These techniques historically consisted of table suppression and data swapping. Given the risk of a “reconstruction attack,” Census 2020 applies a more modern formal statistical approach of disclosure avoidance called differential privacy. Redistricting data (P.L. 94-171) from Census 2020 was released on August 12, 2021. However, DAS experimentation continues for the Census Bureau’s next product, the Demographic and Housing Characteristics (DHC) file, which is the Census 2020 partial replacement for Summary File 1 (SF1). The DHC, like the SF1, will contain more characteristics and crosstabulations. Data such as age by sex by race and household type will be included in the DHC. Refer to this blog for more information on the move to differential privacy.
Demonstration Data
To better understand what differentially privatized data look like, the Census Bureau has released a series of demonstration products that compare published Census 2010 data with incremental versions of the Census 2020 DAS applied to Census 2010 data. This allows for a comparison of the differences between the old method of data swapping and the new method of differential privacy. This comparison allows data users to test the Census 2020 DAS for usability in various workflows. The latest version of the DAS has a Privacy-Loss Budget (PLB) of 20.82 for the person tables and 22.77 for the housing tables. This version was published on March 16, 2022, and contains data planned for inclusion in the DHC. To make the differentially privatized Census 2010 demonstration data more accessible and easier to use, IPUMS NHGIS have processed and tabulated the released data for 20 geographic levels.
Compare Places
Esri used the latest version of Census demonstration data to analyze the differences between the demonstration and released data sets at the place level. Places are easy to interact with as we are all familiar with our general local areas, but not many people know what tract or block group they live in. There are 29,261 places in the Census 2010 places inventory. This includes 9,721 Census Designated Places (CDPs) and 19,540 incorporated jurisdictions. Use this application to better understand places that you are familiar with.
Are the differences between the latest version of demonstration data (DP) and the released Census 2010 data (SF1) acceptable for your use case?
Click the image below to launch the Dashboard
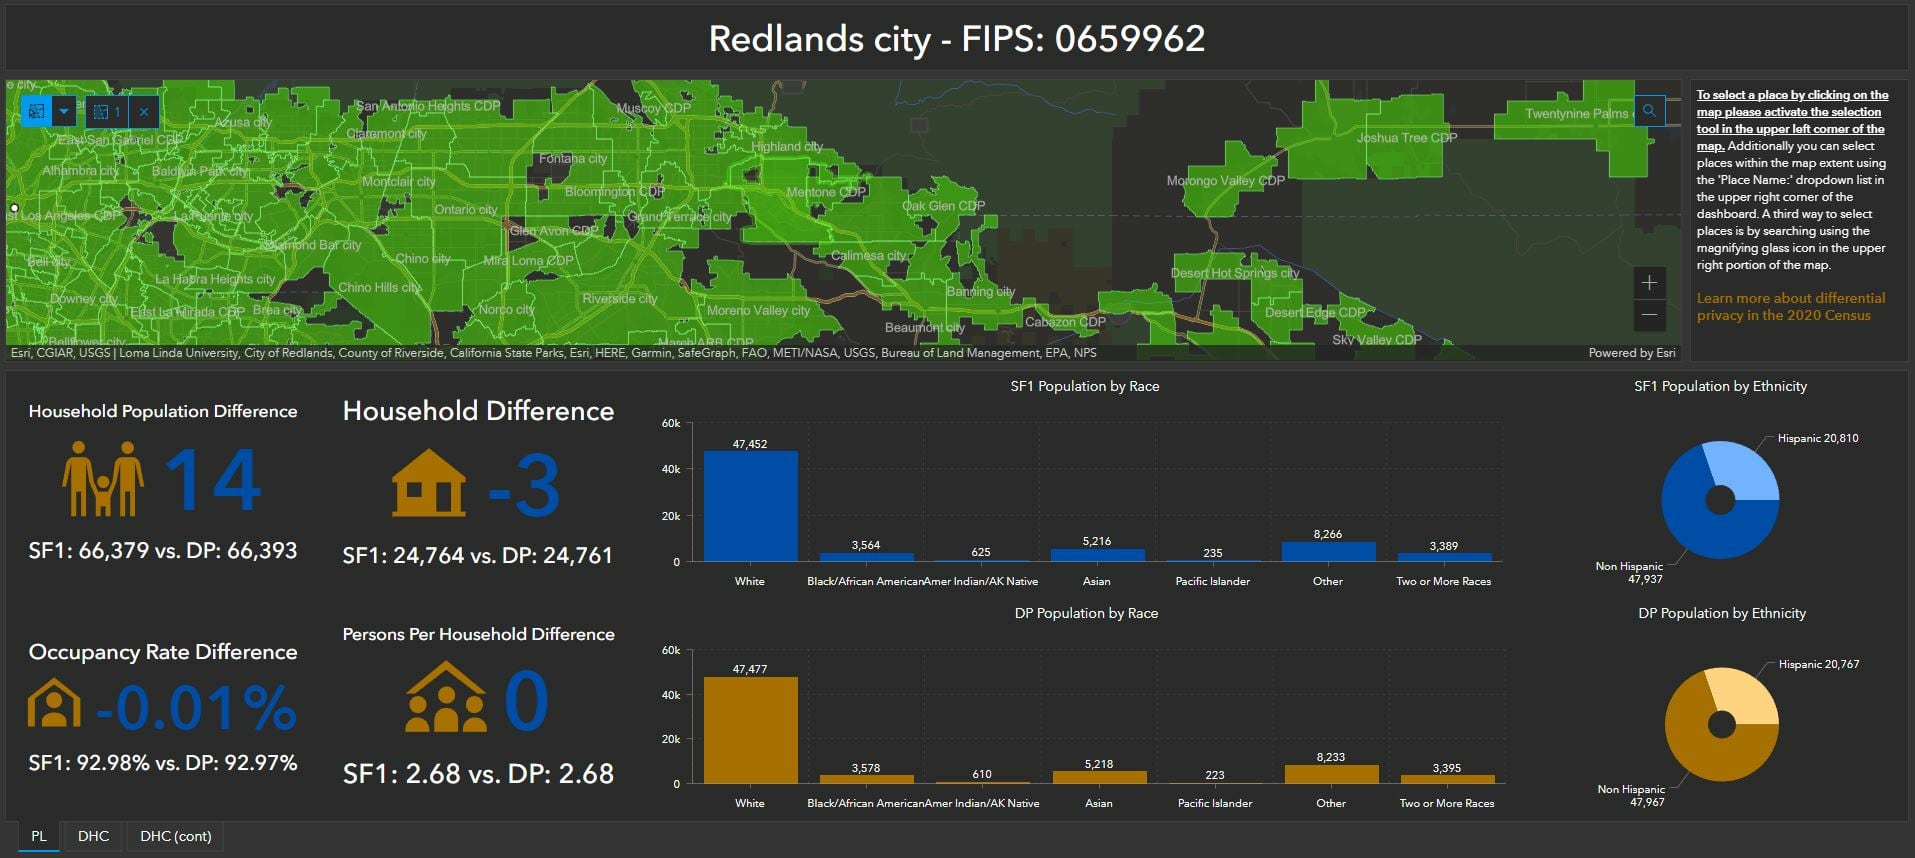
Differences across datasets
There are many ways to explore the differences between the two datasets. As you navigate through the application it is helpful to have some context as to how the differences in your places of interest compare to the typical differences among all places. For this context refer to the descriptive statistics below.
Descriptive Statistics For All 2010 Places
| Differences (DP – SF1) | Average | Min | Median | Max | SD | Min %* | Median %* | Max %* | MALPD | MAPD |
| Households | 0.0 | -94 | 0 | 114 | 7.8 | -90.0% | 0.0% | 600.0% | -0.1% | 2.7% |
| Family Households | 3.1 | -252 | 1 | 2,837 | 36.7 | -88.9% | 0.1% | 766.7% | 0.9% | 5.1% |
| Household Population | -0.7 | -289 | 0 | 422 | 13.8 | -75.0% | 0.0% | 412.5% | 0.1% | 0.9% |
| Population 18+ | -0.2 | -1,521 | 0 | 386 | 19.2 | -80.0% | 0.0% | 300.0% | 0.0% | 1.1% |
| Median Age | -0.1 | -63.0 | 0.0 | 88.5 | 2.8 | -90.2% | 0.0% | 148.9% | 0.0% | 2.9% |
| White | -2.1 | -452 | -1 | 140 | 14.5 | -90.6% | 0.0% | 700.0% | -0.5% | 2.1% |
| Black or African American | 0.8 | -117 | 0 | 313 | 10.2 | -94.7% | 0.0% | 2000.0% | 5.9% | 30.4% |
| Amer Indian or AK Native | 0.1 | -104 | 0 | 96 | 3.9 | -90.0% | 0.0% | 900.0% | 6.0% | 32.1% |
| Asian | 0.4 | -84 | 0 | 290 | 7.2 | -94.7% | 0.0% | 2700.0% | 8.7% | 35.2% |
| Pacific Islander | 0.0 | -104 | 0 | 117 | 3.3 | -93.3% | 0.0% | 1700.0% | 7.2% | 30.8% |
| Other | 0.6 | -105 | 0 | 256 | 9.3 | -96.0% | 0.0% | 2100.0% | 8.4% | 34.1% |
| Two or More Races | -0.6 | -445 | 0 | 325 | 12.9 | -94.7% | 0.0% | 1900.0% | 21.3% | 41.2% |
| Hispanic | 0.7 | -213 | 0 | 881 | 15.5 | -94.7% | 0.0% | 1200.0% | 10.1% | 28.2% |
| Non-Hispanic | -1.4 | -887 | 0 | 231 | 16.6 | -90.0% | 0.0% | 300.0% | -0.1% | 1.6% |
| Persons Per Household | 0.0 | -3.5 | 0.0 | 27.8 | 0.4 | N/A | N/A | N/A | 0.7% | 3.2% |
| Occupancy* | -0.1% | -100.0% | 0.0% | 100.0% | 4.7% | N/A | N/A | N/A | -0.1% | 2.7% |
| Sex Ratio | 0.0 | -6.3 | 0.0 | 18.5 | 0.3 | N/A | N/A | N/A | 1.3% | 6.1% |
MALPD = Mean Algebraic Percent Difference, a measure of bias
MAPD = Mean Absolute Percent Difference, a measure of average percent difference
SD = Standard Deviation
* These calculations are limited to cases where DP values are > 0 and SF1 values are > 0
Looking at these descriptive statistics we can see some patterns in how the proposed DAS impacts the data:
- The mean absolute percent difference for the White population is notably lower than all the other race groups at 2.1%. The tendency (bias) is to reduce the White population via differential privacy by 0.5%, on average.
- Two or More Races shows the largest change of all the race groups with a mean absolute percent difference of 41.2%. On average, this is a reduction of 0.6 persons. However, looking at the mean algebraic percentage difference shows an average increase of 21.3%. These measures show divergent trends because we are often dealing with small numbers at the place level, and percent increase has no limit while percent decrease is limited to -100%.
- Persons Per Household (PPH) is a sensitive measure used in planning and program administration. The mean absolute difference in PPH is 3.2% with a tendency (bias) for the DP figures to be higher than SF1 by 0.7%. The maximum difference is 27.8, and this is a result of the SF1 figure sitting at 3.2 while the DP PPH is 31.
- The mean algebraic percent difference for median age is 0%, but the average absolute percent difference is 2.9%. This means that there are differences but no directional bias, on average. The largest decline in median age from SF1 to DP is 63 years. As expected, this occurs in an area with very small estimates: Monowi village, Nebraska (FIPS: 3132550), a place with a 2010 SF1 total population of 1.
Data Integrity
Many statistical tables from census data yield information on the interaction between people and housing (e.g., persons per household, household type, occupancy, etc.). However, differential privacy is applied separately to person-level counts and housing counts. This poses the additional challenge of data integrity across the person and housing universes. The DAS attempts to maintain integrity through various forms of post-processing, a second step of the DAS after the formal privacy protection has been applied. Faults in data integrity can be broken out into two types: impossible and improbable. For example, a place cannot have more households than household population because, by definition, a household is occupied by at least one person. Improbable results are possible but highly unlikely. For example, a place could include all population under 18 years of age if the place only contains a juvenile facility and the caretakers do not live at the facility full time. This scenario, although possible, is highly improbable, and these cases should be scrutinized.
Checks on Data Integrity
| DP Data Integrity Problems – Impossible | Place Count | Percent |
| More households than household population | 28 | 0.10% |
| Household population > 0 but households = 0 | 25 | 0.09% |
| Households > 0 but household population = 0 | 6 | 0.02% |
| DP Data Integrity Problems – Improbable | Place Count | Percent |
| All population under 18 years of age | 3 | 0.01% |
| Persons per household greater than 10 | 20 | 0.07% |
| At least 5 children under age 5 and no women age 18 through 44 | 3 | 0.01% |
| Median age significantly different (equal or greater than 20 years) between men and women | 439 | 1.50% |
| DP occupancy rate is 100% but SF1 occupancy rate is not 100% | 408 | 1.39% |
| SF1 occupancy rate is 100% but DP occupancy rate is not 100% | 48 | 0.16% |
| DP occupancy rate is 0% but SF1 occupancy rate is not 0% | 23 | 0.08% |
| SF1 occupancy rate is 0% but DP occupancy rate is not 0% | 7 | 0.02% |
| DP household population = 0 but SF1 household population > 0 | 2 | 0.01% |
| SF1 household population = 0 but DP household population > 0 | 5 | 0.02% |
When applying the same tests to the released 2010 SF1 data only one place has persons per household greater than 10 while only 99 have large (at least 20 years) differences in median age between males and females. All other counts equal zero for the above data integrity tests; no impossible occurrences are present in the SF1 data as originally published.
This is a limited analysis of a subset of the demonstration data. These differences represent the trade-off between privacy protection and accurate data. We encourage you to perform your own analysis of the demonstration data to test your use cases.
NOTE: This article is an update to an earlier blog with a new dashboard and statistics that reflect the most recent version of the Census 2010 demonstration files.


Commenting is not enabled for this article.