The United States Census Bureau is implementing a new form of privacy protection for 2020 Census data. The Disclosure Avoidance System (DAS) works by injecting noise into the actual data to prevent the re-identification of individuals. As they fine tune the DAS method, the Census Bureau is asking for your feedback (2020DAS@census.gov) on how the new system will impact your most important workflows.
Follow the steps below to create a web map comparing published 2010 data to a couple different versions of the DAS demonstration product data, all available from ArcGIS Living Atlas of the World. This example workflow shows you how to build a web map with pop-ups for American Indian Areas and the Total Population: American Indian and Alaska Native Alone field. The same steps can be followed to compare the DAS values for other fields, such as Population 18 Years and Over or Number of Housing Units. You can also use this workflow to compare DAS values for other geographies such as counties, tracts, or block groups.
Click here to see the final map produced by the workflow.
Create a new project and download the data
You’ll start by creating a new ArcGIS Pro project and downloading the demonstration data from Living Atlas.
1. Start ArcGIS Pro. Under Blank Templates, click the Map template.

2. In the Create a New Project window, for Name, type AIACompare. If necessary, choose a location for the new project (a folder on your computer).

3. Click OK.
The new ArcGIS Pro project opens.
4. If you aren’t already signed into your ArcGIS Organizational account in ArcGIS Pro, sign in by entering your account credentials at the top right corner of the project.

5. Click the Map tab and click Add Data. In the left panel of the Add Data window, click Living Atlas.
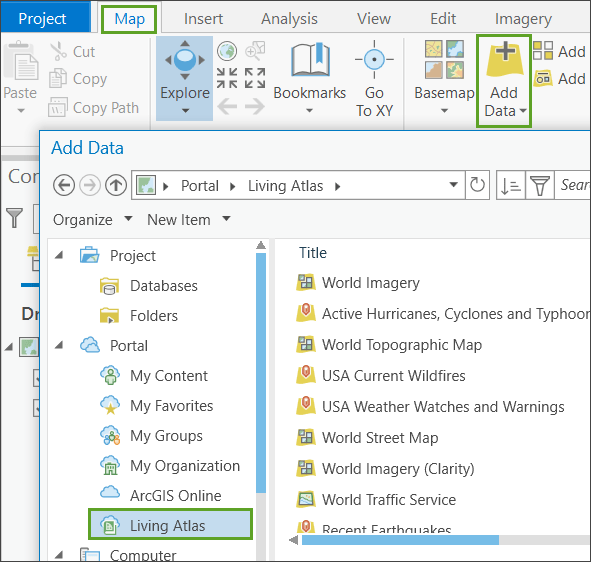
5. Search for Census Demonstration. Select the latest version of the demonstration data product and any other versions you want to compare it to. Here you’ll select v2 and v5, then click OK.
Note: there are some known issues with version 3 of the demonstration product data (see update 10/23/20 for details).
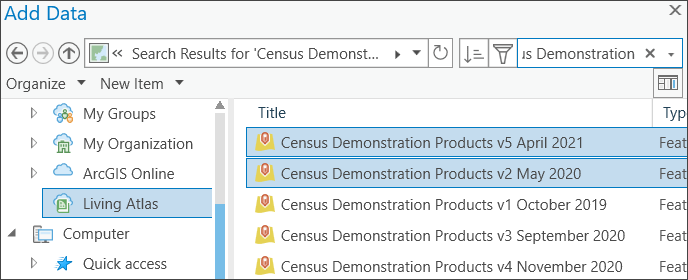
The Census Demonstration layers are added to the Contents pane. A layer for each demonstration product, with data for states, counties, subdivisions, congressional districts, tracts, block groups, and American Indian Areas, appears in the Contents pane.
Copy the geometry and the SF1 data values
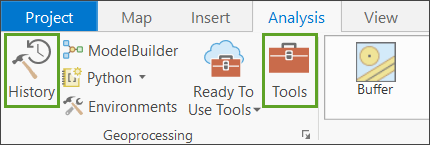
Next, you’ll create a layer with the American Indian Area geometry, identification fields, and the published 2010 data values for the American Indian and Alaska Native Alone field. You’ll start by making sure the History and Geoprocessing panes are open.
1. On the Analysis tab, click History to open the History window. Click Tools to open the Geoprocessing pane.
For demonstration purposes, you’ll analyze American Indian Areas. You’ll copy that layer next.
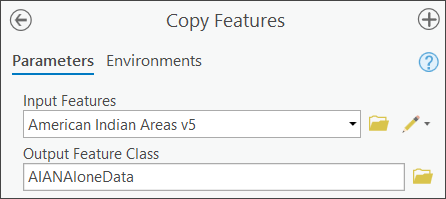
2. In the Geoprocessing pane, search for and open the Copy Features tool.

3. For the Input Features parameter, choose Census Demonstration Products v5 April 2021\American Indian Areas v5. For Output Feature Class, type AIANAloneData to create the layer inside the project file geodatabase (AIACompare.gdb, for example).
4. Click Run.
5. In the Contents pane, uncheck all layers except the AIANAloneData layer.
6. Right-click the AIANAloneData layer and choose Zoom To Layer.
Next, you’ll remove all the fields except the ones you want to include in your web map.
7. In the Geoprocessing pane, click the Back button.

8. Search for and open the Delete Field tool.

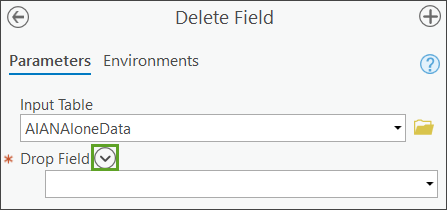
9. For the Input Table parameter, choose AIANAloneData. For the Drop Field parameter click the arrow next to the Drop Field parameter to reveal all the fields.
10. Click the Toggle All Checkboxes button to select all the fields.
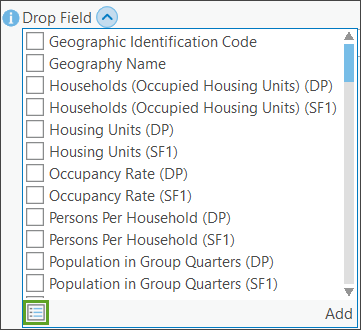
11. Uncheck the following fields, then click Add:
- Geographic Identification Code
- Geography Name
- Total Population: American Indian and Alaska Native alone (SF1)
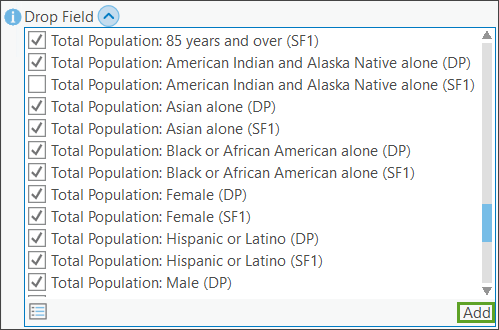
The SF1 data is the original published 2010 data values.
12. Click Run.
Update the map symbology.
13. Right-click the AIANAloneData layer and click Symbology.
14. On the Symbology pane, change Primary symbology to Single Symbol.
15. Close the Symbology pane.
Get the demonstration data values
Next, you’ll add the v2 and v5 demonstration data values for the American Indian and Alaska Native alone field to the American Indian Area geometry. For each demonstration product, the field name is identical, so after joining the field value for each demonstration product version to your AIANAloneData layer, you’ll update the field name.
1. In the Geoprocessing pane, search for and open the Join Field tool.
2. For Input Table, choose AIANAloneData. For Input Join Field, choose Geographic Identification Code.
3. For Join Table, choose Census Demonstration Products v2 May 2020\American Indian Areas v2. For Join Table Field, choose Geographic Identification Code.
4. For Transfer Field, choose Total Population: American Indian and Alaska Native alone (DP).
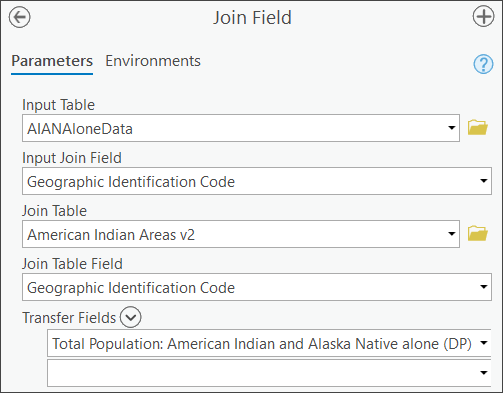
The DP field has the demonstration product values.
5. Click Run.
Next, you’ll change the field name to reflect that it is version 2 demonstration product data.
6. Search for and open the Alter Field tool.
7. For Input Table, choose AIANAloneData. For Field Name, choose Total Population: American Indian and Alaska Native alone (DP).
You’ll change the field name and field alias.
8. For New Field Name, type AIANv2DP. For New Field Alias, type Total Population: V2 American Indian and Alaska Native alone (DP).
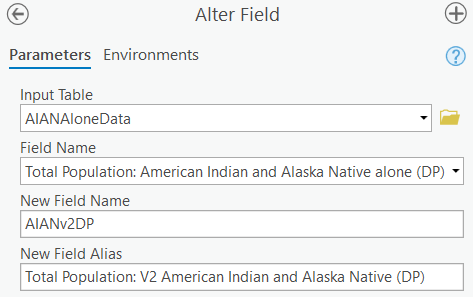
You’ve added the version 2 data. You’ll run the Join Field and Alter Field tools again to add the latest version 5 data.
9. Click the History tab and double-click Join Field.
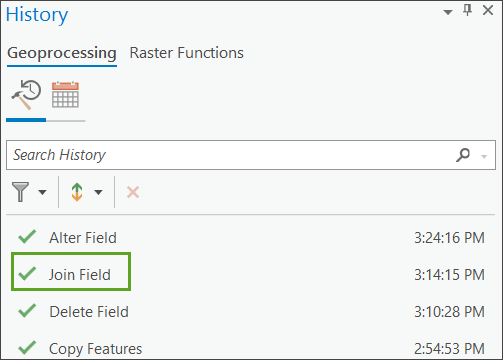
The Join Field tool opens in the Geoprocessing pane with the parameters set the way they were the last time the tool ran.
10. Change the Join Table parameter to Census Demonstration Products v5 April 2021\American Indian Areas v5 (version 5 instead of version 2). Click Run.
The field from the version 5 demonstration product is added to your AIANAloneData layer.
11. Click the History tab and double-click Alter Field.
The Alter Field tool opens with the parameters set. You’ll change the field name and field alias so they identify the data as version 5.
12. Change the New Field Name parameter to AIANv5DP. Change the New Field Alias field to Total Population: V5 American Indian and Alaska Native alone (DP). Click Run.
You won’t need the Census Demonstration layers any longer, so you’ll remove them from the Contents.
13. In the Contents pane, select the Census Demonstration Products layers. Right-click and choose Remove.
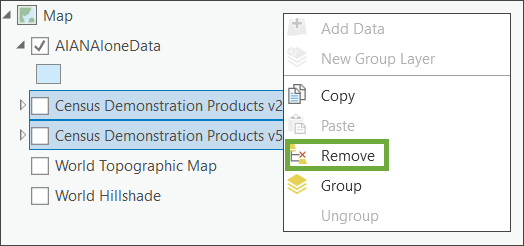
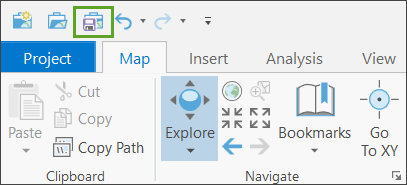
14. On the Quick Access Toolbar, click the Save button to save your project.
Calculate the difference between version 5 DP and the SF1 data values
Next, you’ll create fields showing the difference between the latest version of the demonstration product data and the published data.
1. In the Contents pane, right-click the AIANAloneData layer and choose Attribute Table. Scroll right in the table to confirm you have the id fields, the SF1 field, and the V2, and V5 DP fields.
2. Close the table.
3. In the Geoprocessing pane, find and open the Calculate Field tool.
4. For the Input Table parameter, choose AIANAloneData.
By providing a field name that doesn’t already exist, you’ll create a new field. You’ll populate the new field with the difference between the version 5 demonstration product data value and the published 2010 data value.
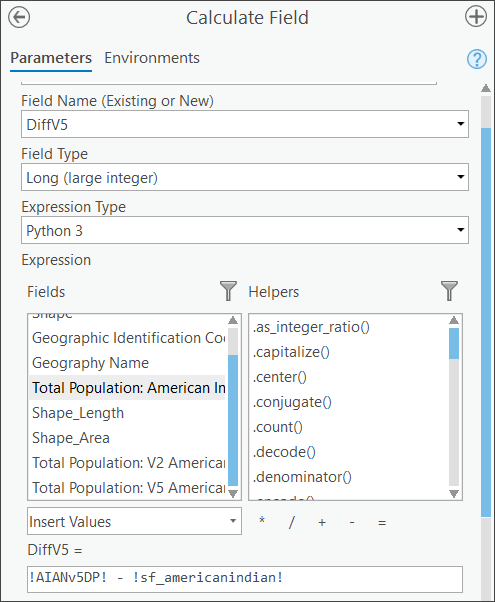
5. For Field Name, type DiffV5. Click anywhere outside of the Field Name parameter to reveal the Field Type parameter.
6. For Field Type, choose Long.
7. Set the Expression parameter to: !AIANv5DP! – !sf_americanindian!
Note: The fields are listed by alias but represented by field name in the calculation expression. The field name for Total Population: V5 American Indian and Alaska Native alone (DP) is !AIANv4DP!. The field name for Total Population: American Indian and Alaska Native alone (SF1) is !sf_americanindian!.
8. Click Run.
Next, you’ll compute the percentage differences. To avoid division by zero, you’ll initialize the new percentage field to 0.0, select the polygons with populations greater than 0, and then perform the division.
9. Search for and re-open the Calculate Field tool (this clears the parameters).
10. For Input Table, choose AIANAloneData. For Field Name, type PercentV5.
11. Click anywhere outside the Field Name parameter to expose the Field Type parameter. For Field Type, choose Float.
12. For Expression, type 0.0.
13. Click Run.
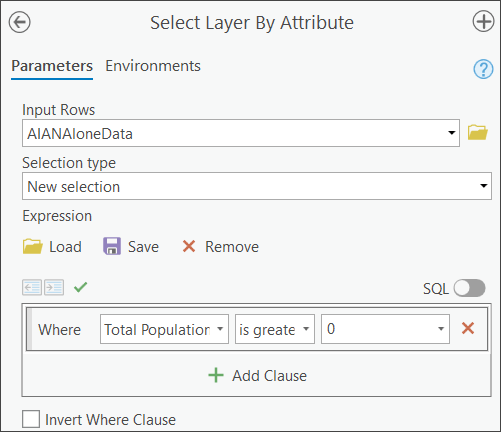
14. Search for and open the Select Layer by Attribute tool.
15. For Input Rows, choose AIANAloneData.
16. Click the New expression button and create the expression: Where Total Population: American Indian and Alaskan Native alone (SF1) is greater than 0.
17. Click Run.
The tool selects 596 features.
18. In the History pane, open the most recent Calculate Field entry (near the top of the pane). Change Expression to: (!DiffV5! / !sf_americanindian!) * 100.0
19. Click Run.
For the polygons where the population is zero, the percentage will remain 0.0. For all other polygons, the value will reflect the percentage the difference represents of the total population. (A difference of 10 for a place with 1000 people, 1.0, is not as severe as a difference of 10 for a place with 2 people, 500.0).
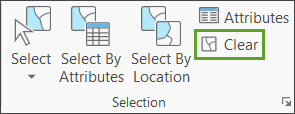
20. At the top of the project, click the Map tab. In the Selection group, click Clear.
21. Save the project.
Share the layer
Next, you’ll share the layer to your ArcGIS organizational account.
1. In the Contents pane, right-click the AIANAloneData, point to Sharing, and choose Share As Web Layer.
2. For Name, type AIANAloneData and add your name or initials. Type a Summary (see below).
3. For Tags, type American Indian Areas, Total Population: American Indian and Alaska Native alone (SF1), 2010 Census, Demonstration Product Data, DPv2, and DPv5.
4. Set the Layer Type to Feature. If you want the web layer to be shared to a particular folder in your ArcGIS Online account, specify the folder name.
5. Set the Share with parameter as appropriate. If you will be sharing your final web map with Everyone, for example, you will want to share this web layer with Everyone as well.
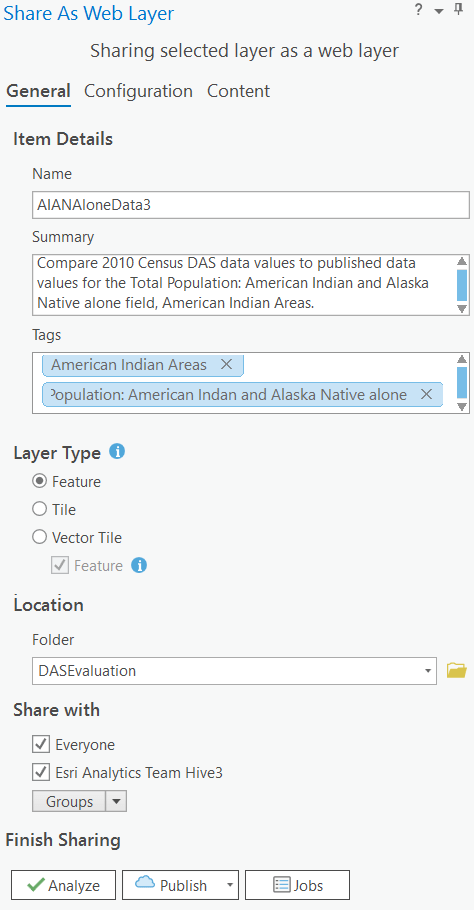
6. Click Publish.
Create a web map
You’ll open a web browser, sign into your ArcGIS organizational account, and open the web layer you just shared. Then, you’ll symbolize the percent differences (or count differences if you prefer).
1. Sign in to your ArcGIS organizational account. In Content, locate the web layer you shared.
2. Click the hosted feature layer.
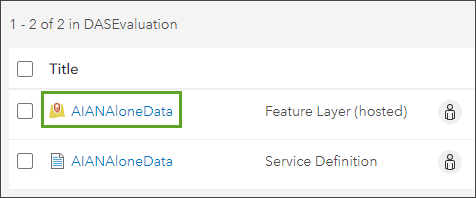
3. Click Open in Map Viewer Classic. Zoom in to see the polygons better.
4. Click Basemap and choose Light Gray Canvas so the polygons will stand out more.
5. In the Contents pane, point to the layer and click the Change Style button.

6. Choose PercentV5 for the attribute to show. Choose Counts and Amounts (Color) for the drawing style by clicking Options.
7. For Theme, choose Above and Below.
8. Slide the middle handle to 0 (or click the value next to the middle handle and type 0). Set the top handle to 100 and the bottom handle to -100.
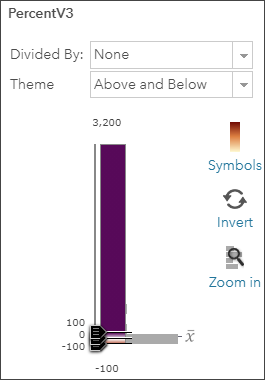
You’ll want to select a color ramp with bright colors on the top and bottom and with no transparency for the middle values.
9. Click Symbols. Select the last color ramp in the palette and click the Invert Color Ramp button. Click OK.
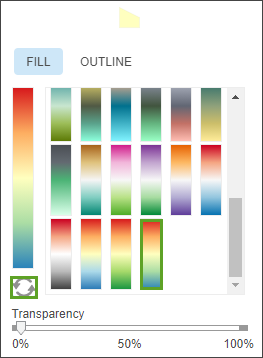
10. Click OK. Click Done.
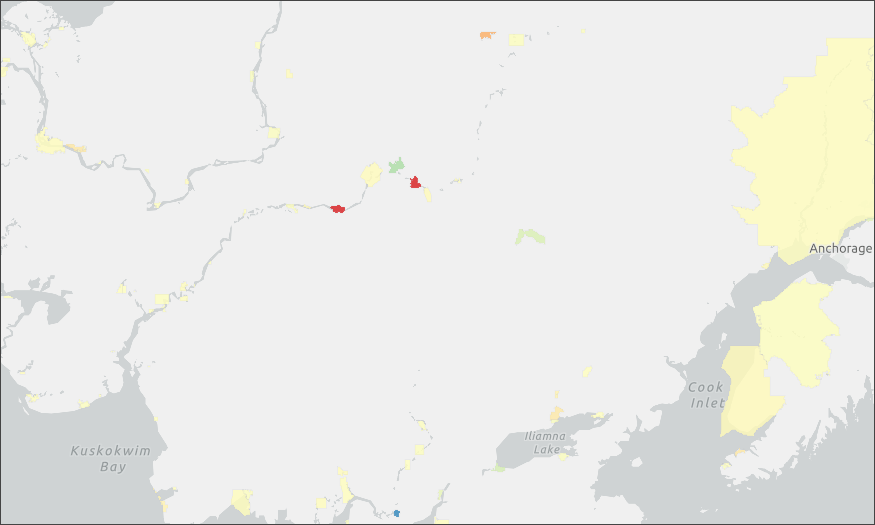
Most of the map is yellow (meaning the percentage of error is very low). If you zoom in on the state of Alaska, however, you see some low and high percentages. There are other locations with high and low percentages in other parts of the country as well.
Customize the pop-ups
As the final step, you’ll design what the pop-ups look like and will make the web map accessible to everyone.
1. Point to the AIANAloneData layer and click the More Options button (the three dots). Choose Configure Pop-up.
2. Click Configure Attributes.
3. Uncheck {OBJECTID}, {id}, {name}, {Shape_Area}, and {Shape_Length}. Check all of the other fields.
4. Click the Total Population: American Indian and Alaskan Native alone (SF1) field and change Format to 0 decimal places.
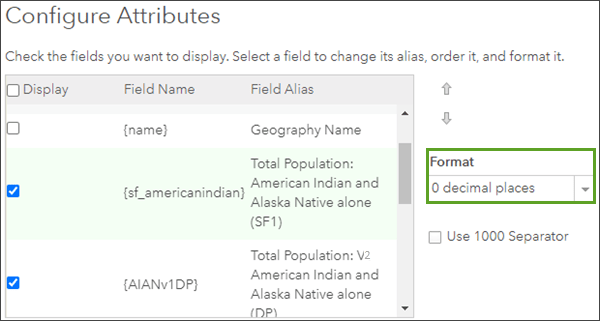
5. Set Format to 0 decimal places for the v2 and v5 demonstration product (DP) fields also.
6. Change Field Alias for the {DiffV5} field to DPv5 – SF1.
7. Change Field Alias for the {PercentV5) to Percent Error. Click OK.
8. Click OK to exit the Configure Pop-up pane.
9. Click one of the polygons on the map to see the pop-up.
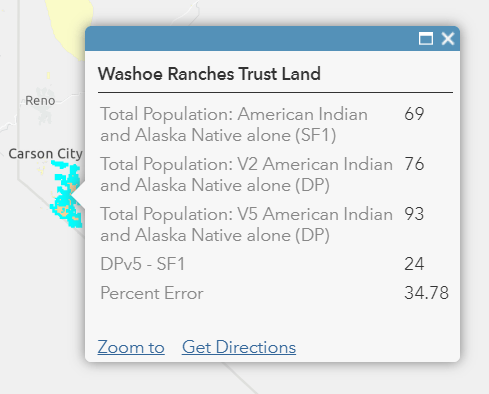
Finally, you’ll save the web map you created and share it with everyone.
10. Close the pop-up, then click the Save button and choose Save As.

11. In the Save Map pane, for Title, type American Indian Areas, American Indian and Alaskan Native Population. For Tags, type Census, Demonstration Products, Differential Privacy evaluation. For Summary, type This map compares versions of the demonstration products the Census Bureau is creating to protect privacy, against published 2010 census data. Use it to determine how the new privacy protection system will impact your most important workflows.
12. Click Save Map.
13. Click the Share button (next to the Save button). Check Everyone.
14. Click OK for the note telling you to use the URL to provide a direct link to the map. Copy the Link to this map path, then close the Share pane.
15. Just to be sure the permissions are correct, send the link you copied to someone and ask them to confirm they can view your map and pop-ups.
Next steps:
Repeat this workflow for other variables or other geometries. Use both the SF1 and the DP data in your most important workflows and evaluate the differences. Be sure to report your concerns and findings to the team at the Census Bureau working on the Disclosure Avoidance System. (2020DAS@census.gov)
This post was originally published on September 22, 2020, and has been updated.



Article Discussion: