This blog post was originally published on November 20th, 2020 and has been updated.
ArcGIS Field Maps offers a variety of tools to ensure that mobile workers have everything they need when using maps in the field. Try these five capabilities to get a glimpse into all that Field Maps has to offer:
- View your maps
- Sketch and take notes with markup
- Collect data
- Create a map area to use offline
- Share your location
For a demo of each of these five capabilities, check out the 5 things to try in Field Maps video at the end of this blog post.
1. View your maps
Field Maps allows mobile workers to take their maps anywhere, and it equips them with all the tools they need to be successful in the field. Let’s take a look at the map viewing features available in each map.
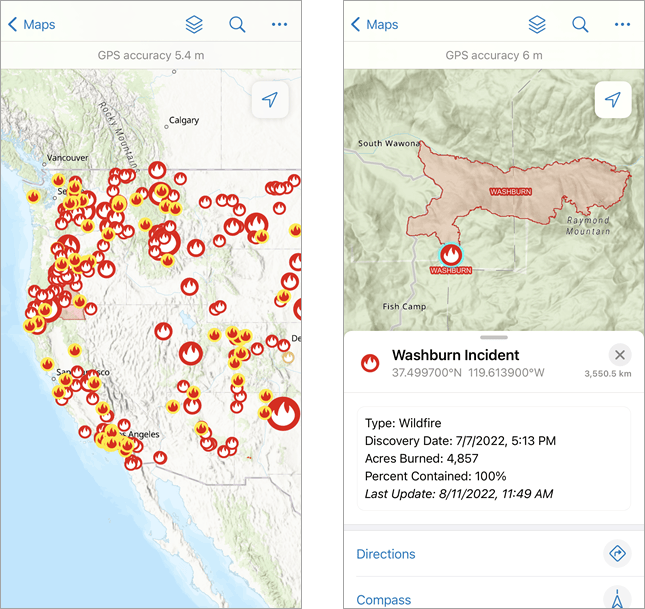
Open the Field Maps mobile app and tap Skip on the sign-in screen to view the sample maps. Tap the Wildfire and Weather Information map card. A map of the United States opens containing wildfire incidents and weather data.
Find and view features
You can tap or search for any feature on the map to view its information. Tap Search  and type Washburn to search for the Washburn Fire Incident. Tap Washburn Incident and the map pans and zooms to that feature, opening its details.
Get directions to features
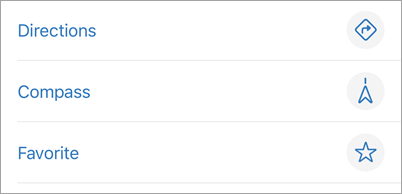
You can get directions to any feature using either the compass or a navigation app on your device. Tap any feature and the Directions and Compass tools appear.
Favorite features
Quickly zoom to a feature with favorites. With the details of the feature open, you have the option to save it by tapping Favorites. The feature now appears in the Favorites section when you search your map, allowing you to quickly pan and zoom to it.
View the Legend and Layers
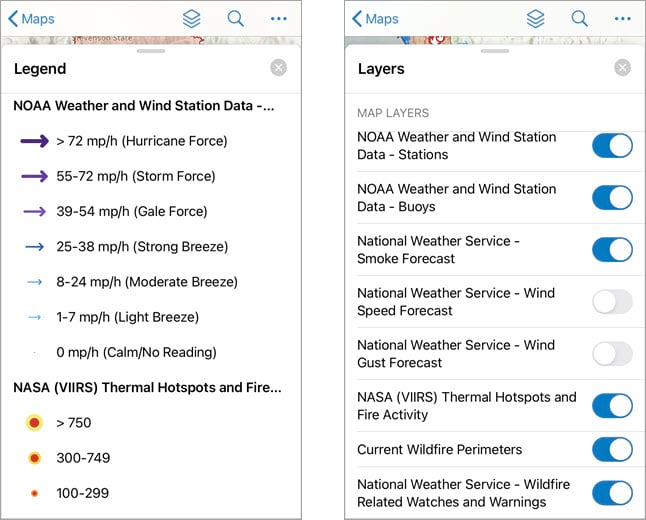
Understand the symbols in your map by viewing the legend. Tap the Overflow  menu and then tap Legend. The map’s legend appears, helping you understand key information such as wind speed and thermal hotspot data.
Control which layers you see on the map by tapping Layers  . The Layers menu allows you to show and hide layers on the map. In this example, the National Weather Service – Smoke Forecast layer is turned off by default. Turn this layer on to get a view of the day’s smoke forecast, and then turn it off when you need to view other data that it may obscure.
Change the basemap
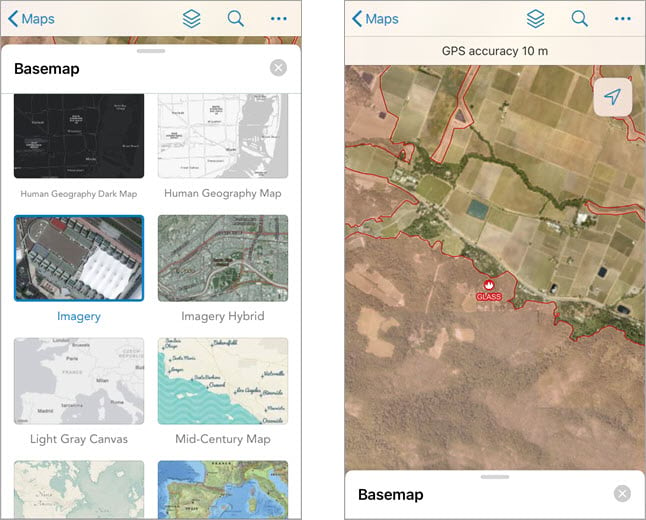
You can change the basemap to view your assets in a different context. Change the basemap by tapping the Overflow  menu and then tapping Basemap. A list of basemaps appears. Tap Imagery to see if any buildings are within fire perimeters.
Measure distance and area
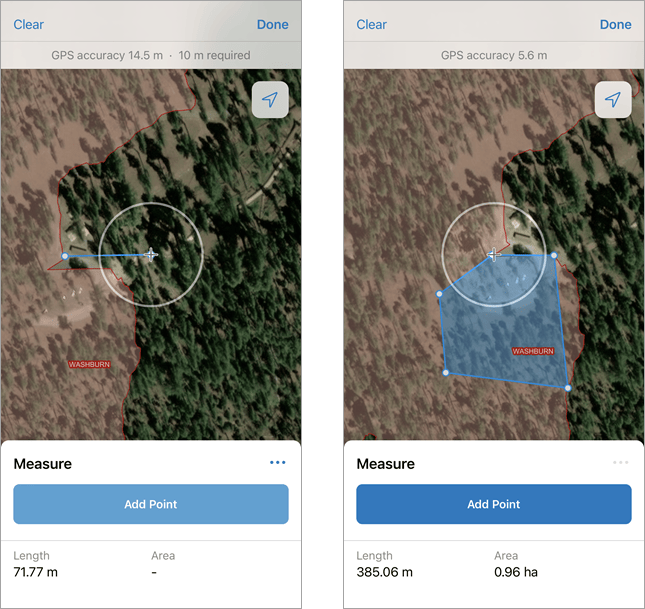
You might need to take measurements on the fly while working in the field. Measure distances and areas on any map with the Measure tool. Tap the Overflow  menu and then tap Measure. Try measuring the distance between two points and measuring an area on the map. The measurement appears, and you can configure the units based on what’s needed for your workflow.
2. Sketch and take notes with markup
Use markup to capture sketches and notes on any map. Markup is saved as a layer on your device, so updates made to the map won’t affect it. You can use markup for your own information, like drawing on a paper map—or you can share it to communicate with others.
Open the Wildfire and Weather Information sample map if you haven’t already. Tap the Overflow  menu, and then tap Markup to start annotating your map.
Add markers and arrows
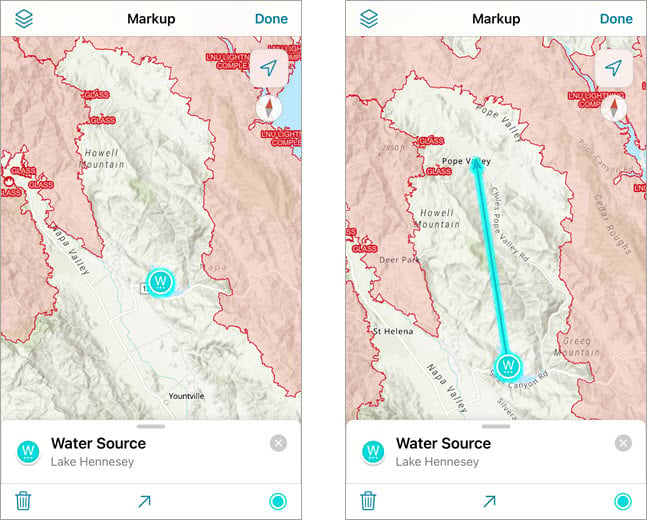
Long press on the map to add a marker. Markers can be used to indicate points of interest on a map. You can add both a label and notes to a marker. Tap the Arrow button to add an arrow to your marker. The direction of the arrow can be adjusted and it stays attached to your marker.
Draw lines and shapes
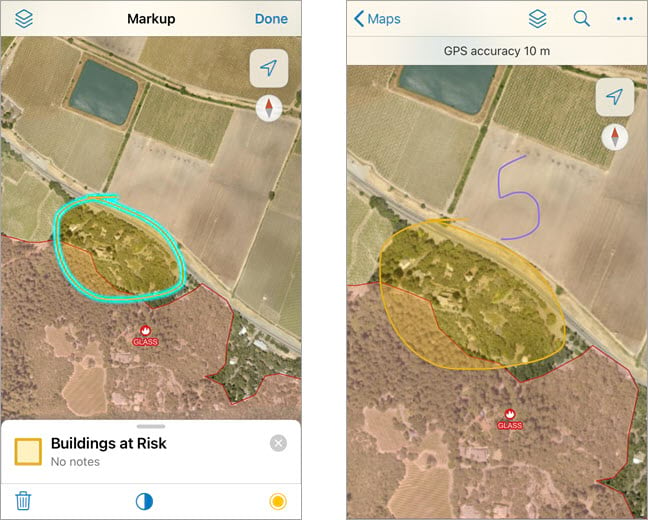
Quickly capture notes on any map by drawing lines or shapes on the map. You can add both a label and notes to any drawing or shape you create. Additionally, you can change the color of the drawing and fill shapes with transparent color.
Save and share
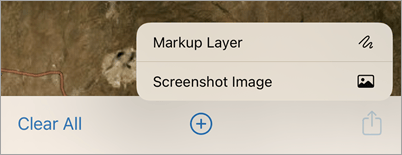
While in edit mode, tap Share  to share your markup. When you are done marking up your map, tap Done. Your markup is stored in a layer that you can turn on and off from the Layers menu. For more information, see Use markup.
3. Collect data
To collect data in a map enabled for editing, you will need to sign in using an ArcGIS account. Open any map enabled for editing and collect new assets or update existing data. For information on how to create and deploy a map enabled for editing, see Create a map and Share your map for use in Field Maps.
Tap Add  on the map to begin the data collection process. The water inspection map shown below has preconfigured feature templates that list the different kinds of assets that can be collected.
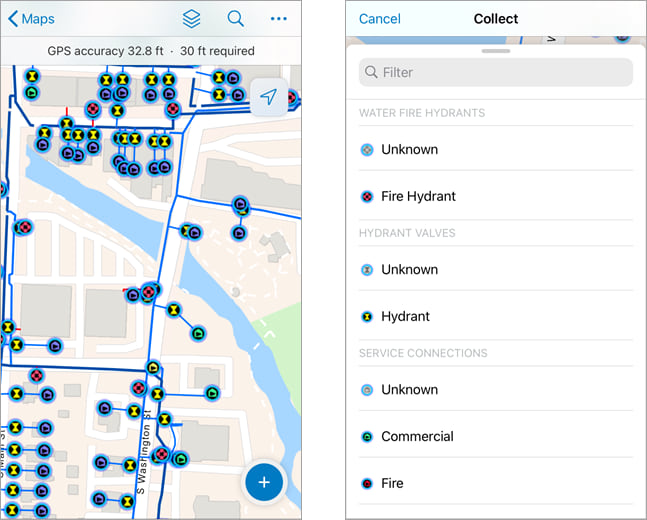
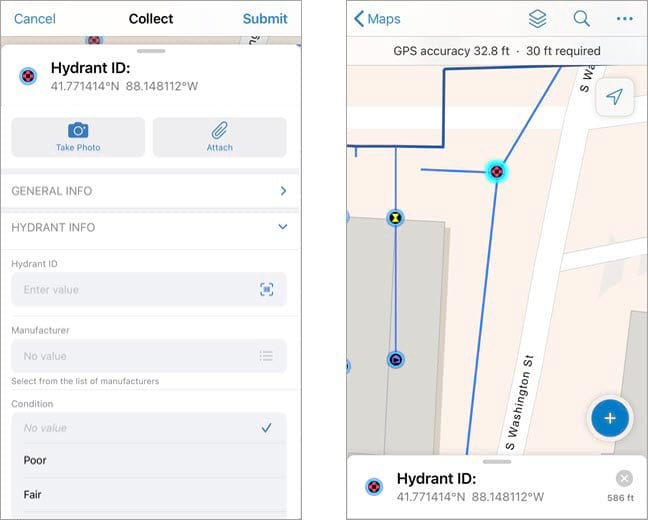
In the water inspection map, tapping Fire Hydrant opens a form that mobile workers fill out before adding the new asset to the map. The form is configured ahead of time to make sure the information needed for each feature is collected. For more information, see Configure the form and Fill out forms.
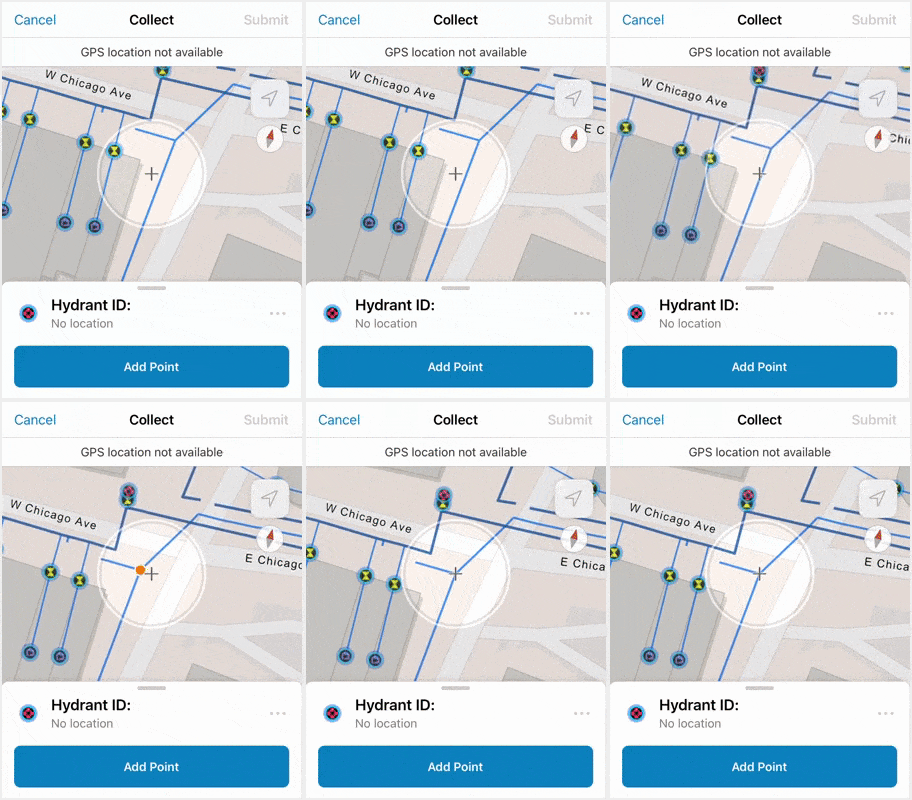
Before submitting updates, make sure the location target is hovering over the area where you want to add the data point. If snapping is enabled, the location target will automatically snap to existing point features or vertices of lines and polygons. This ensures precision in the data collection experience.
Once mobile workers have filled out the form, they can tap Submit and the new point is added to the map. The new point is updated in Field Maps as well as in other maps and apps containing the feature layer.
In addition to collecting single data points, you can capture a stream of data while moving, use GPS averaging, update data at existing points, and more. For more information on how to collect data in the Field Maps mobile app, see Capture and Inspect.
4. Create a map area to use offline
You can’t always plan where you’ll be working for the day. If you realize you’ll be working in an area with an unreliable internet connection, you can create a map area that allows you to view assets and collect data while working offline.
Map areas package the data, basemap, and any attachments within a defined extent of the map. This package then downloads to your device, allowing you to view assets and collect data while offline. Map areas can be defined ahead of time, but they can also be defined in the Field Maps mobile app.
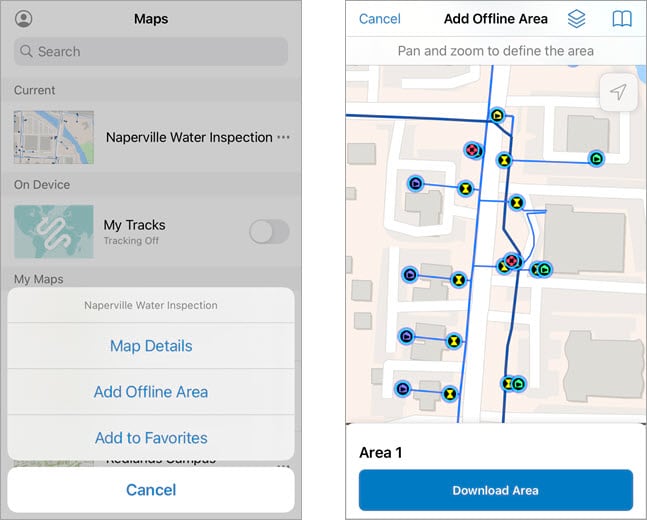
If a map is enabled for offline use, you can create a map area by tapping the Overflow  menu on the map card and then clicking Add Offline Area. Define the extent, then tap download.
5. Share your location
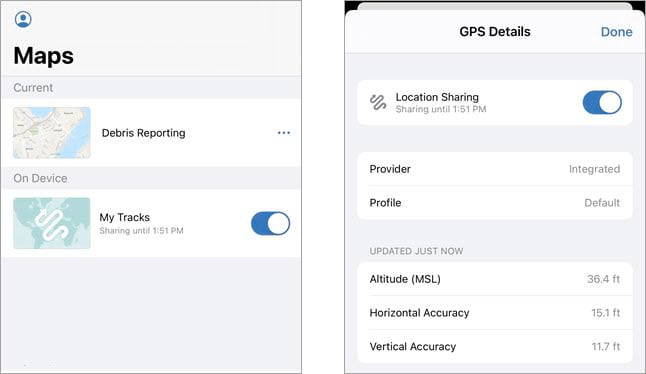
Location sharing allows you to know where mobile workers are and where they’ve been. It also allows mobile workers to view their tracks on the maps they work with.
If location sharing is enabled for your organization and you have an ArcGIS Location Sharing user type extension, the My Tracks map card appears in the Maps list. Tap the toggle button on the map card to turn location sharing on and off. You can also turn location sharing on and off by tapping the GPS banner on any map.
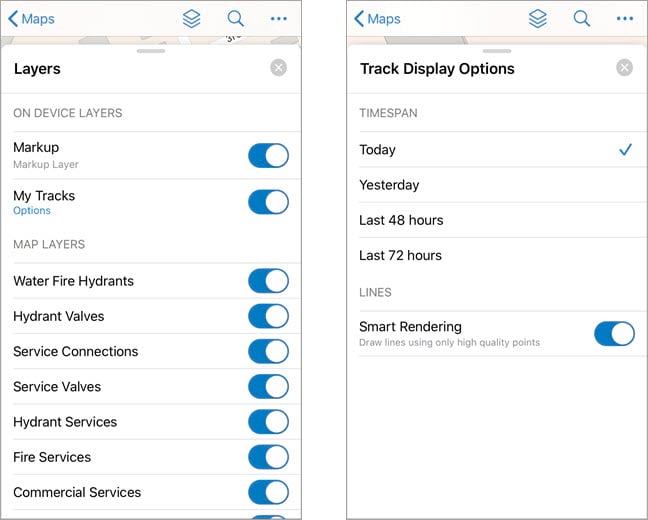
The My tracks layer is included in every map on your device and can be turned on and off from the Layers menu. Tap Options to filter the time frame of tracks to display on each map. This is helpful for evaluating where you’ve been in the context of the other information on your map.

Video
For a demo of each of the capabilities listed above, watch the following video:
Additional information
This article covered a short list of the many features included in Field Maps. Check out the following resources to see all this app has to offer:
- Resources page—Check out the latest and greatest resources for Field Maps such as Discovery Paths, blog articles, and help documentation.
- Esri Video playlist—Watch the latest Field Maps videos from this curated playlist.
- Field Maps Community—Join the conversation and ask question on the Field Maps Community page.


Article Discussion: