By Rajinder Nagi, Esri Cartographic Product Engineer
We recently got a question on Ask a Cartographer in which Julie asked if you can create a grayscale basemap from any of the colored basemaps that you add from ArcGIS Online. One solution is to use the approach Ismael described in his blog entry Crafting Your Own Basemap Styles with Flex or Silverlight. His approach involves the use of matrices to transform RGB colors, scale RGB colors, and control hue, saturation and contrast. This approach is useful if you want to change the way the basemap is rendered when using Flex or Silverlight to serve a Web map. In this blog entry, we describe how you can “transform” a colored basemap to a grayscale one directly in ArcMap.
The steps involved include:
- creating an ArcGIS server connection to the ArcGIS online basemaps,
- creating a mosaic dataset,
- adding the Basemap Map Service to the Mosaic Dataset,
- applying the Grayscale Function to the Basemap Map Service, and
- optionally, setting the map scales to ArcGIS Online / Bing Maps / Google Maps.
Creating an ArcGIS Server Connection to the Online Basemaps
To start, you need to connect to the ArcGIS server that has the ArcGIS online basemaps.
- Start ArcMap.
- Open ArcCatalog.
- Expand the GIS Servers folder and double-click Add ArcGIS Server.
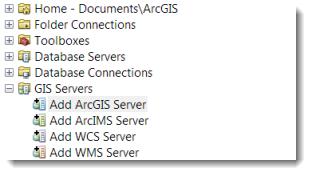
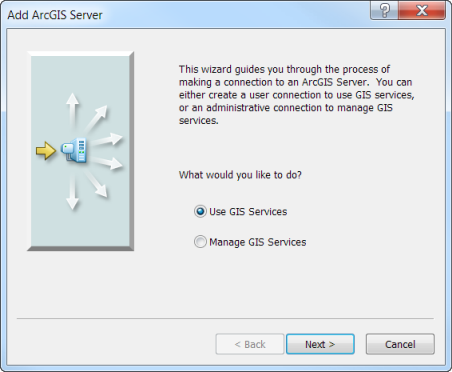
- On the first page of the Add ArcGIS Server dialog, opt to “Use GIS Services”.
- On the second page, use an Internet server connection to this Server URL: http://services.arcgisonline.com/arcgis/services.
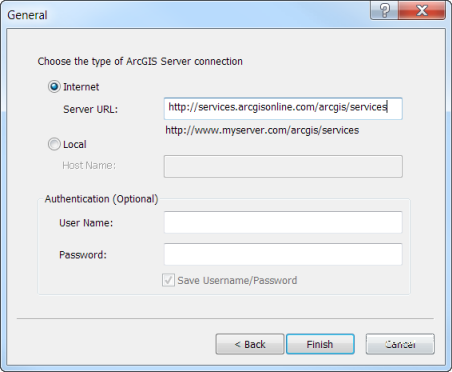
- Click Finish.
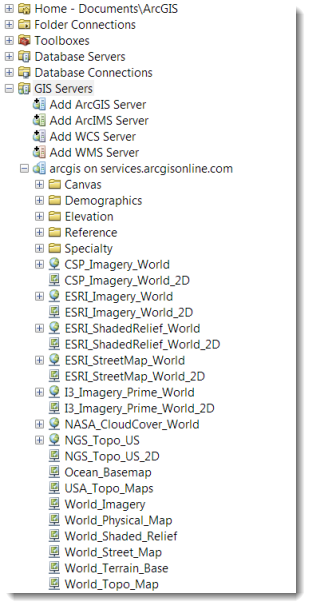
- Check that there is a now a connection to “arcgis on services.arcgisonline.com”.
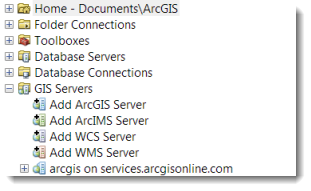
- Expand the folder for the added server – you will see number of basemaps as map services:
Creating a Mosaic Dataset
The next step is to create a mosaic dataset in a new file geodatabase.
- In ArcCatalog, create a directory for the location of the new file geodatabase by right clicking the folder for the new FGDB and selecting New > File Geodatabase.
- Rename the FGDB “GrayscaleBasemap”.
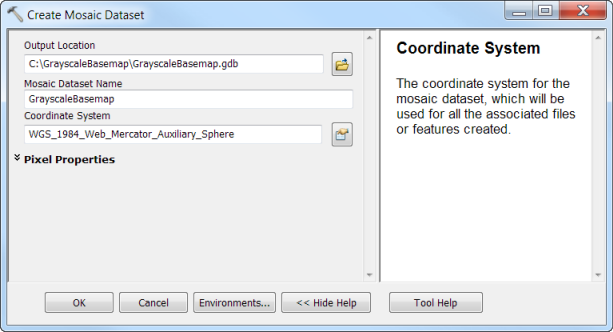
- Right click the GrayscaleBasemap FGDB and click New > Mosaic Dataset.
- Name the mosaic dataset GrayscaleBasemap.
- Set the projection by clicking the Spatial Reference Properties button
 > Select > Projected Coordinate Systems > World > WGS 1984 Web Mercator (Auxiliary Sphere).prj.
Adding the Basemap Map Service to the Mosaic Dataset
Now you need to add the basemap that you want to show with a grayscale to the mosaic dataset you created.
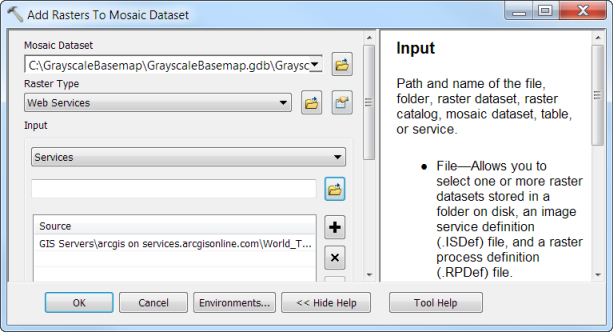
- Right click the mosaic dataset and click Add Rasters.
- In the Add Rasters to Mosaic Dataset tool, set the Raster Type to Web Services.
- For Input, click the Browse button.
- In the Input dialog, click the down arrow for “Look in:”, scroll to the bottom, click GIS Servers and double click “arcgis on services.arcgisonline.com”.
- Select the basemap you want to work with. In this example, we selected the World_Topo_Map map service.
- Click OK.
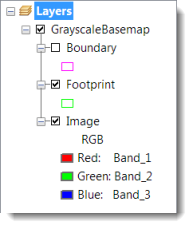
- Check that the map service for the basemap you selected is added to the mosaic dataset, and that it is added to the table of contents as a three band raster in a composite layer.
Applying the Grayscale Function to the Basemap Map Service
Now that you have the basemap in a mosaic dataset, you can use the Grayscale function to render it in gray tones.
- In ArcCatalog, right click the GrayscaleBasemap mosaic dataset and click Properties.
- On the Functions tab of the Mosaic Dataset Properties dialog, under Function Chain > GrayscaleBasemap, right click Mosaic Function and click Insert > Grayscale Function.
- In the Raster Function Properties dialog, the set weight for each band to 0.33.
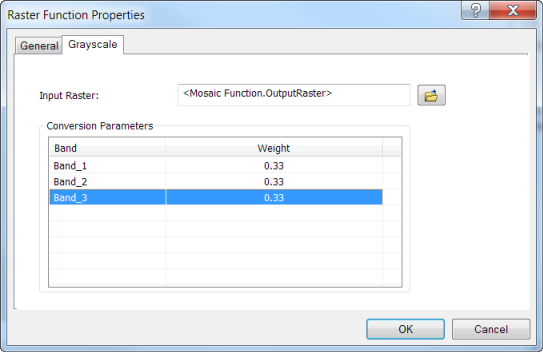
- Click OK to accept all changes.
- To turn off the green outline in the basemap image, uncheck viewing for the Footprint in the table of contents.
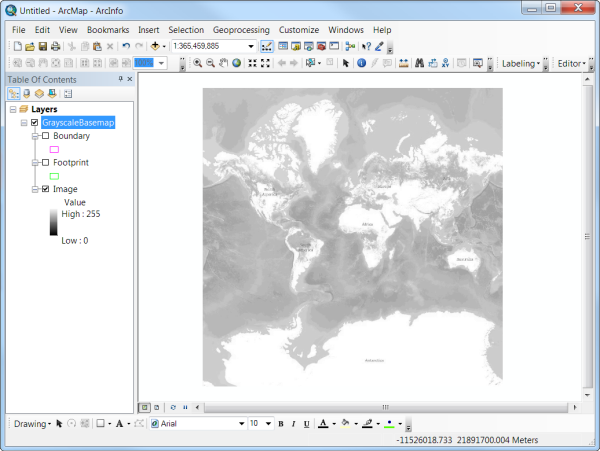
The basemap will now be displayed with a grayscale.
Examples
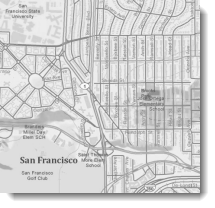
Here is an example of a portion of the World Topo Map when rendered with the grayscale function in ArcMap.
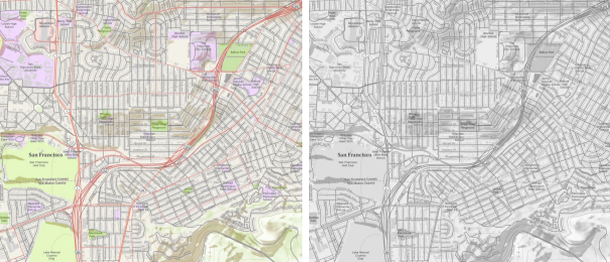
World Topo Map World Topo Map (converted to grayscale)
Here are some examples in which thematic content (point and line), when overlaid on the grayscale basemap, is visibly brought to the foreground.
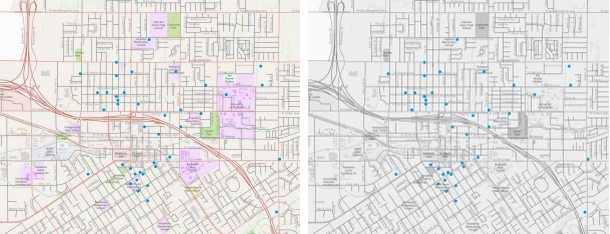
Point data representing churches in Redlands, California overlaid on the World Topo Map (left) and on the grayscale version of the basemap (right).
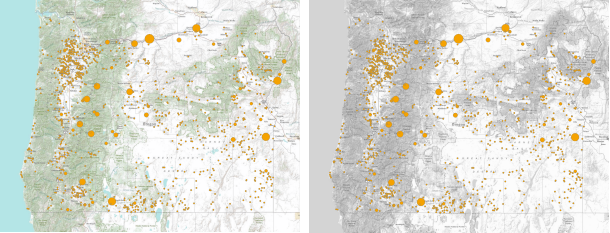
Point data representing dam storage capacity in Oregon overlaid on the World Topo Map (left) and on the grayscale version of the basemap (right).
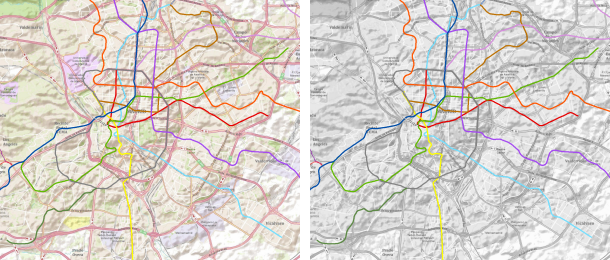
Line data representing the metro transit system in Madrid, Spain overlaid on the World Topo Map (left) and on the grayscale version of the basemap (right).
OPTIONAL: Setting the Map Scales to ArcGIS Online / Bing Maps / Google Maps
You will want to make sure to use the map scales for ArcGIS Online / Bing Maps / Google Maps when zooming in and out in ArcMap, otherwise the wrong cache tiles may be fetched and the view will be wrong for the map scale you zoom to.
- On the Standard toolbar, click the down arrow next to the map scale.

- Click Customize This List.
- On the Scale Settings dialog, click the Load button.
- Select the ArcGIS Online / Bing Maps / Google Maps map scales.
- Click OK.
You may want to use the Light Gray Canvas Basemap color styles when designing operational overlays for your grayscale basemap. The Mapping Center Canvas Map Color Styles blog entry explains how to use these styles when designing your maps.
Thanks to Aileen Buckley, Mapping Center Lead, for her help with this blog entry.

Article Discussion: