Recently I was reading Aileen Buckley’s blog on the release of the USGS Historical Topographic Map Collection. The Historical Topo Map Explorer App allows you to dive deep into the collection of over 181,000 historical maps!
While it’s fun to explore with the app, it’s also a tool to bring maps of interest into your space. Where would you want to compare to where you are now? Somewhere you’ve wanted to visit, or somewhere you once lived, or where you grew up?
This beta blog by John Nelson, Calvin Manning, & Ken Baloun walks you through some mini GIF tutorials of what you can do in the Historical Topo Map Explorer – from downloading GeoTIFFs to work with in ArcGIS Pro, or opening the maps you’re exploring in ArcGIS Online.
For my exploration, I decided to work in the cloud in ArcGIS Online, and I focused on where I grew up in Metro Detroit, Michigan. My family has expanded around the area since I was a child; my father was born in Detroit and now lives further south in Grosse Ile, Michigan.
Then
By stitching two vintage Topo maps together, I exported my areas of interest into a single web map.
Once I had the web map open with my historic maps, I went to ArcGIS Living Atlas to look for interesting data to compare over two time periods with the swipe tool. Besides maps and apps, the Living Atlas has tens of thousands of data layers that can be added to your own custom maps.
I added the National Register of Historic Places points layer to my web map. The dataset includes places that are noteworthy for their history, architecture, or engineering from the National Park Service. The feature service is checked weekly for updates, so I know that by adding this layer I will always have the most current data in my map.
Now
To compare facilities, I looked for a local Metro Detroit data source. SEMCOG, or Southeast Michigan Council of Governments, maintains an Open Data Portal for the region.
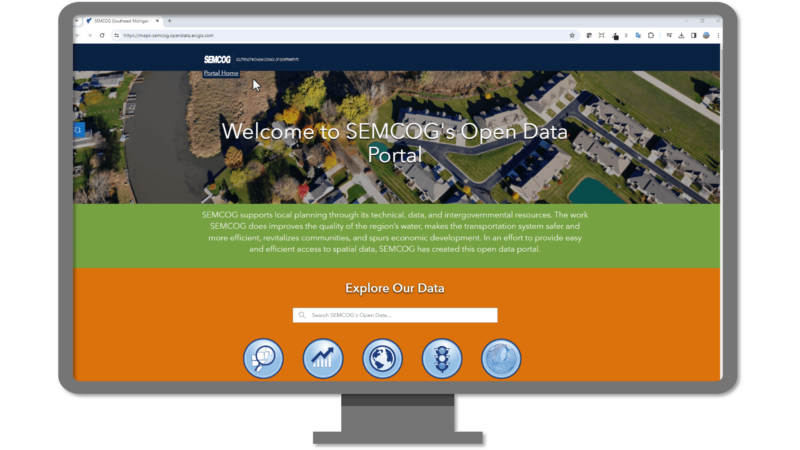
Doing a little exploring into their shared data, I found 2020 Building Footprints to add to my map. By looking at local, authoritative sources, I was able to find a much more detailed dataset with a building inventory of the region, including “Year built” and “Demolished” dates and information.
I spent a few minutes cleaning up my popups. I added a few style effects to my features, including a drop shadow on the building footprints that really gives that feeling of depth in the shadows of the buildings. What a cartographic difference!

Before moving on to make my swipe map, I wanted to have two different versions of the building footprints – one version for 1905 and one version for today. I applied filters to show only buildings that existed in 1905 and that were not demolished, and another filter on the 2020 building footprints to show what hasn’t been demolished in the dataset.
Configuring the Swipe Map
With the web map prepared, I was ready to configure an instant swipe map app. A “Swipe map” allows you to swipe the map window in view, switching the map between different data, allowing you to compare different variables in the same location.
By typing “Swipe” in the Instant App search bar, it filters the options to choose from for this capability.

The options allow a Preview of the app template to see what it could look like without actually building the app. I chose Media Map for my app template. The swipe option is available in full-access mode, which requires turning off Express Mode.

The left-hand “Interactivity” menu contains a “Modify” section that allows you to configure tools to modify the map.
Scrolling down brings up the “Swipe tool” toggle, and switching it on reveals the layer options.
The goal was to show “Then” on the left, or “Leading layers”, and “Now” on the right, or “Trailing Layers”. I turned on 1905 Building Footprints and the USGS Topo maps for the Leading layers, and kept the Historic Places data layer on too. The trailing layers display the current data, including 2020 Building Footprints and Historic Places.
From here, there are options to style the heading, the title, and other app components that are customizable.
Take a look at my final Then & Now Swipe Map | Metro Detroit to explore a little bit of Detroit history and compare it to the map of the city as it stands today.

Now I want to try this with other cities I’ve lived in, comparing other historical map vintages. There are so many options to choose from, and so much data in the Living Atlas to be discovered and layered together – the possibilities are limitless.

Commenting is not enabled for this article.