UPDATE: View a live sample of the application and and learn how to build your own c-through by forking the code on GitHub.
Urban planning is a challenging task, especially for extensive infrastructure and building projects in mixed-use areas where different stakeholders, needs and interests collide. In order to resolve such tasks, urban planners all around the world are establishing the third dimension in planning processes for visualizations and data analysis. Collecting 3D datasets has become a common task for cities but sometimes the data is not presented or available in a way that urban planners can actually use it for decision making.
By prototyping c-through – an interactive 3D web application based on the ArcGIS JavaScript API – we are aiming to support decision making in urban planning by providing tools that help explore and analyze the implications of usage distribution on a unit scale – that is e.g., on the level of apartments, stores or offices, commonly referred to as “spaces”. The web application developed in the scope of a 3-month summer internship was implemented for three locations on different scopes: Zurich, Vancouver and Dubai. The following description will focus on the Zurich use case.
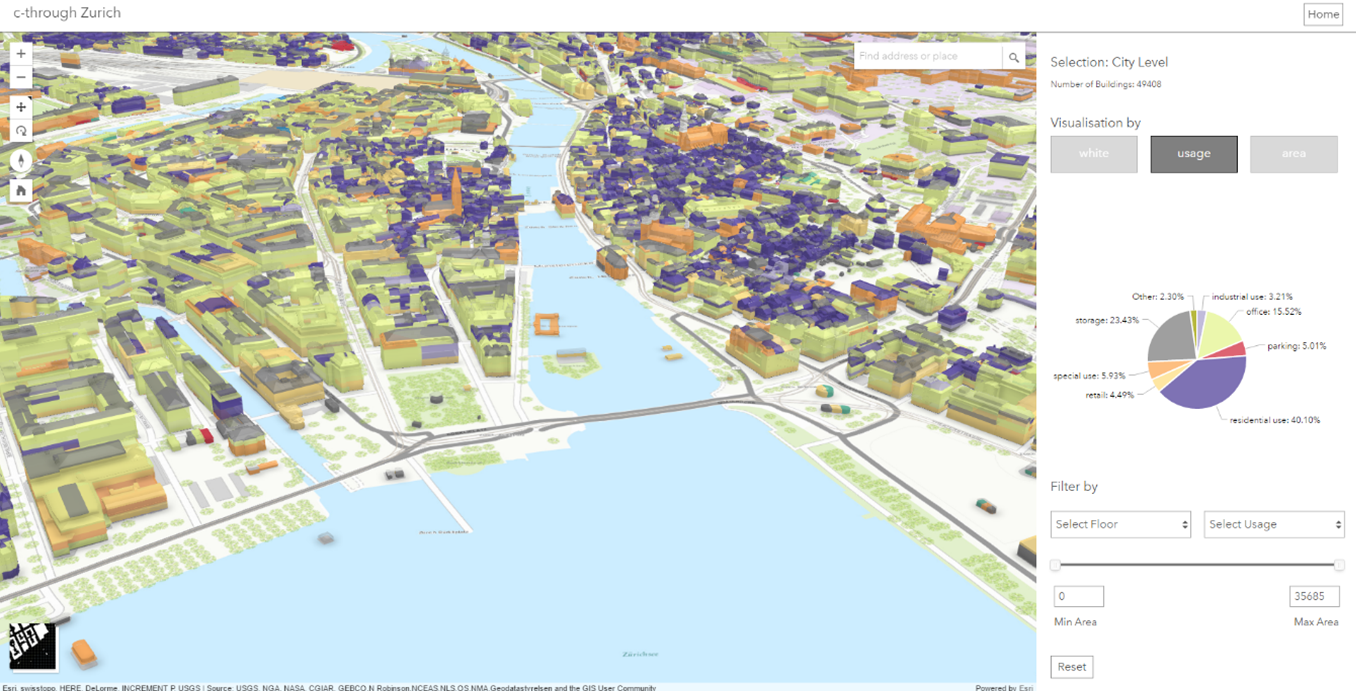
Figure 1. Screenshot of the C-Through application showcasing Zurich
The city of Zurich is making a huge effort to collect extensive datasets related to 3D for almost every building in the city, such as detailed usage data per floor and unit. However, this dataset has so far only been used in 2D applications (e.g. click on building and display a table with corresponding usage types by floor). Combining the usage dataset with 3D buildings of Zurich in a high level of detail, made it possible to display the usage distribution in a 3D application built with the ArcGIS JS API. The data processing involved using both the strengths of CityEngine and ArcGIS Pro and is described in the next section.
This hybrid dataset of 3D buildings and usage is of particular interest for urban planning because it allows urban planners to investigate mixed-use areas on a local scale. In general, urban areas succeed in providing a high standard of living when they manage to combine different types of usages so that human interaction can evolve in a bustling environment. Although these mixed-use areas are characteristic elements of every city, they have a tendency to become fragile as a result of a profit-oriented real estate market that for example prefers residential over commercial use. A development that can be also monitored in Zurich is the increasing disappearance of small shops in pedestrian areas that are owned by local merchants and consequently bought out by international chain stores that pay higher rents and fill up huge spaces.
As a result, the diversity of usages constantly drops and small “mom-and-pop-stores” will eventually vanish completely out of our cityscapes – but only if those trends are not monitored and identified in detail by governmental urban planners. What is needed are tools that allow you to explore the distribution of usages and to locate self-interested developments in order to protect mixed-use areas.
Data Processing
A common challenge when building 3D applications is the availability of good data. Datasets that provide clean, structured and meaningful 3D data are still comparably rare, but they do exist or can be processed. For the generation of the final usage dataset for the city of Zurich, multiple steps between CityEngine and ArcGIS Pro were needed.
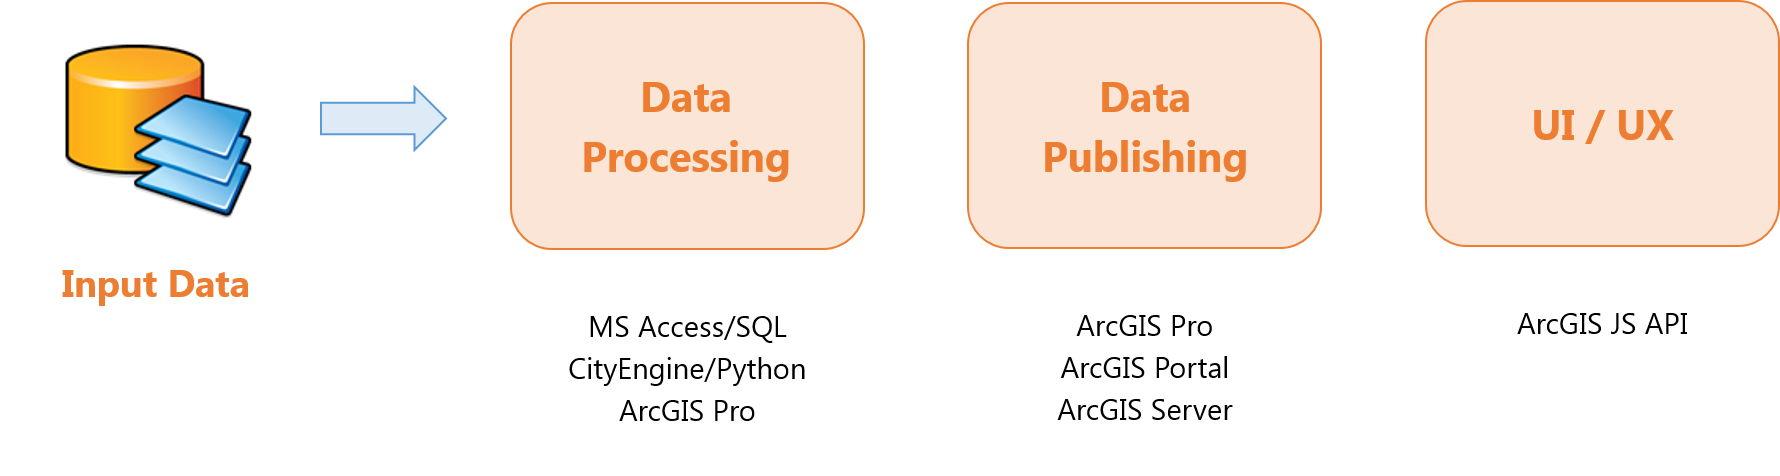
Figure 2. Workflow including ArcGIS Pro, ArcGIS Portal/Server and ArcGIS JS API
The input data was made available by the city of Zurich as a table with a row for each unit in the city with the corresponding usage and area. Additionally, each unit in the table has a unique identifier for the building that it belongs to as well as the floor within the building where it is located. As a preprocessing step, the table was modified with the aid of SQL in order to have the following information separately:
- floors: a table with building ids (identifier) and corresponding number of upper and lower (below ground) floors
- splits: a table with floor ids (identifier) for each building and corresponding number of splits into units
- units: the original table with unit ids (identifier) and corresponding usage and area
What follows is a duet between ArcGIS Pro and CityEngine (CE).
Pro: The 3D buildings of the city of Zurich were loaded to ArcGIS Pro first, where the table floors were joined over the unique building id.
CE: The buildings were then imported into CityEngine. They were split horizontally according to the number of upper floors and the ground floors were extruded according to the number of lower floors. The dataset was then exported as a File Geodatabase out of CityEngine with option “One Feature Per Leaf Shape” turned on.
Pro: The floors are joined with the splits table.
CE: The floors were then vertically split according to their corresponding number of splits. It has to be said here that the floors were equally split even though technically a split by area would be possible. The problem was, that CityEngine does not yet support reading multi-valued fields which would have had been needed in this case (e.g. a split attribute with multiple area values).
Pro: These produced units were then joined with the original dataset that includes usage and area per unit.
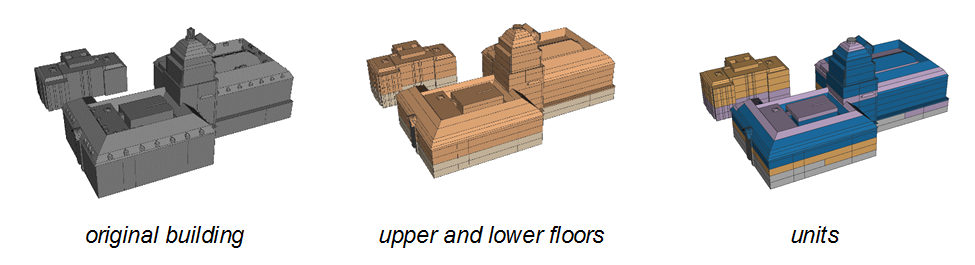
Figure 3. Process of splitting up buildings in units
With this method, over 85% of the units were assigned properly to their corresponding usage. Due to the quality of the dataset as well as inevitable processing inaccuracies, a higher percentage was not possible.
The floor split has also been tested in ArcGIS Pro as suggested by Geoff Taylor. Because of the complexity of the 3D buildings, the Split floors tool from the Facility toolbox in ArcGIS Pro did not provide the desired results immediately. Therefore, all the splits were made in CityEngine.
The final dataset was published on ArcGIS Portal from where it was accessed by the ArcGIS JavaScript API to display it as a Scene Layer in the web scene.
Application Logic
The app consists of three main tools:
- highlight tool: select one or multiple buildings by clicking
- visualization tool: change the renderer of the layer based on a property and display statistics and charts with values of the selection
- filter tool: filter the layer by floor, usage type and area and only show filtered features
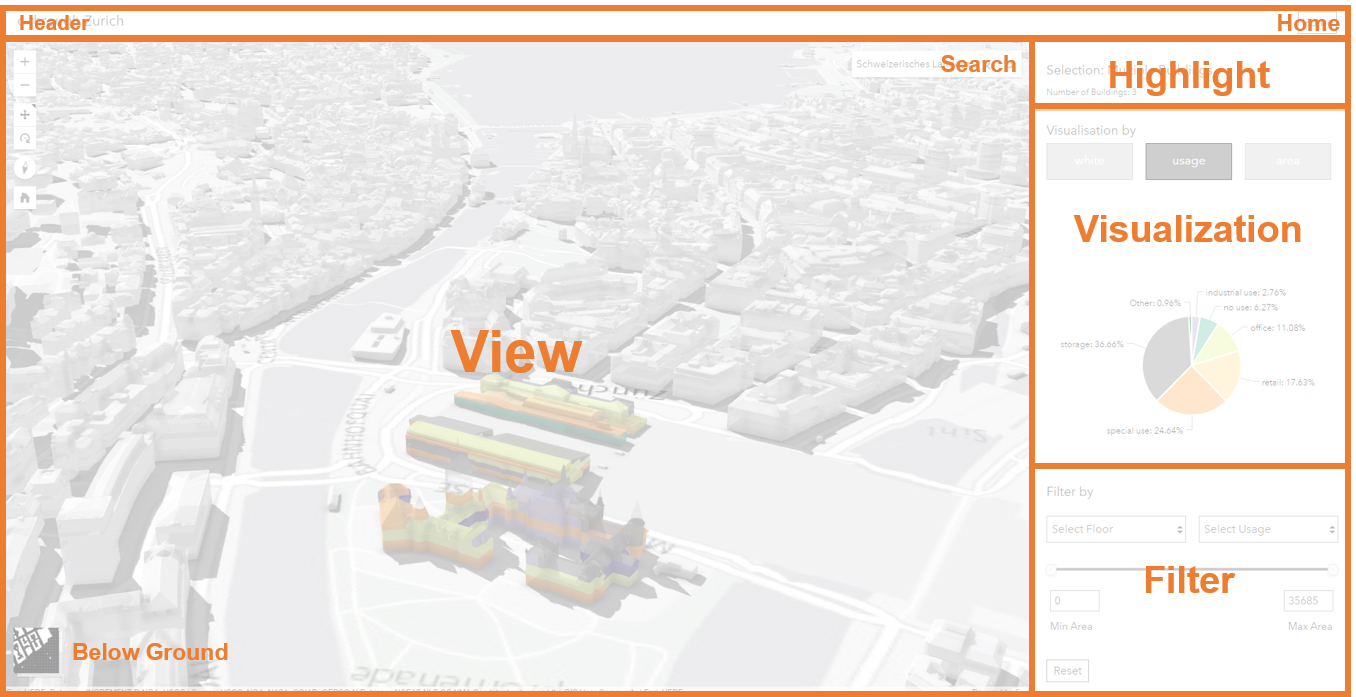
Figure 4. Overview of the application’s user interface
The highlight tool basically shows the highlight mode for the buildings (city, buildings or multiple buildings) and also the number of buildings that are currently selected. The features can be selected by clicking. Multi-selection is enabled when the SHIFT-key is pressed while a building is clicked.
The visualization tool gives the option to change the attribute that is used by the renderer. In the default mode (none) a renderer is only applied if the highlight mode goes into building or multiple buildings: the selected buildings appear in blue. The usage mode shows the different types of usages and was implemented with a unique value renderer. The area mode renderers the features accordingly to the unit area and was achieved by visual variables.
The two later visualization modes also include charts that are built with amCharts. The usage mode shows a pie chart with percentages of usage (calculated by area). The area mode comes with a bar charts that is set up as a histogram where the number of features that fall in-to a certain range are counted. Both charts can be interactively used: by clicking on either a part of the pie chart or a graph in the bar chart, the renderer changes and only the selected range or usage type is shown (all others all greyed out).
The filter tool changes the appearance of the view based on what has been selected as the filter. The tool gives the option to change the floor, the usage and the area range of the selection. The three different filters can also be combined (e.g. show ground floor office units between 50 and 100 m²).
Implementation
The visualization of the selected buildings is possible because there are two identical layers in the scene: an active layer and a background layer. The active layer is always the current selection and receives visualization (change of renderers) and filter (definition expression) updates. The background layer is always filtered to the inverse of the selected buildings (show all buildings that are not selected) and does not receive visualization or filter updates. The basic concept of having two layers is described in code below:
var activeLayer = new SceneLayer({ url: url });
var backgroundLayer = new SceneLayer({ url: url });

activeLayer.visible = true;
backgroundLayer.visible = false;

scene.addMany([activeLayer, backgroundLayer]);

activeLayer.definitionExpression = "buildingID IN (25617, 4682)";
backgroundLayer.definitionExpression = "buildingID NOT IN (25617, 4682)";
Code snippet to show how to highlight features by having two identical layers in the ArcGIS JS API.
In order to filter the layers properly, different definition expressions from various tools can simply be concatenated. Because the filtering as well as selecting a building or multiple building influences the appearance of both the view and the components of the application, interacting with the application updates the definition expression that is attached to the active layer. For example, if a user selects two buildings and wants to see the office units of the ground floor of those buildings, then the following definition expressions are combined:
- coming from the highlight tool
“buildingID IN (25617, 4682)”
- coming from the filter tool
“Floor = ‘Groundfloor'”
“Usage = ‘Office'”
- Concatenate to filter the layer
activeLayer.definitionExpression = “buildingID IN (25617, 4682) AND Floor = ‘Groundfloor’ AND Usage = ‘Office'”;
When querying a layer you can either build a new query or you can create one that already satisfies the definitionExpression that is set on the layer. By using createQuery() the result will only return already filtered features – as described and shown in the SceneLayer filter and query sample. This was especially practical to retrieve values for interactively creating charts and statistics as the where clause of the query does not need to be constructed again because the layer has a definition expression from where this information is obtained directly.
var query = activeLayer.createQuery();

query.returnGeometry = false;
query.outFields = ['*'];

activeLayer.queryFeatures(query).then(function(result){
  var selection = result.features;
  // create chart data from selection
}
Code snippet to show how to query a Scene Layer by accessing the already filtered features.
Final Thoughts
The process of building c-through can be seen as an integration of promising input data into a chain of Esri products that finally outputs a meaningful application which has the potential to support and simplify analysis and decision making in urban planning. We initially started with an issue in urban planning where a need for action has established over the past years and have successfully built an easy-to-use solution with comparably little effort. A major advantage of this workflow can be seen in the interoperability of the Esri products that allows for an implementation that can be realized in weeks instead of months.
Urban planning is increasingly heading towards the third dimension not only for visualization tasks towards the end of a project life cycle but more and more also for the analysis in the preliminary steps. Additionally, a consensus on the benefits of web platforms has been reached in this field and those can especially be found in the possibility pf sharing and collaboratively working on projects as well as the potential for useful interaction as the c-through web app has shown. However, we are still at the very beginning of this revolution. There is still a lack of web applications in the field of urban planning that go beyond the simple visualization of attributes or try to display huge portions of a city with a sophisticated level of detail.
C-through has proven as a prototype that these exact requirements can be fulfilled and achieved by using the technology mentioned above. As a general concept, it can be applied to any city or project site that has data on floor and unit scale or can make it available. In the age of BIM, data with an even higher level of detail can be used for such applications and provide a huge potential especially for visualizations and animations.
As a result of the extensive feedback on the c-through prototype, a larger set of interaction as well as animations will be evaluated and tested now in order to eventually reach the next generation of urban planning apps.


Commenting is not enabled for this article.