We are excited to see you at the Esri Developer & Technology Summit 2026! Whether you’re joining us in-person or online, you’ll discover extensive technical sessions and inspiring demos. You’ll also have the opportunity to connect with the team behind ArcGIS Maps SDK for JavaScript, Calcite Design System, and ArcGIS Arcade to get all your questions answered.
Here’s a quick guide to help you navigate the conference and make the most of every session.
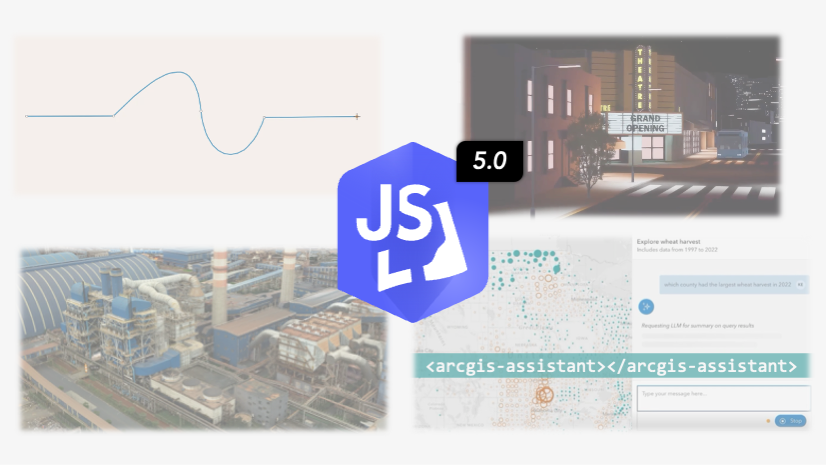
Build with Web Components

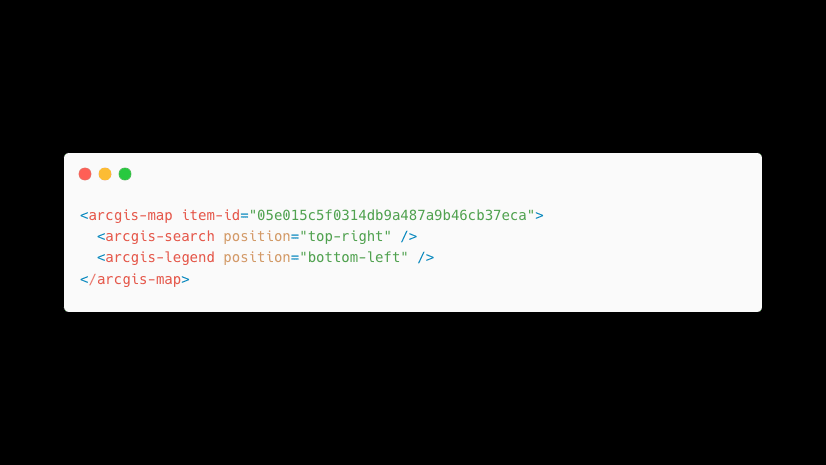
ArcGIS Maps SDK for JavaScript web components are custom HTML elements (e.g, <arcgis-map>) that wrap SDK functionality into reusable UI building blocks. Built using web standards (Custom Elements, Shadow DOM, and HTML Templates), they work natively in modern browsers.
This 4-part series takes developers from core concepts and web components, through framework integration with React and Vite, to building user experiences with Calcite Design System, and finally mastering theming, branding, and customization with design tokens and component slots, providing a complete path to building professional, production-ready web mapping applications.
-
ArcGIS Maps SDK for JavaScript: App Development with Components, Part 1: Programming Patterns
Wednesday, Mar 11; 11:00 AM – 12:00 PM PDT
-
ArcGIS Maps SDK for JavaScript: App Development with Components, Part 2: Using Frameworks
Wednesday, Mar 11; 1:00 AM – 2:00 PM PDT -
ArcGIS Maps SDK for JavaScript: App Development with Components, Part 3: User Experience
Wednesday, Mar 12; 10:30 AM – 11:30 PM PDT -
ArcGIS Maps SDK for JavaScript: App Development with Components Part 4: Extending and Styling
Tuesday, Mar 12; 1:00 AM – 2:00 PM PDTIn the newly added final session of this four-part series, learn how to apply branding and styling to your apps using Calcite design tokens and ArcGIS Maps SDK for JavaScript component tokens. Discover how to implement light and dark modes across components, and use component slots to integrate custom workflows and fine-tune your app’s UI and UX.
Visualization

Discover how to transform spatial data into compelling visual stories with the ArcGIS Maps SDK for JavaScript. These sessions highlight practical approaches to 2D data visualization, creative and custom rendering techniques, powerful 3D mapping on the web, and dynamic time-based visualizations, including real-time and historical data, giving developers the tools to build engaging, expressive mapping experiences.
-
ArcGIS Maps SDK for JavaScript: Dynamic, Data-driven Visualization
Wednesday Mar 11; 1:00 PM – 2:00 PM PDT -
ArcGIS Maps SDK for JavaScript: Creating a Custom Visualization Style
Wednesday Mar 11; 3:15 PM – 3:45 PM PDTThis newly added session shows how to create custom, expressive visualizations beyond built‑in renderers by combining dynamic multilayer symbology, renderers, and Arcade to build powerful spatial visuals. Prior experience with symbols, renderers, and Arcade is recommended.
-
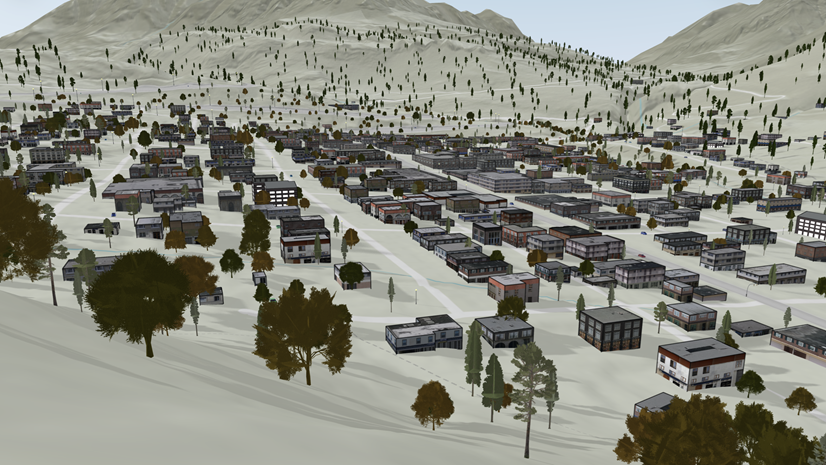
ArcGIS Maps SDK for JavaScript and 3D GIS Visualization: A Developer’s Guide Beyond 2D Cartography
Thursday, Mar 12; 1:00 PM – 2:00 PM PDT
Explore how the ArcGIS Maps SDK for JavaScript powers immersive 3D visualization on the web—covering 3D symbology, visual variables, key data layers, and best practices for creating interactive, thematic 3D experiences.
-
ArcGIS Maps SDK for JavaScript: Real-Time and Historical Data Visualization
Thursday, Mar 12; 2:30 PM – 3:30 PM PDT
Building your UI

-
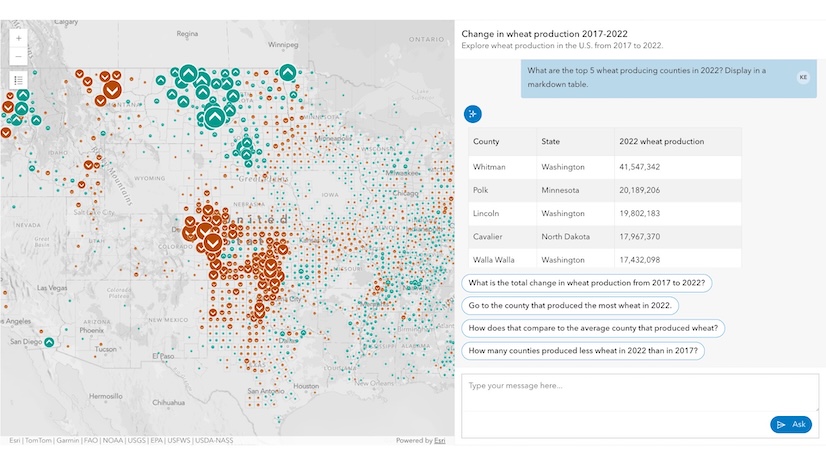
Building Accessible Web Apps with ArcGIS Maps SDK for JavaScript and Calcite
Wednesday, Mar 11; 4:00 PM – 5:00 PM PDTThis session teaches developers how to build AI assistants for web applications using the ArcGIS Maps SDK for JavaScript framework. You’ll learn essential terminology, work with built-in components and workflows, create custom workflows tailored to your application, and optimize the user experience by leveraging client-side browser and SDK capabilities.
-
ArcGIS Maps SDK for JavaScript: Better UX with Popups
Friday, Mar 13; 10:00 AM – 11:00 AM PDT
Layer & Data
 cluster in central Kansas, while deep wells (brown) concentrate in the southwest")
These sessions show developers how to get the most out of layers and data with the ArcGIS Maps SDK for JavaScript. You’ll learn to optimize Feature Layer performance, run powerful client‑side queries, visualizations, and analytics directly in the browser, and work with modern formats like Parquet, GeoJSON, CSV, GeoTIFF, and OGC services. The lineup also highlights imagery workflows, Cloud Optimized GeoTIFFs, client‑side raster processing, and interactive data exploration with the Feature Table, equipping you to build high‑performance, data‑driven web apps at scale.
-
ArcGIS Maps SDK for JavaScript: Max Speed & Capabilities of the Feature Layer
Wednesday, Mar 11; 4:00 PM – 5:00 PM PDTThis brand-new session shows developers how to get the best performance from Feature Layers in web apps by optimizing service configuration, caching, and client‑side queries, demonstrating practical techniques to efficiently work with feature data directly in the browser.
-
ArcGIS Maps SDK for JavaScript: Client-Side Queries & Analysis
Wednesday, Mar 11; 5:30 PM – 6:30 PM PDT -
ArcGIS Maps SDK for JavaScript: Working with Parquet
Thursday, Mar 12; 1:00 PM – 1:30 PM PDT -
ArcGIS Maps SDK for JavaScript: Working with Imagery
Tuesday, Mar 10; 4:45 PM – 5:15 PM PDT -
ArcGIS Maps SDK for JavaScript: Bring in Data from Anywhere
Wednesday, Mar 11; 2:30 PM – 3:30 PM PDT
Build compelling web applications with ArcGIS

These sessions deliver an end‑to‑end view of web app development—from automating data ingestion and managing services to authoring web maps with cartographic best practices and building custom 2D and immersive 3D apps. Explore real-world app showcases, learn core web architecture and low code options, and engage directly with the SDK team in an open, audience driven Q&A.
-
Strategies for Web Development
Tuesday, Mar 10; 1:00 PM – 2:00 PM PDT
-
From Raw Data to Custom App: Data Engineering, Mapping, and Web Development
Tuesday, Mar 10; 4:00 PM – 5:00 PM PDT -
ArcGIS Maps SDK for JavaScript: Building a 3D Web App from the Ground Up
Tuesday, Mar 10; 5:30 PM – 6:30 PM PDT
-
ArcGIS Maps SDK for JavaScript: The Secrets Behind 10 Inspiring Web Apps
Thursday, Mar 12; 10:30 AM – 11:30 AM PDT -
Q&A with the JavaScript Maps SDK Team
Friday, Mar 13; 10:00 AM – 11:00 AM PDT
JavaScript Maps SDK Mastery: First App to Production Ready

Whether you’re new to web mapping or sharpening your engineering skills, this track has you covered. It starts with web basics and an intro to the ArcGIS Maps SDK for JavaScript, then dives into SDK internals, performance, and real‑world workflows using modern tools like Vite and Vitest—ending with best practices for testing and building reliable Web GIS applications.
-
Web Development Basics: HTML, CSS, and JS
Tuesday, Mar 10; 1:00 PM – 2;00 PM PDT
-
ArcGIS Maps SDK for JavaScript: Build Your First App
Tuesday, Mar 10; 2:30 PM – 3:30 PM PDTGet started with the ArcGIS Maps SDK for JavaScript in this beginner friendly session. Learn setup basics, build simple 2D and 3D maps, and use tutorials and samples to start creating web mapping apps fast.
-
ArcGIS Maps SDK for JavaScript: Build and Maintain a Collection of Web Apps
Thursday, Mar 12; 2:30 PM – 3:30 PM PDTIn our first case study style session, see real examples of how Esri developers use Vite and Vitest to streamline builds, testing, and deployment for Web GIS apps.
-
ArcGIS Maps SDK for JavaScript: A Look Under the Hood
Wednesday, Mar 11; 2:30 PM – 3:30 PM PDT -
ArcGIS Maps SDK for JavaScript: Using Vite for Building Fast, Dynamic Web Apps
Thursday, March 12; 4:00 PM – 5:00 PM PDT
Build Powerful Web Applications with ArcGIS Capabilities
These sessions highlight core and advanced capabilities of the ArcGIS Maps SDK for JavaScript, including printing workflows, advanced labeling, graph‑powered applications with ArcGIS Knowledge, and browser‑based utility network workflows. Together, they offer practical guidance and real‑world insights to help developers build more powerful, scalable, and intelligent web mapping applications.
-
Printing for Web Developers
Friday, Mar 13; 8:30 AM – 9:30 AM PDT -
ArcGIS Maps SDK for JavaScript: Building Web Applications with ArcGIS Knowledge
Friday, Mar 13; 10:00 AM – 11:00 AM PDT -
ArcGIS Maps SDK for JavaScript: Labeling Techniques for Multi-scale Maps
Wednesday, Mar 11; 2:30 PM – 3:00 PM PDT -
Introduction to ArcGIS Knowledge Graphs and Extending with ArcGIS Maps SDKs
Tuesday, Mar 10; 4:00 PM – 5:00 PM PDT -
ArcGIS Maps SDK for JavaScript: Building Utility Network Applications
Wednesday, Mar 11; 2:30 PM – 3:30 PM PDT -
ArcGIS Maps SDK for JavaScript: Next-gen Web Editing & Custom Workflows
Wednesday, Mar 11; 11:00 AM – 12:00 PM PDTIn this new session see how intuitive components and the core API come together to deliver fast, accurate editing experiences—from split and merge operations to curve editing, advanced drawing, related records, and batch updates. Discover the latest productivity boosters like preset templates and table-based workflows, then learn how to go beyond out‑of‑the‑box components to craft custom editing experiences tailored exactly to your app’s needs.
Highlights and Roadmap
These sessions offer a comprehensive view of ArcGIS Maps SDK for JavaScript—highlighting the most impactful updates from the last year while providing an exclusive, in‑person look at the roadmap and strategic direction from the teams building the SDK.
🗓️ Esri Tech Zone Schedule

📍 Locate the Web Development team in the Tech Zone!

Join us at the Palm Springs Convention Center for the 2026 Esri Developer and Technology Summit! If you haven’t already registered, there’s still time—Register Now and we’ll see you there!
To explore more about the ArcGIS Maps SDK for JavaScript, visit our webpage. For detailed documentation, head over to the Esri Developer site. Also, stay in the loop with the latest in Developer technology by subscribing to the Esri Developer Newsletter.


Article Discussion: