Note: The ArcGIS Maps SDK for JavaScript now uses semantic versioning, making it easier to understand changes, assess upgrade impact, and plan updates with confidence.
Welcome to the first release of version 5! Packed with exciting upgrades – from a powerful new AI assistant to a redesigned documentation site – this release takes it to the next level. Dive into the highlights of Version 5.0 and see what’s new!
AI components (beta) for agentic mapping web applications
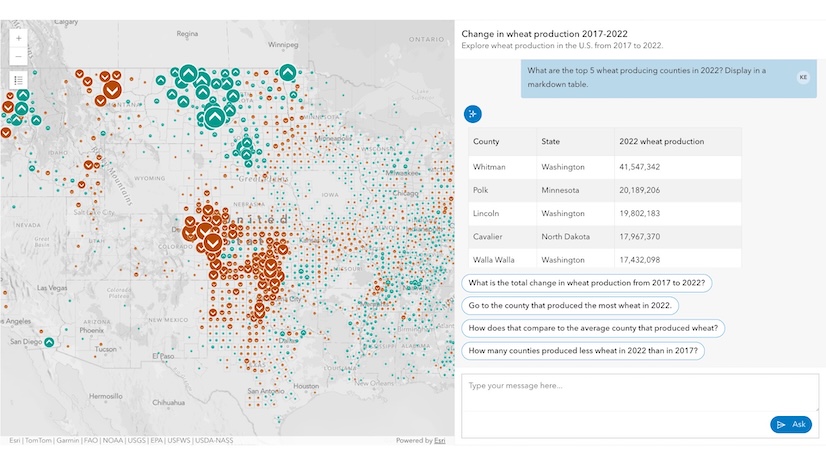
Create agentic web mapping applications that use a natural language interface with our new AI components (beta) package. Users can explore and analyze geographic information through conversational prompts, offering a more straightforward and accessible experience.
This package contains the assistant component and agents:
Assistant component: <arcgis-assistant> provides end users with a chat interface, enabling them to interact with a web map using natural language via one or more agents.
Agents: process user inputs and generate appropriate responses based on their functionality
- Navigation agent: for navigating to a particular part of the map – answering the ‘Where’ questions. Example prompts: “Go to the Golden Gate Bridge”, “zoom in”
- Data exploration agent: for querying & filtering features, calculating statistics and spatial proximity – the ‘What’ questions. For example, “What is the city with the largest population?” and “How many cities are within 30 miles of the Colorado River?” can be answered with a map containing corresponding layers.
- Help agent: for contextual assistance and guidance, such as “What kind of questions can I ask?”, “What layers are in this map?”
- Custom agents: Developers can build custom agents for the Assistant component to handle unique tasks, workflows, or data needs
To use AI assistant and agents, only a few lines of code is required:
<arcgis-assistant reference-element="#wheat-map">
    <arcgis-assistant-navigation-agent></arcgis-assistant-navigation-agent>
    <arcgis-assistant-data-exploration-agent></arcgis-assistant-data-exploration-agent>
    <arcgis-assistant-help-agent></arcgis-assistant-help-agent>
</arcgis-assistant>
<arcgis-map id="wheat-map" item-id="dd6e8957e7a94765bf32bc07097cbf46"></arcgis-map>
To learn more about building agentic mapping applications with AI components, check out our guide page, try out the components, and let us know your feedback during the beta period.
Draw and edit true curves
Drawing true curves with Sketch: Users can now create geometries with curve segments while drawing, using new tools such as Bezier curves, Arc segments, and Endpoint Arc segments—making it easy to construct both Bezier and circular arcs. Existing straight-line segments can be converted to circular arcs by dragging the midpoint handle while holding the shift key.
Segment-based drawing: Seamlessly switch between drawing tools — line, freehand, and new curve options — while creating geometry segments on polylines or polygons.
The new curve drawing tools are integrated in the Sketch and Editor components and sketch view model natively.
Create, edit, and snap to features with curve in Editor: The Editor component now supports adding and updating features with true curves, as well as snapping to any point along a curve segment, enabling easy and confident curve editing within your feature layer.
Note: curve support and tool switching are supported in 2D only.
Illuminate 3D scenes with light-emitting symbols and glow
Emissive materials make symbols emit light, enabling realistic nighttime scenes as well as visual emphasis and improved legibility. Any volumetric symbol can be turned into a light-emitting element — well suited for highlighting selected features thematically. For realistic nighttime rendering, apply emissive information directly into 3D models, such as illuminated signage or windows, for a natural atmosphere.
The glow effect enhances all emitters with a soft, luminous appearance and a more stylized look across the scene.

Gaussian splat layer
We are introducing the Gaussian Splat Layer, a new 3D layer type that provides photorealistic visualization of complex built and natural environments in a 3D scene. It delivers high detail rendering for thin and intricate structures such as powerlines, railings, antennas, and dense vegetation, along with smooth transparency for materials like glass and other semi translucent surfaces. These enhancements support advanced workflows like inspection, vegetation analysis, and high-fidelity presentation workflows.
Gaussian splat layer is best suited for high-detail areas, offering realistic visuals. Integrated mesh layer provides high precision, editable, and measurable data. Together 3D layer types enable developers to build interactive, immersive, and context‑rich 3D experiences on web.

Feature table enhancements
Edit with contingent attribute value constraints: The Feature Table component now honors contingent attribute value constraints when editing cells, ensuring data integrity and valid attribute updates in the table.
Staging changes while editing in feature table: Developers can disable the automatic saving while editing to verify updates before saving the changes. Autosaving is still enabled by default.
Improved attachment viewing experience: You can now see additional file information, such as name, attachment type, size, and keywords when viewing attachments in the table.
Building apps with components
This release officially marks an exciting evolution — from widgets to components!
Components are the recommended way to build applications, offering maximized productivity and seamless integration with modern frameworks. While all widgets are deprecated in 5.0, your existing widget-based apps will continue to run as expected. Widgets will no longer receive new features and are planned for removal in Q1 2027 (version 6.0). Explore our migration guide, updated programming patterns, tutorials, and ready-to-use component samples to start building the next generation of applications!
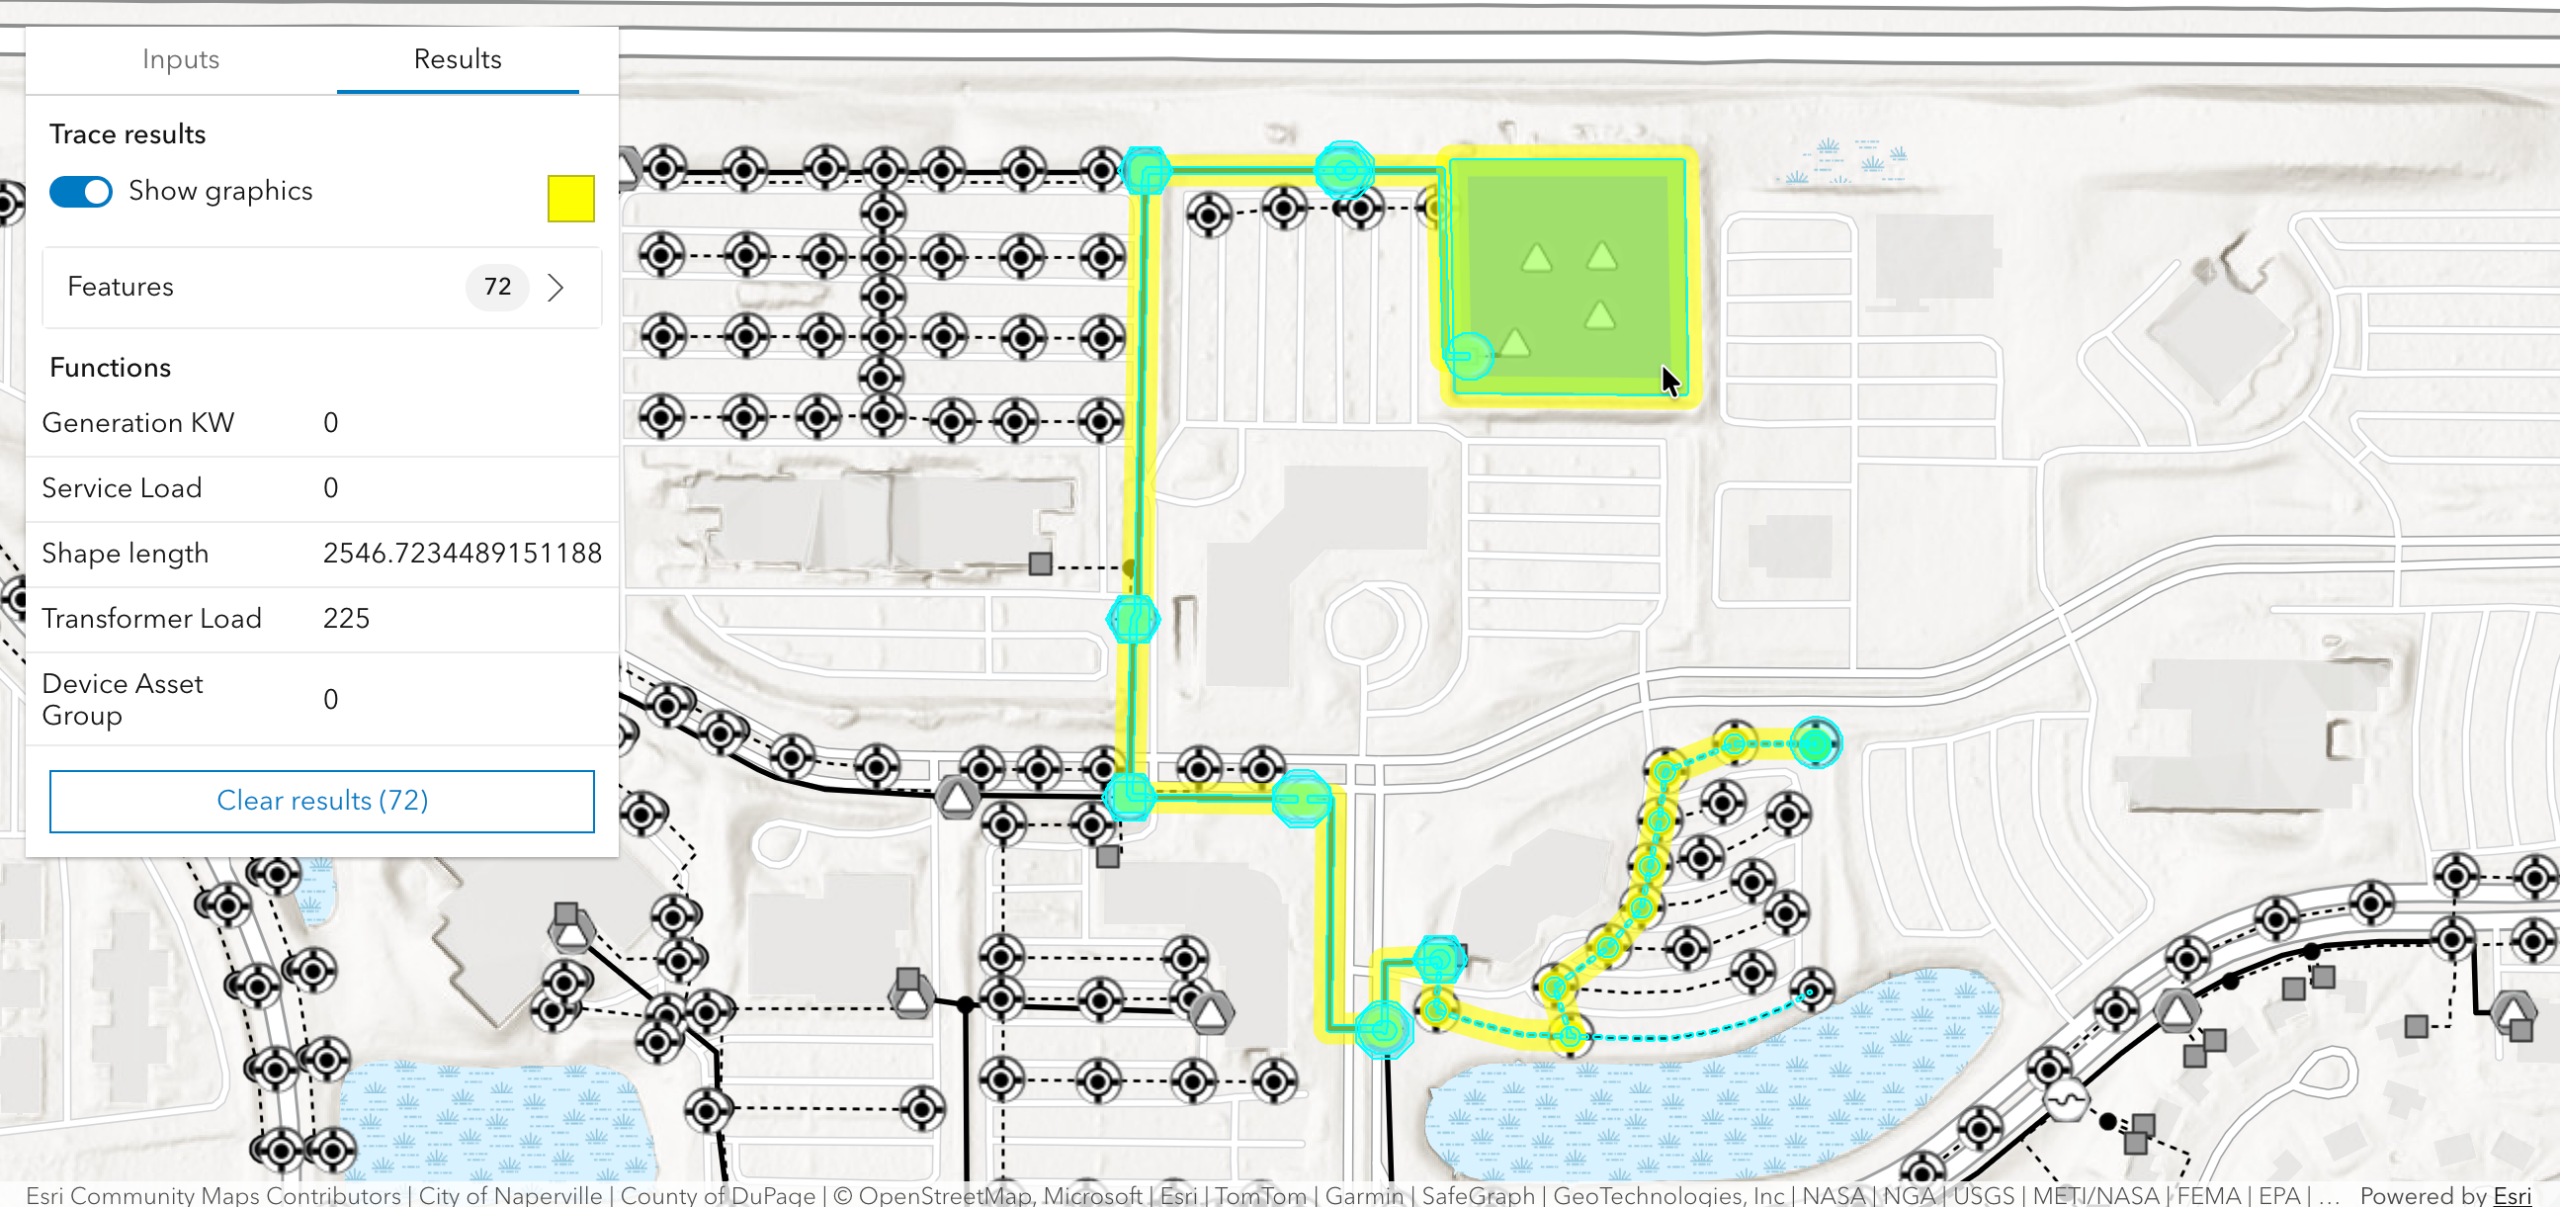
New components: this release includes many new components, starting with the Utility Network Trace Analysis component for an enhanced and streamlined trace experience and the Volume Measurement component (beta) for adding this analysis declaratively.
New styling options: the visualScale property is added to selected components for easy size adjustment. A new css variable called --arcgis-view-color-focus has been added for updating the focus outline color for the Map and Scene view.
Analysis-based components: Elevation Profile, Shadow Cast, and Volume Measurement (beta) components are now utilizing the corresponding analysis object respectively, improving the stability and consistency. The analysis objects are also available in the core API as a replacement of view models.
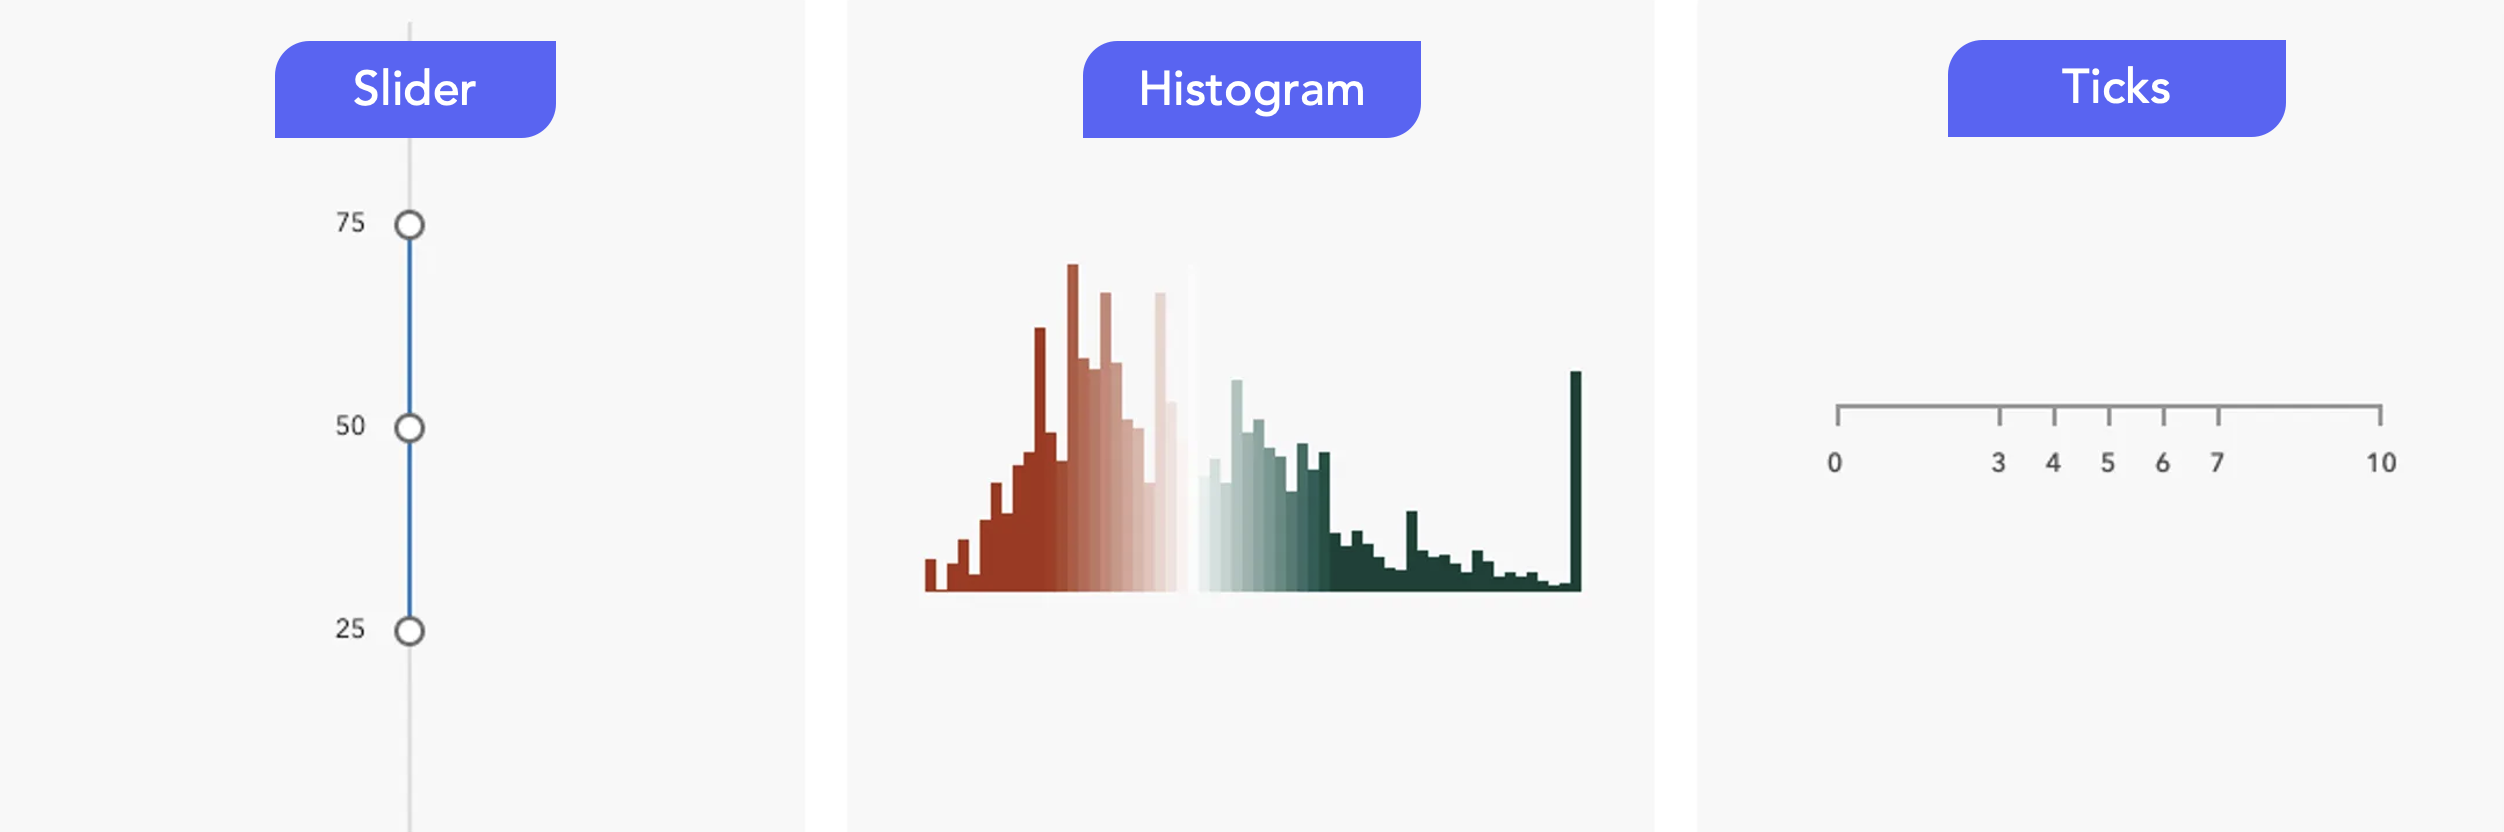
Common component packages: The new common components package contains a set of UI components, including the Slider, Histogram, and Ticks components. They are great for quantitative visualization with or without a map.
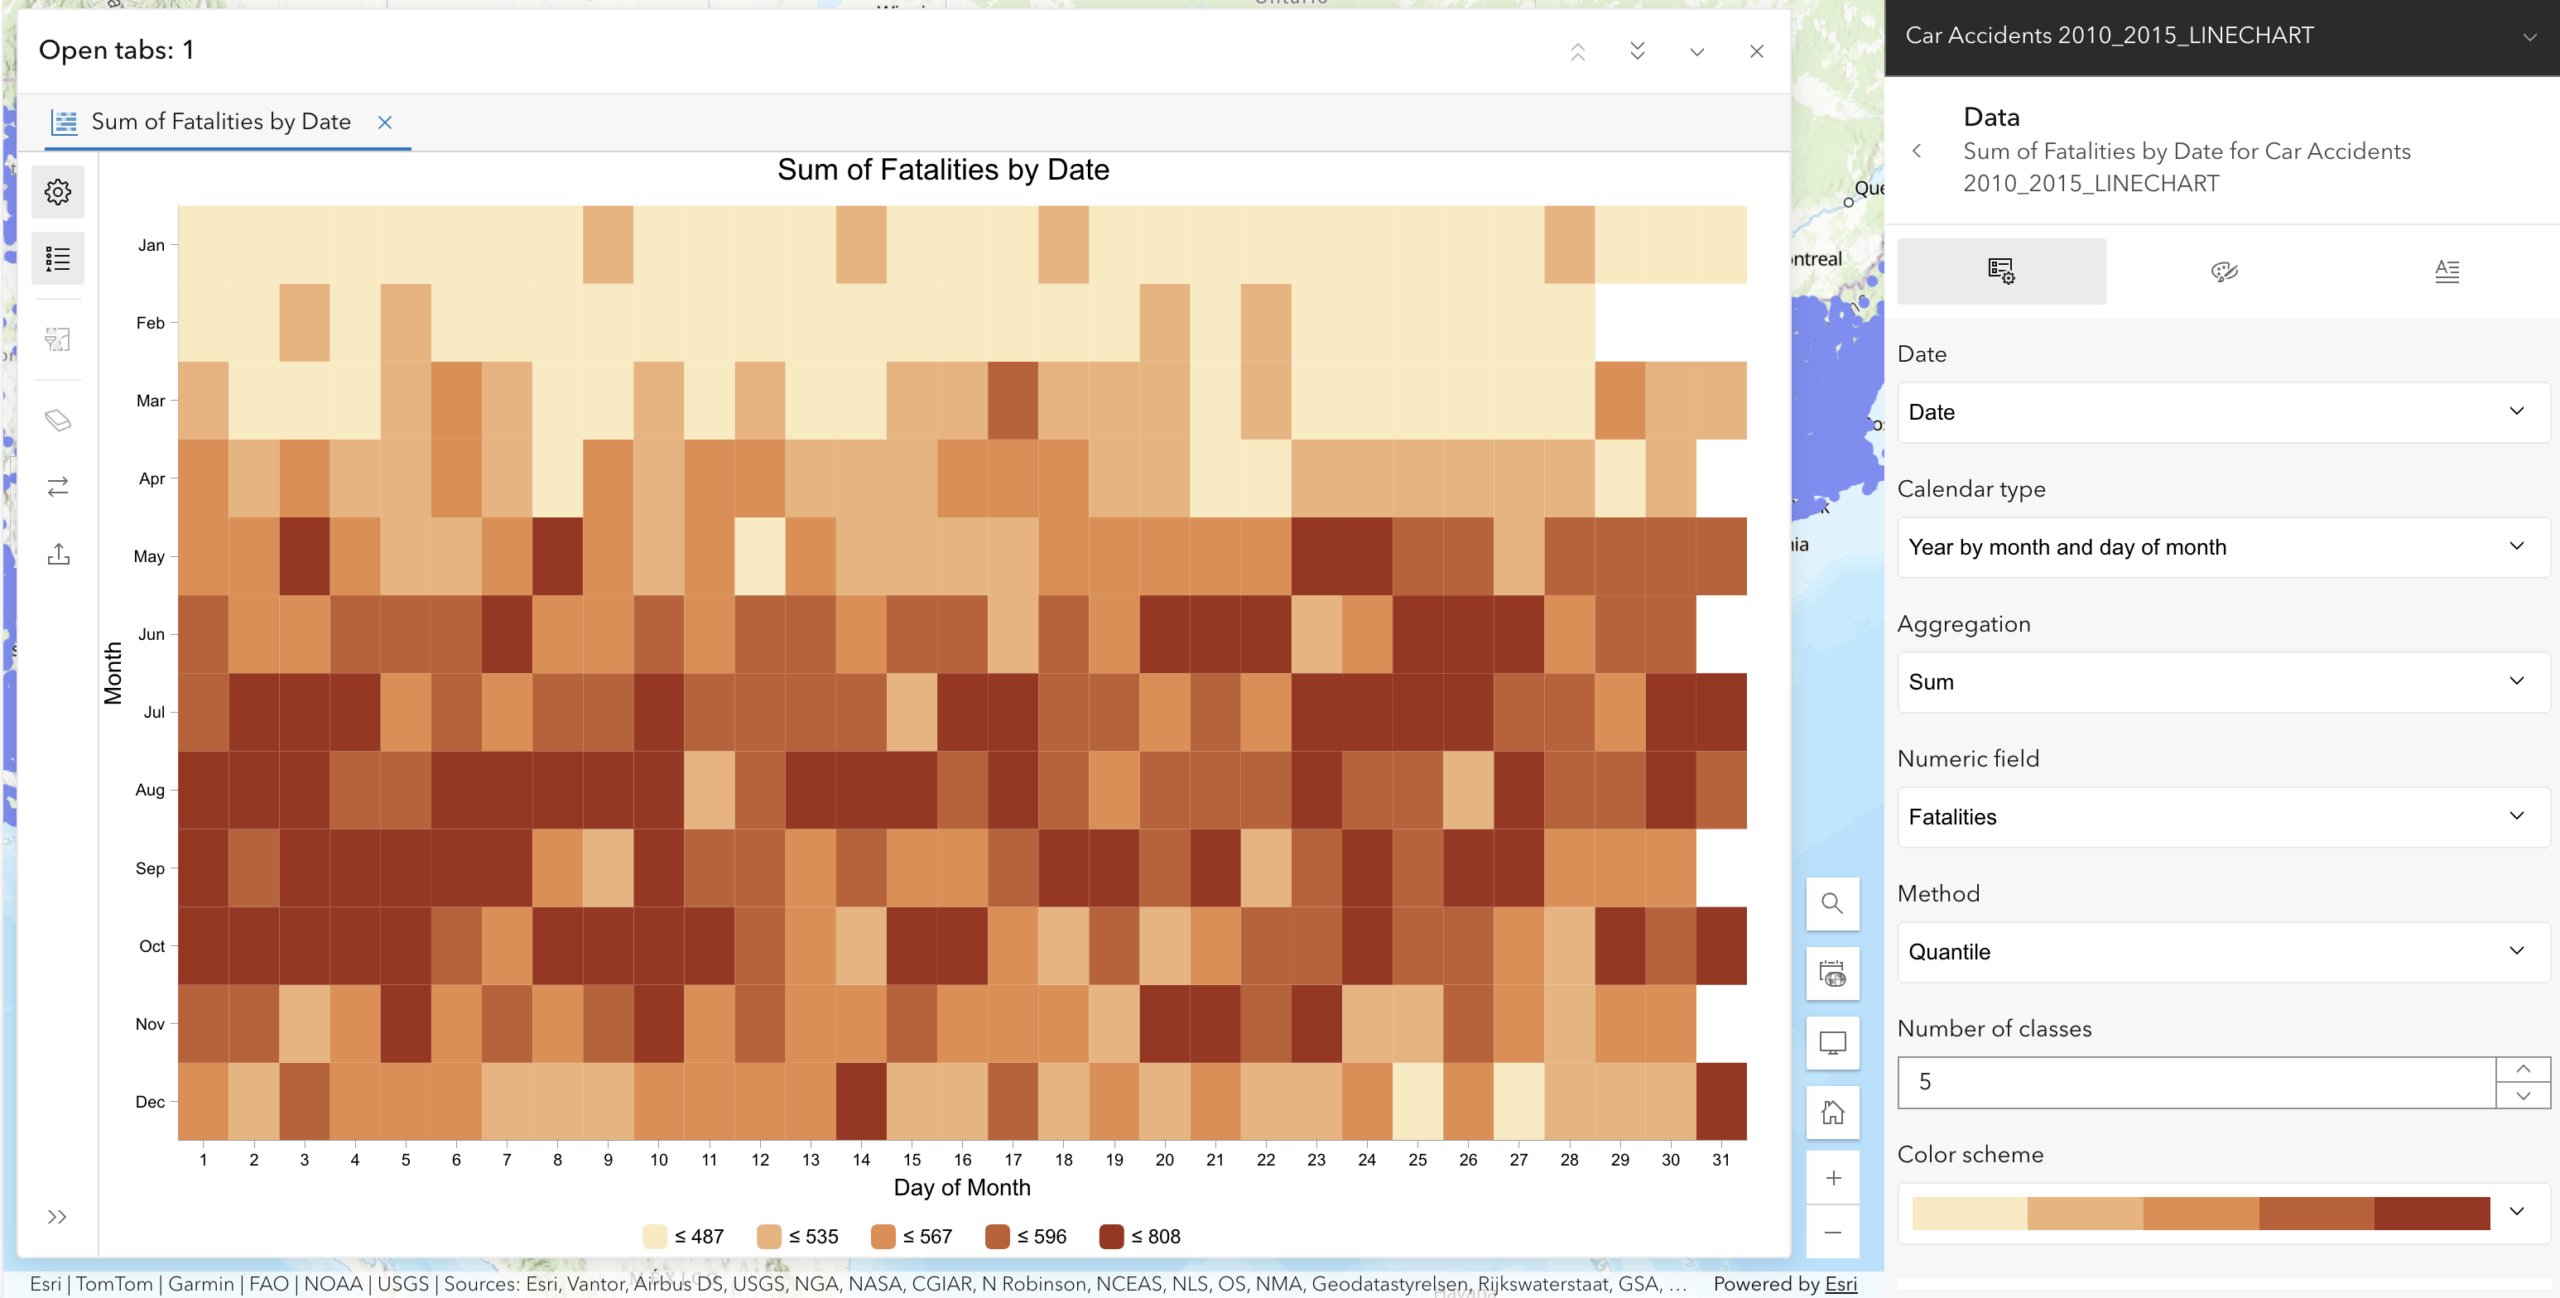
Charts components: You can now author heat charts in Map Viewer and load them in custom web applications from the layer, expanding the programmatic option via charts model released in 4.34. Also, class break rendering is supported in heat charts to visualize data in distinct ranges.
Label enhancements
Improved occlusion handling for labels and icons in 3D: Labels and icons now remain recognizable in 3D scenes even when partially or fully occluded, providing better context, orientation, and spatial awareness. We introduced the new occludedVisibility property for setting visibility, including three modes:
- Adaptive (default): Labels and icons that are behind other objects are rendered depending on how far behind an object they are. This mode is used in 3D Basemaps.
- Visible: Labels and icons behind other objects are always rendered.
- Hidden: Labels and icons behind other objects are not rendered. This matches behavior of previous versions of the SDK
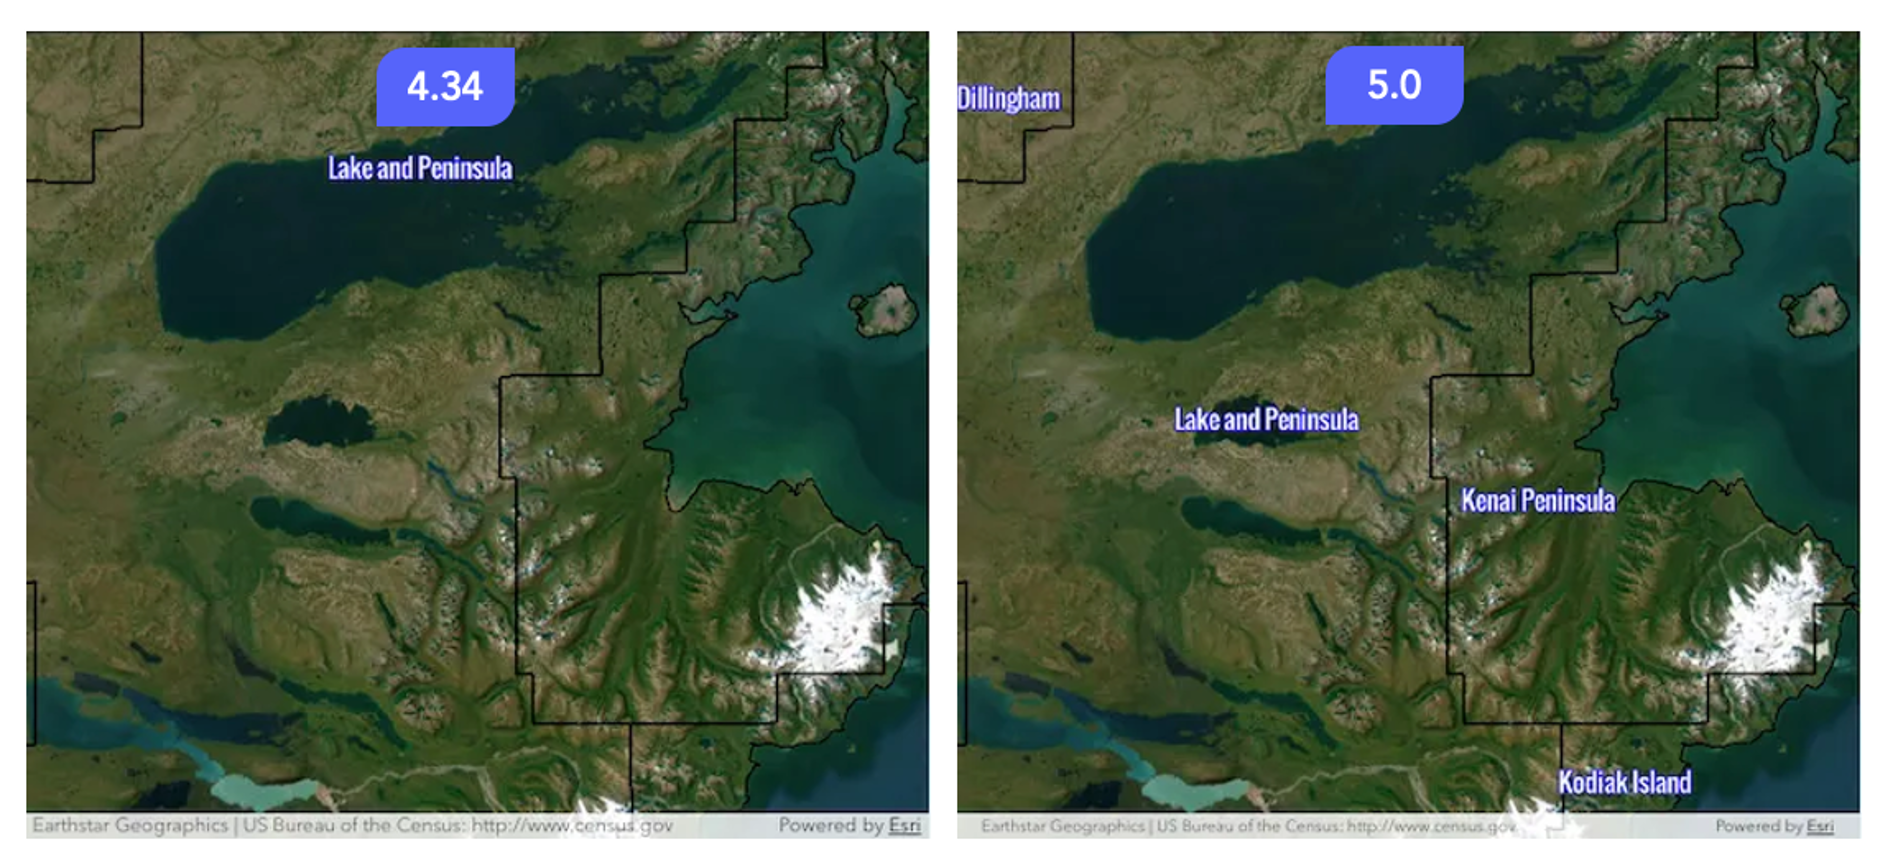
Automatic label repositioning for polygons in 2D : Labels within polygons are automatically repositioned when the polygon’s centroid is outside of the visible 2D map area, so that labels remain visible and provide better context as you navigate around the map.
Drag and drop waypoints in Directions component
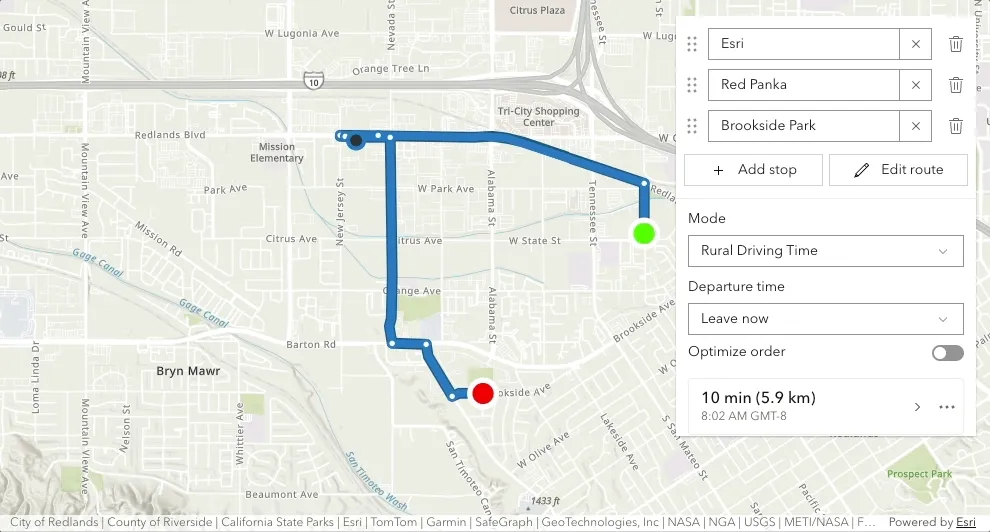
The Directions component now allows users to fine-tune routes with waypoints in a familiar “drag and drop” experience. Waypoints are locations that routes must travel through but do not need to stop at. Use “Edit route” button to add, move, and remove waypoints.
Oriented Imagery Enhancements
The Oriented Imagery Viewer component interface has been redesigned to deliver a more streamlined and intuitive user experience. We also added a new search tool for easy imagery access, and improved image caching for performance, and time info filtering for precise image query based on temporal constraints.
Syncing selection via Selection manager
The new Selection Manager (beta) class provides developer access to selected features in layers and tables in both 2D map and 3D scene. The selection manager can be configured to listen for edits on selectable layers and automatically update selections in response, providing a centralized way to manage selection state within a view.
Session-based basemap usage
ArcGIS Location Platform developers can use the new basemap session API to consume basemaps by sessions, a time frame during which a single user of a single application can access unlimited basemap tiles from the basemap service. This can help developers predict the cost of basemap usage. Explore the usage model in action with this tutorial.
Documentation and programming improvements
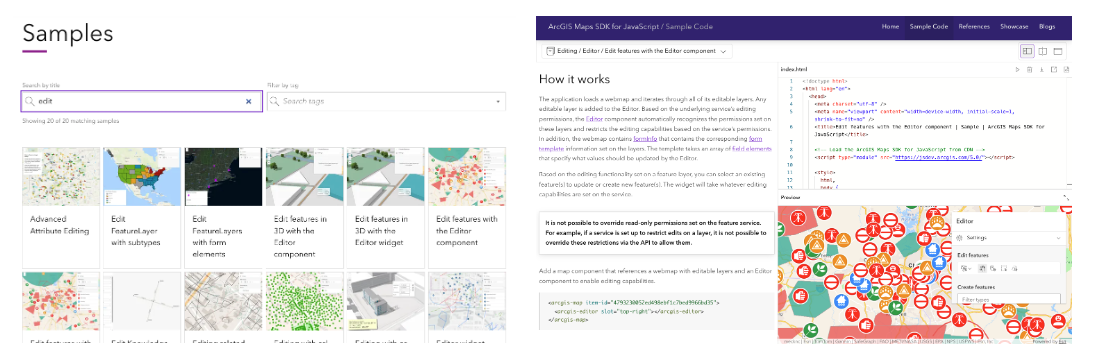
New sample searching and viewing experience: You can explore the list of samples with our improved layout and search experience. We also added new layouts to samples so that the full description, code, and preview window are all available at the same time, making it easier to edit code live while reading the description. Additionally, the majority of the samples have been updated to use components to reflect the recommended usage patterns and best practices.
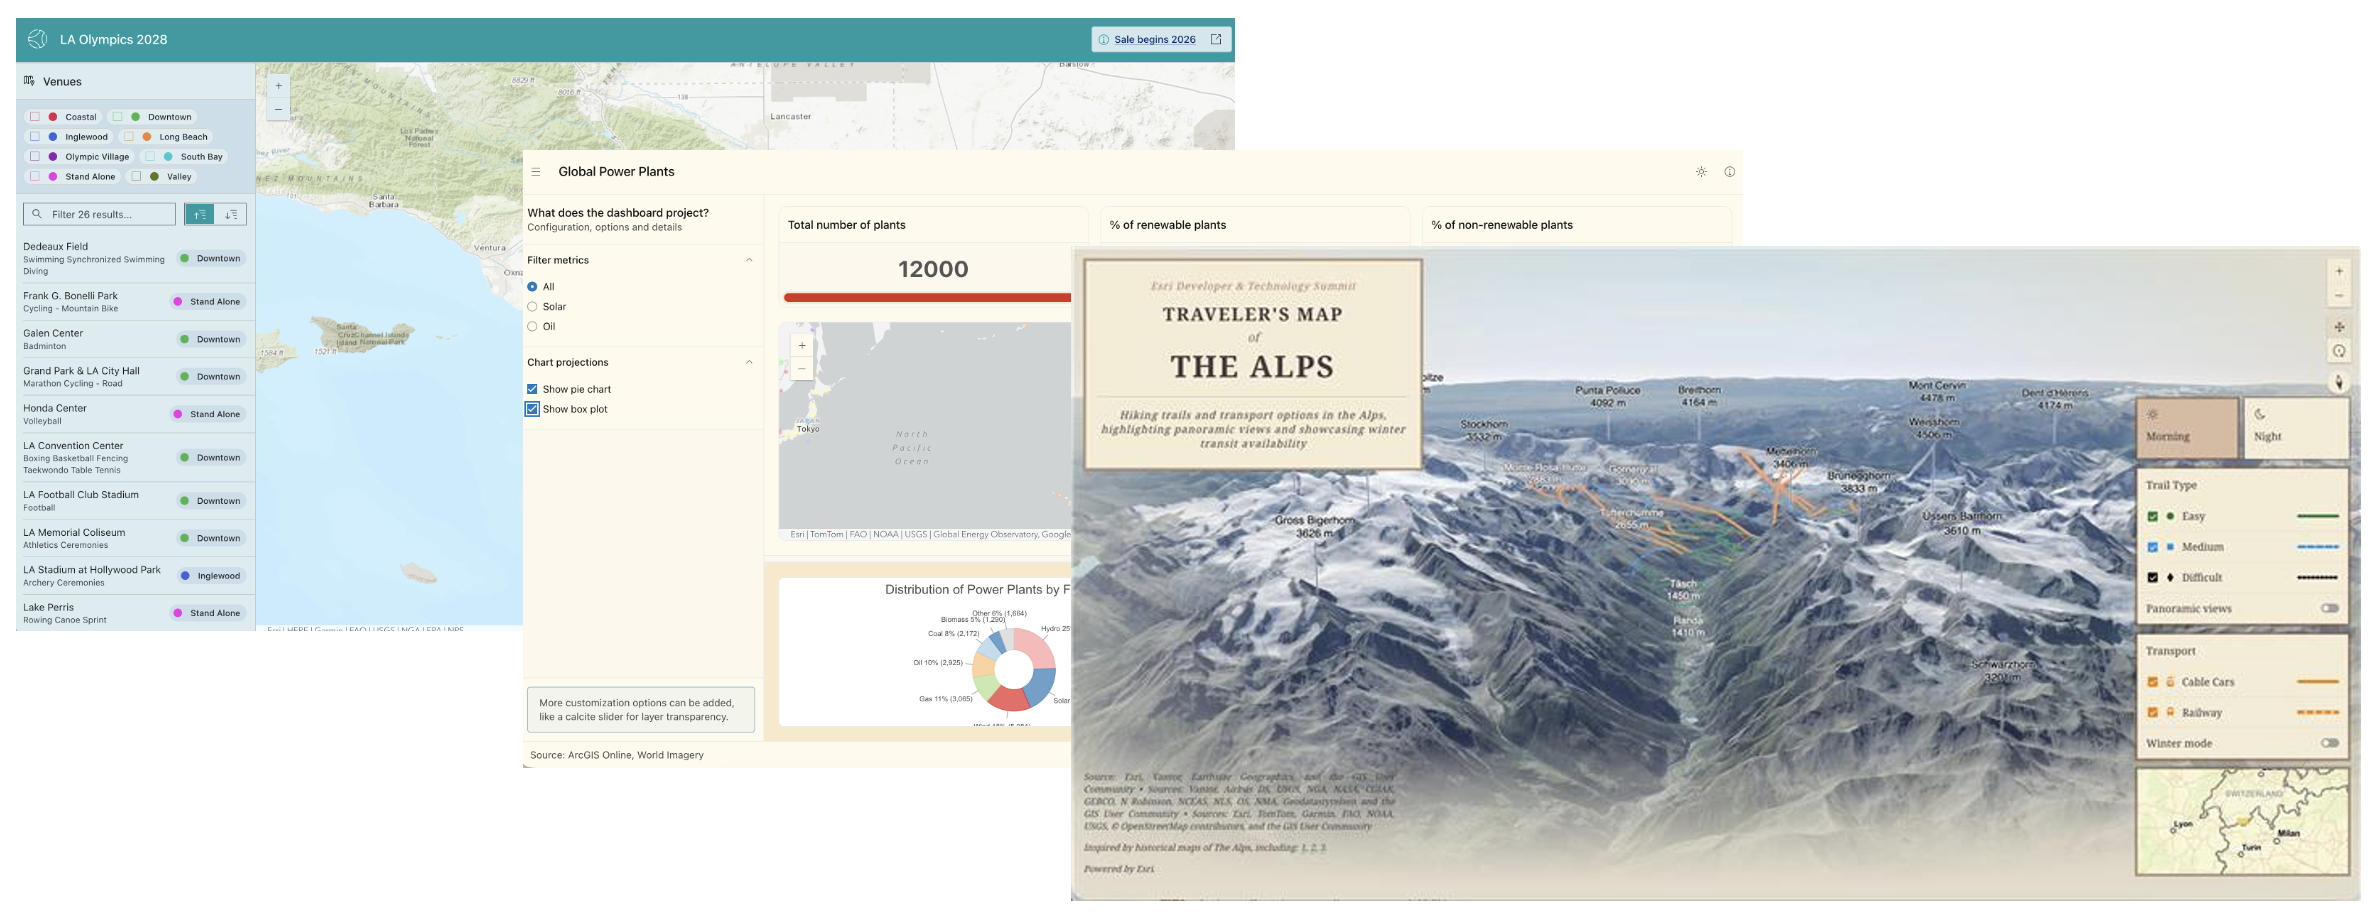
Mapping application layouts: A new guide introduces recommended patterns for structuring web mapping applications for building with the Calcite Design System and JavaScript Maps SDK. Three new layout-focused samples are now available under layout applications, built to provide easy starting points for constructing your UI.
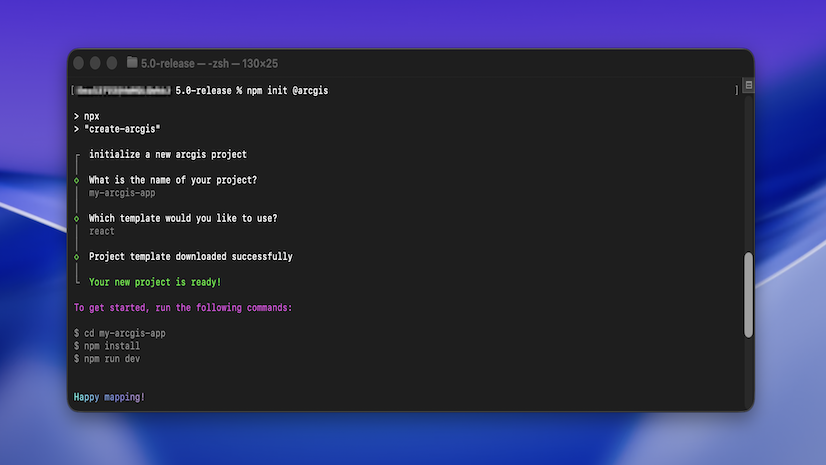
Get started with @arcgis/create: The Get started guide has been updated with guidance on creating an app with npm using the @arcgis/create CLI tool and starter templates. Now, you can create a ready-to-use application with one simple command: npx @arcgis/create -n my-arcgis-app -t vite
Single script tag for CDN users: Use one single script tag in CDN-based apps to access core API, map components, AI components, common components, charts components, coding components, and Calcite components all at once without significant increase of size. Please note that type="module" is required.
<!-- Load the ArcGIS Maps SDK for JavaScript from CDN -->
<script type="module" src="https://js.arcgis.com/5.0/"></script>
This replaces the multi-line script tag structure, making it easier to load the SDK and build small applications. The previous behavior is still accessible via <script type="module" src="https://js.arcgis.com/5.0/core.js"></script>
TypeScript import changes & codemod: For TypeScript developers, we recommend the use of individual ESM imports to directly import types from their respective module files. The previous __esri namespace is no longer supported. A codemod is provided to automatically update to the recommended ESM imports for simple migration.
Documentation for previous versions: Starting with version 4.34, previous SDK documentation for supported versions will be available on our archive site – making it easy to access what you need without downloading the SDK locally.
Migrating from Google? New guide pages designed to help Google Maps JavaScript API developers migrate to ArcGIS Maps SDK for JavaScript, including setup, tutorials for common workflows, and concepts & a terminology matrix to smooth the technical transition.
Learn more
Version 5.0 offers more than the highlights above. Enjoy smoother flow rendering transitions, improved transparent ground rendering, and more. Discover the full list of updates in our release notes.
Join our YouTube livestream, at 9.am PT, Wednesday April 15th. This relaxed, interactive session is your chance to explore the latest updates and get your questions answered directly by the product team.
The annual Esri Developer & Technology Summit is back in Palm Springs in March! Meet the teams behind Esri’s web development technology, share your innovations, and gain fresh insights. We’re excited to offer a series of technical presentations featuring the latest advancements, best practices & techniques, and inspiring examples.


Article Discussion: