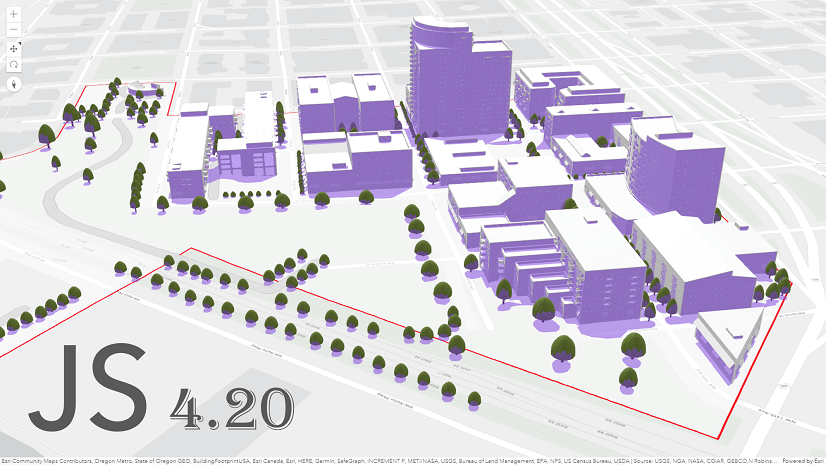
In the June release of the ArcGIS API for JavaScript (JS API), version 4.20, we added support for subtype group layers via a new layer called SubtypeGroupLayer.
The first question you may ask is “What exactly is a SubtypeGroupLayer?”. Subtyping allows us to subdivide a feature class into logical subsets. This concept has existed for decades, what is new is how we represent these subtypes on a map. Previously each subtype was assigned a single symbol, now with the SubtypeGroupLayer we can assign a single renderer to each subtype. SubtypeGroupLayers can be authored by ArcGIS Pro and are perhaps most familiar to users in the utility industry. Below I will dive deeper into the how, what, and why of SubtypeGroupLayers:
- What is a SubtypeGroupLayer
- How to create and publish a subtype group layer in ArcGIS Pro
- How to consume using the JS API
- More features of the SubtypeGroupLayer that we can take advantage of with the JS API
What is a SubtypeGroupLayer
Subtypes
Before we get to the layer, we must first learn about subtypes. A subtype is a subset of features in a feature class that share the same attributes and behavior. This is useful for categorizing your data, and it has some performance benefits. This is key for utility network datasets because it is very common to have numerous subtypes within the feature classes that make up the utility network. To learn more about subtypes, check out Introduction to subtypes.
Subtype group layer
Now let’s get into what the subtype group layer is. A subtype group layer, is as the name suggests, a group layer comprised of a sublayer for each subtype. Each sublayer can be assigned a valid renderer such as a simple renderer, unique value renderer, or class breaks renderer, which means we can configure layer properties for each sublayer independently of one another. The sublayers of a SubtypeGroupLayer are conceptually no different from the sublayers in other layer types such as MapImageLayer and WMSLayer. The big difference is that the SubtypeGroupLayer’s sublayers come from a single feature source. This is a crucial performance benefit because a single query to the feature source will return results for every single sublayer. Since all of the subtypes are published in single layer, we only have to send a request to a single feature source to fetch feature data when loading data, panning, or zooming in the map. This is much faster than sending requests to multiple feature sources.
Subtype group layer vs. multiple feature layers
In the next section I provide a feature class with 11 subtypes. If we attempt to mimic the SubtypeGroupLayer behavior with a FeatureLayer using this same dataset, it would require us to publish 11 different layers! Anytime we zoom or pan the map, there could be requests to 11 different feature sources each time. With larger datasets, the performance difference between these two workflows will become more apparent.
In this example the SubtypeGroupLayer loads 4x faster than individual feature layers, and reduces the total number of queries from 497 to 131. We are also able to draw all the features after zooming in twice with the SubtypeGroupLayer before the feature layers finish their initial load.

How to create and publish a subtype group layer in ArcGIS Pro
To demonstrate how to create and publish a subtype group layer in ArcGIS Pro, I created a simple point feature class with some subtypes and uploaded the dataset here if you would like to follow along. Feel free to skip this section if you already know how to publish a subtype group layer. You can use the following item and move on to the next section to start loading the data into the JS API. This dataset consists of point features representing marine animals around the United States. Note – this dataset was just created to showcase the subtype group layer and was not designed to contain accurate data. Let’s go ahead and get started!
Step 1:
Download the MarineLifeGDB file geodatabase containing the point feature class. Unzip the folder, connect to it from ArcGIS Pro, and load the data onto your Map by dragging the feature class over to the Map.

Once the data is added to the Map, you should see the following in your Pro project. The subtype field we are using is the TYPE field. A subtype field defines the field in the feature class that stores the subtype codes. Additionally, a feature class can have only one subtype field. In this dataset, the TYPE field represents the type of marine animal that corresponds to each feature.

Step 2:
Create the subtype group layer by going to the Map tab in the Layer group and click Add Preset.

Step 3:
Next, click Subtype Group Layer and navigate to the MarineLife feature class.

Add subtype group layer ArcGIS Pro 3.0 update
As of version 3.0 of ArcGIS Pro, the workflow to add a subtype group layer to the map has changed. The behavior remains consistent, however, there was a slight change in Step 2 and 3 above.
Step 2:
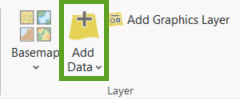
Create the subtype group layer by going to the Map tab and in the Layer group click the Add Data dropdown.
Step 3:
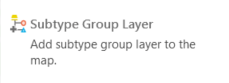
Next, click the Subtype Group Layer option in the Add Data dropdown and navigate to the MarineLife feature class.
Now you can see the subtype group layer has been added to your Contents pane. The original MarineLife feature class will still be there, remove it so we only have the subtype group layer in the Contents pane and in the Map.

As you can see, you now have the ability to hide all the features corresponding to a particular subtype, like you would normally with an individual layer! You can configure additional layer properties on these sublayers; like their own renderers as well. For instance, you can set a unique value renderer on the Turtle sublayer by using the TURTLE_SPECIES field. A unique symbol can represent the unique turtle species names from that field to make the features more distinguishable. We won’t get into much detail here because I will showcase how exactly we can do this using the API. So let’s move on to the final step in publishing the data.
Step 4:
To publish the layer to ArcGIS Online, or Portal for ArcGIS, right click the layer in the Contents pane, hover over Sharing, then select Share as Web Layer.

The Share As Web Layer form will display. Set the following values, and make sure Feature is selected as the Layer Type. Then click Analyze. If there are no errors, then click Publish.

And that is it, you have now created and published a subtype group layer! Let us now learn how we can consume this service as a SubtypeGroupLayer using JS API.
How to consume using the JS API
Initializing the SubtypeGroupLayer in the API is similar to the way we bring in a FeatureLayer. We just need to pass in the service url or the portalItem id pointing to the feature service.
const stgl = new SubtypeGroupLayer({
  url: "https://services.arcgis.com/V6ZHFr6zdgNZuVG0/ArcGIS/rest/services/MarineLife/FeatureServer/0",
});
OR
const stgl = new SubtypeGroupLayer({
  portalItem: {  // autocasts as new PortalItem()
    id: "105ce08103ed481197654d16c0fb0c9d"
  }
});
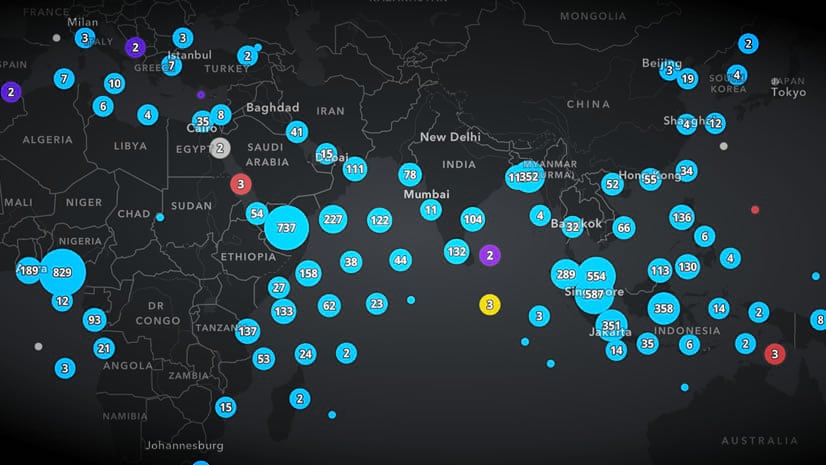
Here is an example of how we can load the SubtypeGroupLayer onto a Map using a service url. With the addition of the LayerList widget, it really feels like we are working with separate layers. However, we must remember that we are just loading an individual feature service!

Visualizing the sublayers
As mentioned, it is possible to configure layer properties for each sublayer. This means we can set a renderer on each individual sublayer. We can even set a min/max scale on each sublayer, so we have more control over when the features are rendered as a user zooms in and out of the map. We can configure these layer properties from the sublayers property of the SubtypeGroupLayer class, very similar to how sublayers can be configured already with the MapImageLayer.
const stgl = new SubtypeGroupLayer({
  url: "https://services.arcgis.com/V6ZHFr6zdgNZuVG0/ArcGIS/rest/services/MarineLife/FeatureServer/0",
  outFields: ['*'],
  sublayers: [{
    subtypeCode: 1, // Fish
    visible: true,
    renderer: createMarineSymbol("Fish"),
    title: "Fish"
  }, {
    subtypeCode: 3, // Whale
    visible: true,
    renderer: createMarineSymbol("Whale"),
    title: "Whale",
    minScale: 10000000,
  }, {
    subtypeCode: 9, // Turtle
    visible: true,
    renderer: turtleUniqueValueRenderer,
    title: "Turtle"
  }]
});
Here is an example demonstrating how we can configure a renderer for each sublayer of the SubtypeGroupLayer.

The symbology in the data I provided is very simple. This sample takes advantage of some web style symbols I published to ArcGIS Online. These symbols will make it easier for us to identify which marine animal corresponds to each feature. This sample utilizes the WebStyleSymbol and sets them as the symbols for the renderer for some of the sublayers.
const webStyleSymbolUrl = "https://arcgis.com/sharing/rest/content/items/beb787401c41401ba1eef6ce161d6664/data";

// create web style symbol from the symbol name
function createMarineSymbol(name) {
  return {
    type: "simple",
    symbol: {
      type: "web-style",  // autocasts as new WebStyleSymbol()
      styleUrl: webStyleSymbolUrl,
      name: name
    }
  }
}
Feel free to download the symbols from here if you would like to bring them into ArcGIS Pro, ArcGIS Online, or Portal as well. If you are new to using web style symbols and would like to know how to publish your own, then click here to read an informative blog post by Russell Roberts.
More features of the SubtypeGroupLayer that we can take advantage of with the JS API
In the previous two examples, we took advantage of the renderer, min/max scales, and visibility properties for each sublayer. Now lets take advantage of the popupTemplate property to configure unique popups per sublayer. All of these features share the same exact attributes, however, we only want to display popups with content that are relevant to each feature. For instance, when we click on a “Whale” type feature, we do not care about the turtle species value from the TURTLE_SPECIES field. It is anyways empty, since this feature is not of type “Turtle”. Therefore, we can create a popup for “Whale” features that does not display this field. The SubtypeGroupLayer allows us to configure these popups rather easily.

We didn’t even talk about how we can configure each sublayer’s labels as well! Fortunately, we have the Intro to SubtypeGroupLayer sample in our documentation, which demonstrates how we can achieve this. This sample uses a Utility Network dataset, so we get to see an example of how the features of the SubtypeGroupLayer work well with utility network data.
Speaking of the utility network, we plan on providing full support for SubtypeGroupLayers with the utility network with the JS API for our next release. To learn more about the utility network features added in this release to the JS API, check out Hussein Nasser’s amazing blog Utility Network is now on ArcGIS JavaScript API 4.20.
Enterprise Deployment Workflow (Update 8-24-2021)
It was brought to my attention that the workflow provided with publishing a SubtypeGroupLayer was not working for some users with an Enterprise deployment. After further investigation, we discovered that it is currently not possible to publish a SubtypeGroupLayer as a hosted feature service in Enterprise. Therefore, users who attempt to publish the SubtypeGroupLayer in Pro from the file geodatabase provided will run into the following error message:

It is possible to publish a SubtypeGroupLayer to Enterprise, however, it must be published as a non-hosted feature service. This means the data needs to come from a registered enterprise geodatabase. For users who are publishing to Enterprise, the MarineLife feature class from the file geodatabase provided must first be copied over into a registered enterprise geodatabase.
Please make sure the registered database you copy the data over to is an enterprise geodatabase. You can tell by going to the Databases in the Catalog and right-clicking the registered database. If you don’t see the “Enable Enterprise Geodatabase” option as highlighted below, then that means it has already been enabled as an enterprise geodatabase, so you don’t have to do anything. Otherwise, if you do see the option, then click on it to enable your database as an enterprise geodatabase.

This will be part of Step 1 in the workflow outlined above. The rest of the steps to create and publish the SubtypeGroupLayer should be followed in the same order.
Conclusion
Hopefully this post helps you better understand what exactly a SubtypeGroupLayer is, what key features it brings, and how you can use it in your own applications.
If you would like to play around with the sample apps provided and take a look at the code yourself, you can find them on Github:


Commenting is not enabled for this article.