Hello web developers! Another release of the ArcGIS API for JavaScript is out the door and we’re excited for you to check it out. This release introduces features such as WFS support and a shadow analysis widget, as well as many smaller but effective enhancements that will help you to build a great experience for your end users. Developers working in the Utilities industry will be happy to hear that we’re making progress on bringing utility networks to the JavaScript API. Read on to learn about highlights in 4.20…
WFSLayer
The WFSLayer allows you to visualize features from an OGC Web Feature Service (WFS), the precursor to OGC API – Features. This new layer type offers the same level of capabilities as other feature layers in the API with a consistent programming pattern.
WFSLayer supports WFS 2.0.0 with GeoJSON for maximum performance. It comes with a utility module to help browse the WFS service.
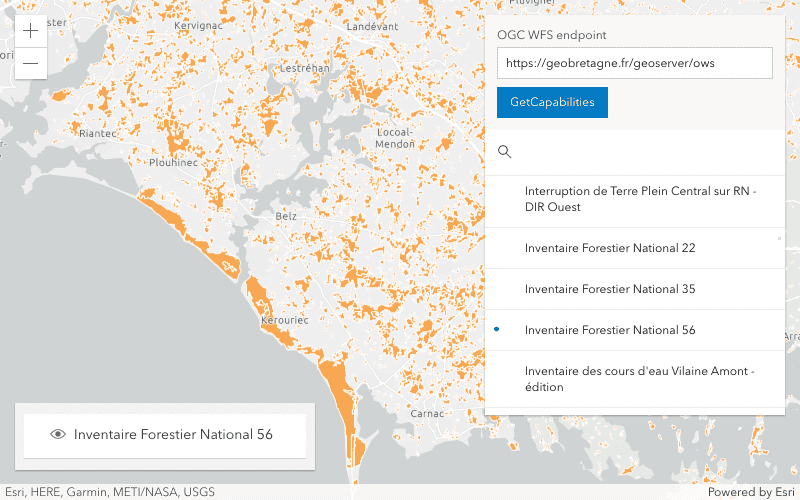
Other OGC improvements include the ability to save an OGCFeatureLayer in a web map, and support for time dimensions in WMS layers.
Shadow accumulation widget
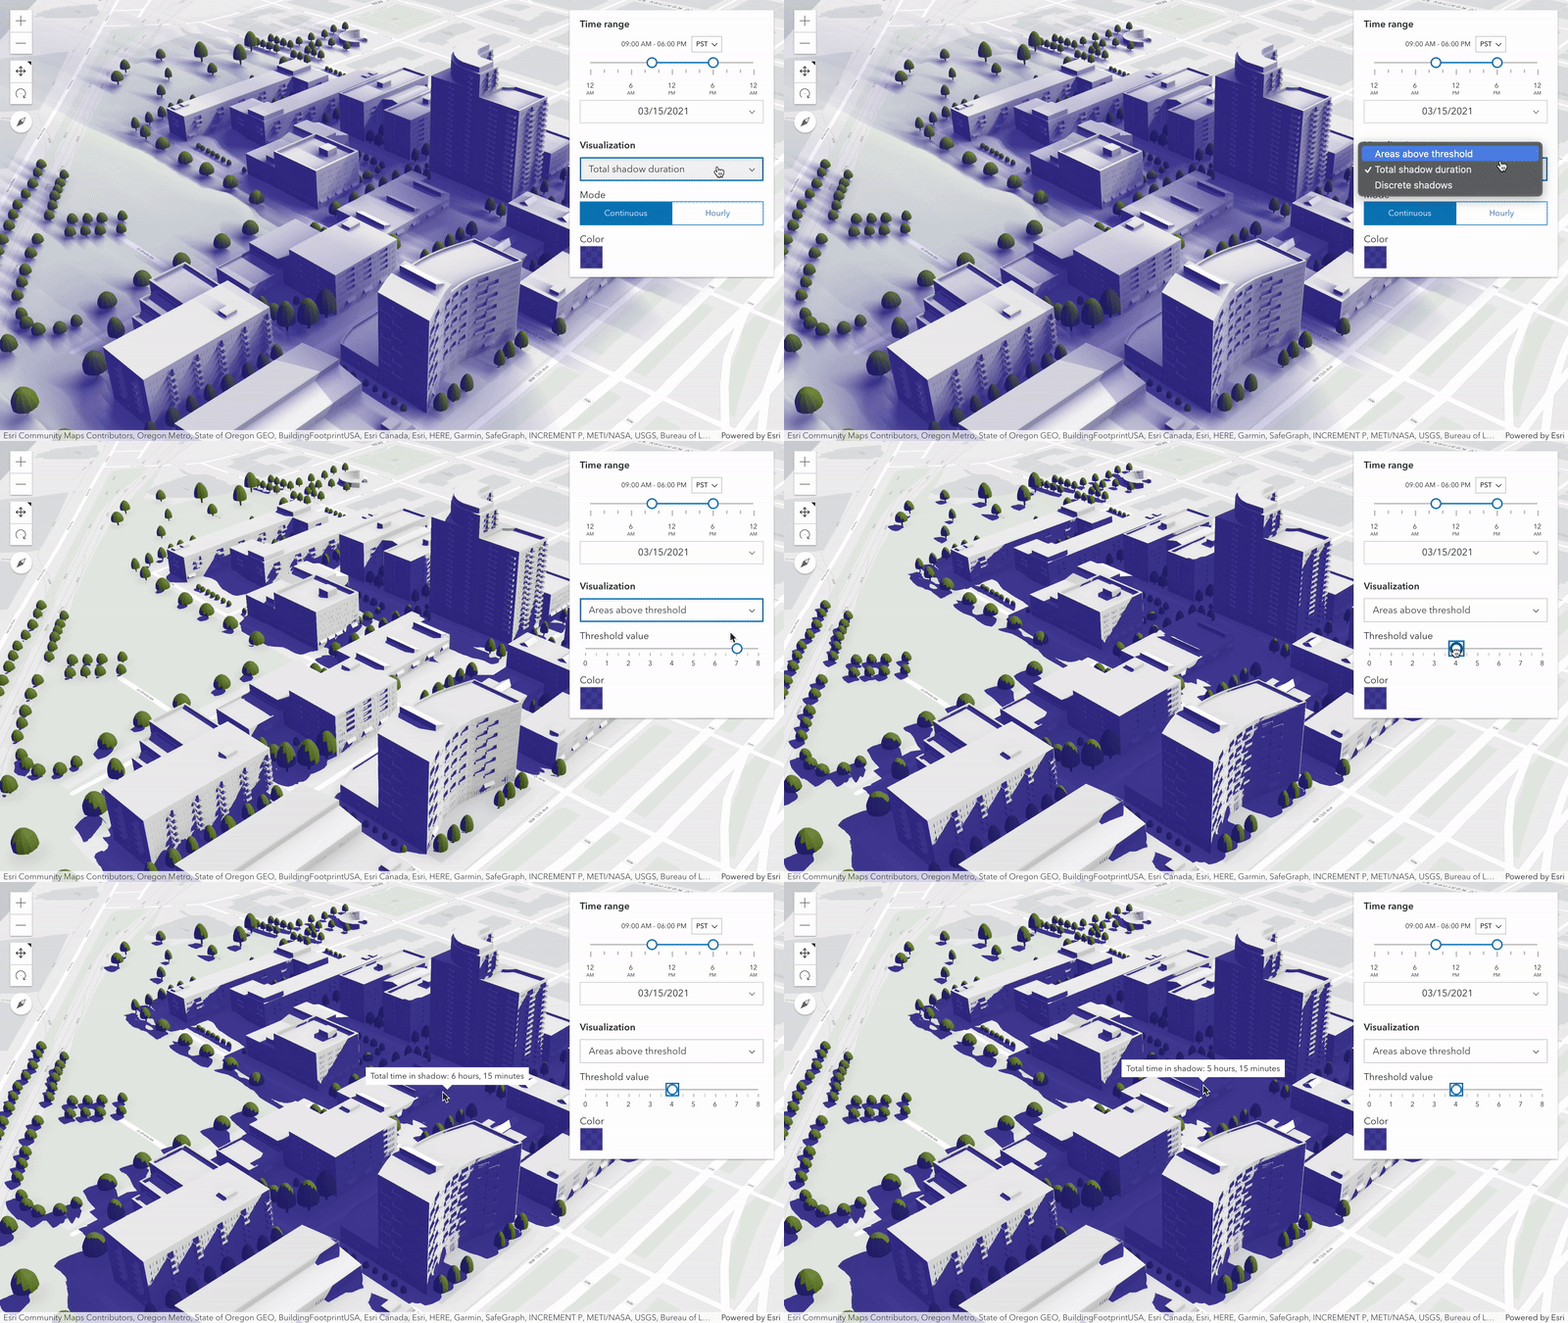
The ShadowAccumulation widget allows you to analyze the total shadow duration from buildings and other 3D objects in your scene for any time range and date. Analysis options like thresholds help to quickly assess if a scene complies with urban shadow impact regulations.
Edge offset
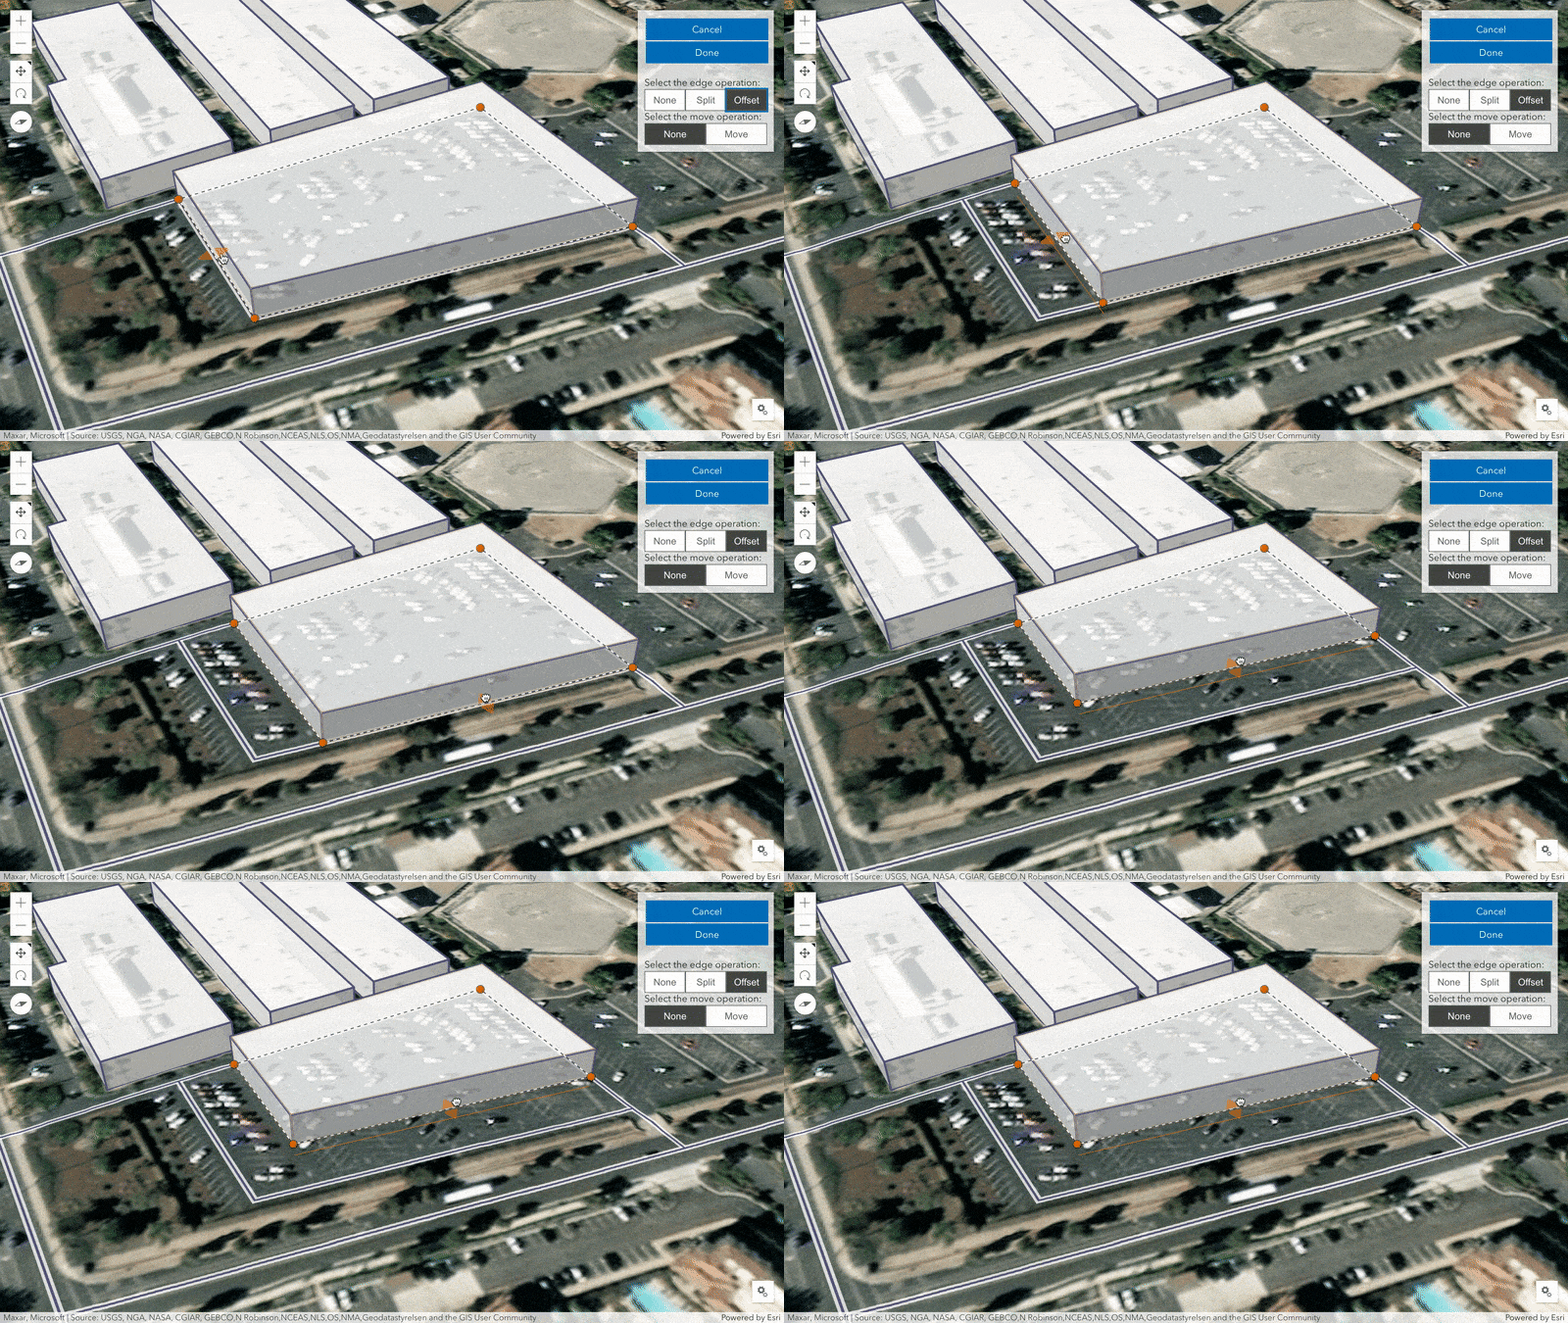
Horizontally push and pull edges of lines and polygons while maintaining the shape of the geometry using the enhanced SketchViewModel.
Analysis layers (beta)
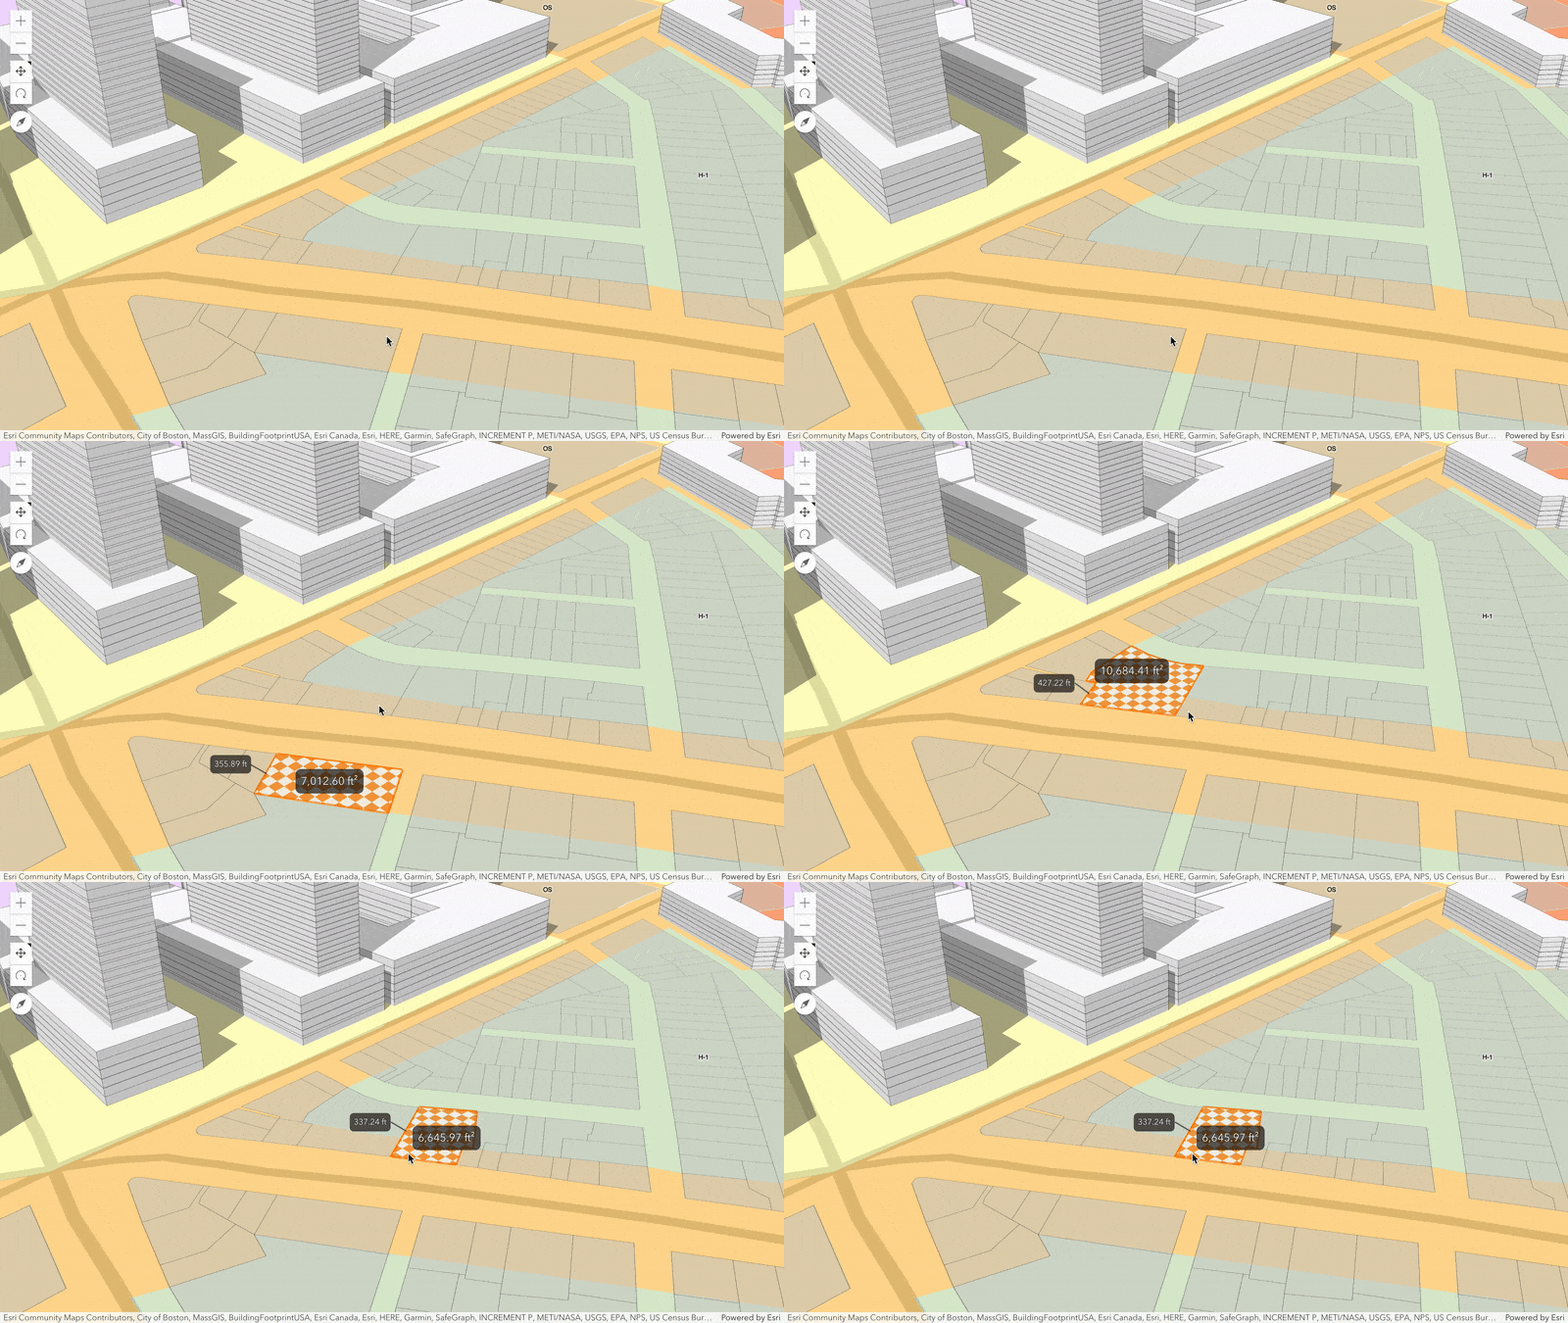
Analysis layers are a new concept that will allow you to use API tools such as measurement programmatically (without displaying the widgets). You can implement this either using your existing data or results from user interaction as the input to your analysis. In the initial phase of this project, you can create custom analysis experiences in 3D scenes by programmatically providing the measurement points and then displaying them using the DirectLineMeasurementLayer and AreaMeasurementLayer.
In future releases, we will add 2D support, more analytical tools, and the ability to persist the results to web maps and web scenes.
Feature table & scene layers
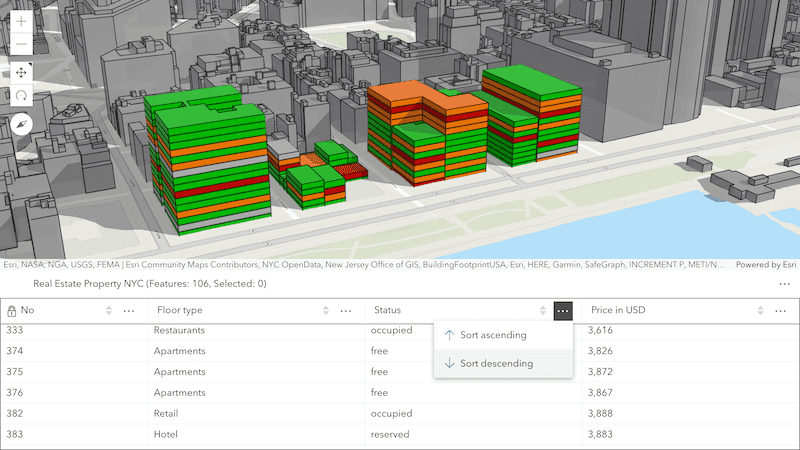
The feature table widget now supports scene layers. Interactively view and edit features from a scene layer in a tabular view, just as you would with feature layers. The widget requires a scene layer with an associated feature layer.
Utility network
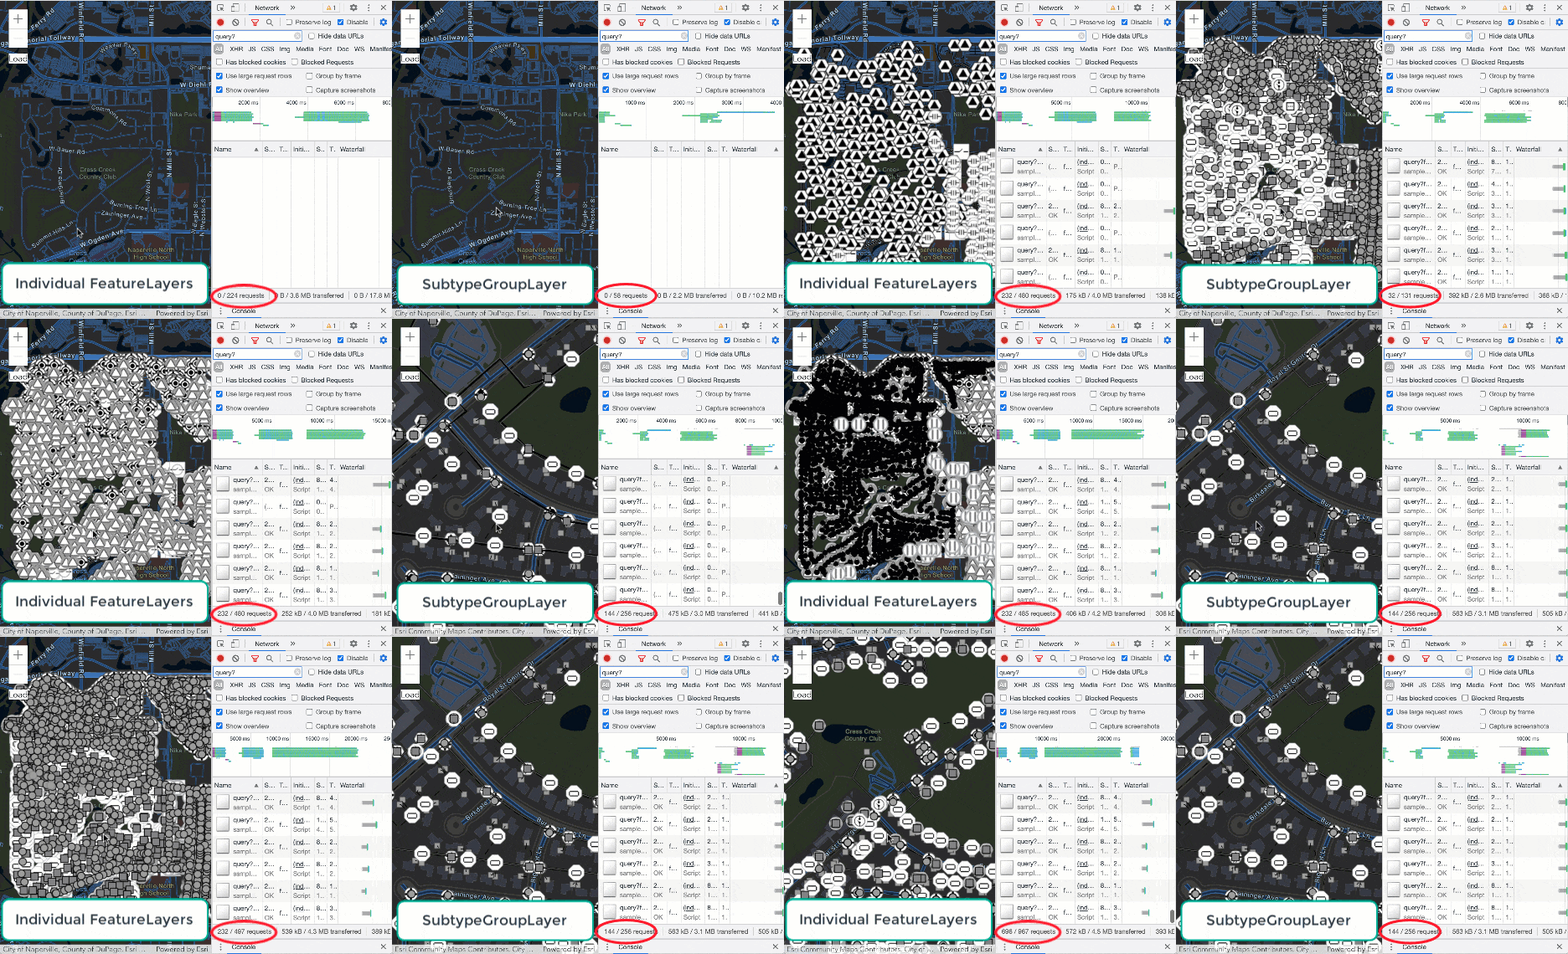
Over the next couple of releases, we will be working on a multi-phase project to add support for the utility network. In this release, we implemented the first phase which added support for the subtype group layer and simple network tracing. The subsequent phases will be implemented over the coming releases and will add support for more complete tracing, subnetwork management, and advanced editing.
rest modules
The API’s rest modules make it easier to incorporate functionality into a more modular app design and also reduce unnecessary dependencies since you only import what you need. In this release, we finished porting the Task and related support classes (now deprecated) to rest modules.
The rest modules are simply functions so you can use their methods immediately. Also, because of the more modular design, you can import just one or more methods of a rest module instead of having to import the whole module. This speeds up the build time, and makes code more focused.
For example, the deprecated QueryTask is used like this:
import QueryTask from "esri/tasks/QueryTask";
const task = new QueryTask({
    url: "service url"
});
task.execute(new Query(...));
Using the new query module:
import { execute } from "esri/rest/query";
execute("service url", new Query());
API keys
Over the past couple of releases, we added support for a global API key (4.18) to use with Location Services and fine-grained support for directions & routing (4.19). Version 4.20 builds on top of this by adding the ability to set API keys for individual layers, giving you more fine-grained control over the key used for a particular layer.
More powerful queries
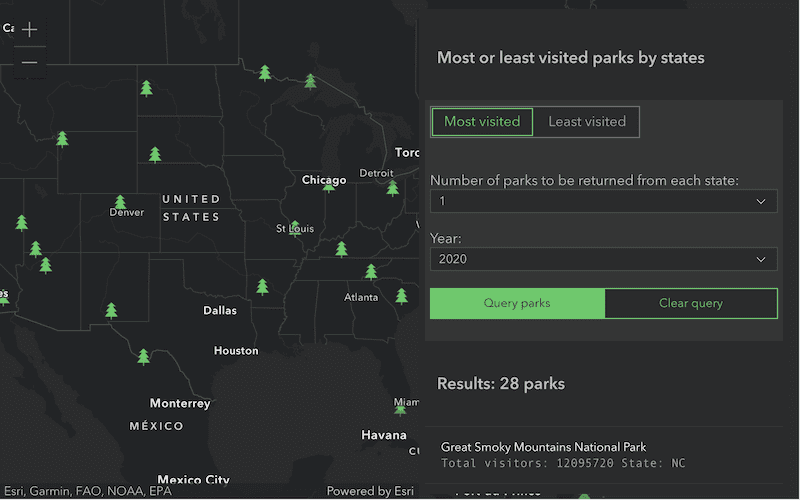
Taking advantage of the relational database behind feature layers hosted by ArcGIS Online and ArcGIS Enterprise, we are introducing more advanced querying capabilities. Prior to this release, you could group and order query results. However, when grouping, results were limited to a single aggregated value for each group. The new query capabilities give you more access to individual rows within groups. For example, you could group national parks of the United States by the state where they reside, order them based on visitation, and then return the first three most visited park in each state.
Vector tile layer styles & performance
At this release, we added a support for dashed lines and data-driven line and fill patterns for vector tile layers. We have also improved performance of vector tiles when panning.
Imagery layer profiling
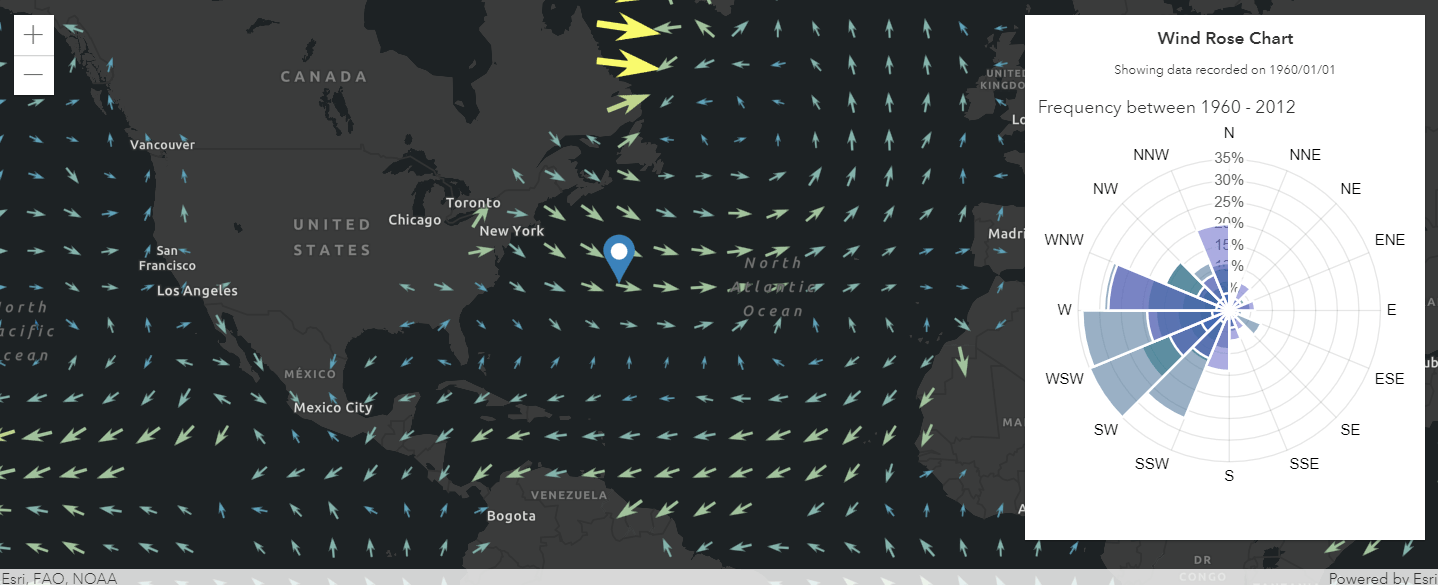
We added getSamples() method for imagery layers, which allows you to profile your imagery in a multi-dimensional space, for example, when creating a wind rose plot or doing time/depth series charting. getSamples() will return sample point locations, pixel values, and corresponding resolutions of the source data for a given geometry.
Editor and Sketch widgets – point snapping
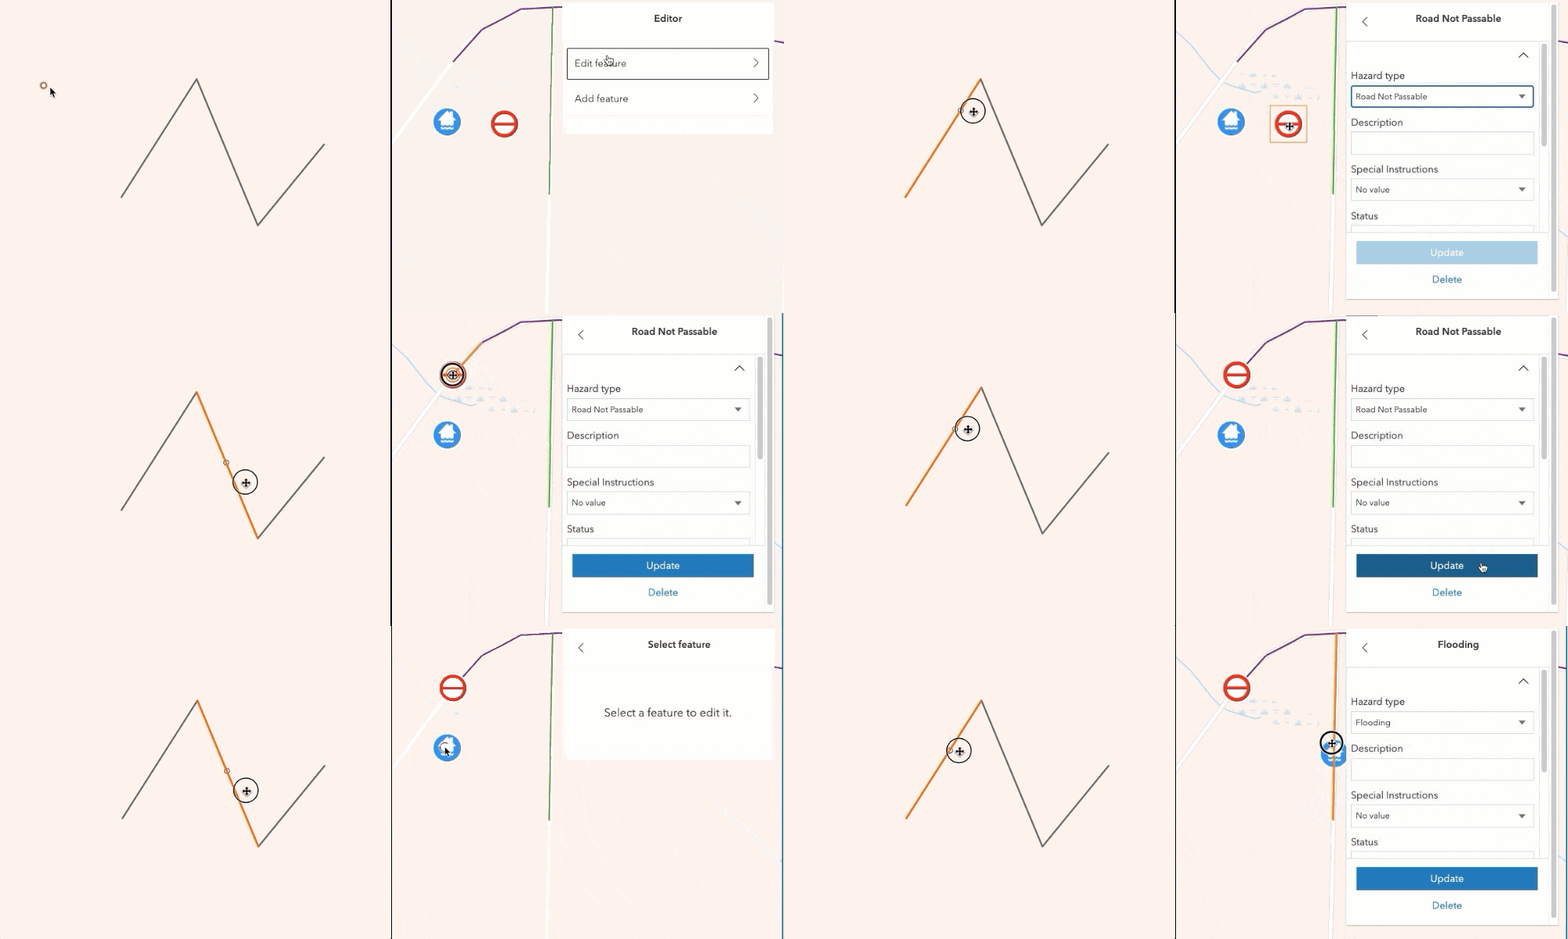
Snapping is now available when moving 2D point geometries in both the Editor and Sketch widgets.
Increased zoom limits
It is now possible to increase the max zoom level on the map with the addition of the numLODs parameter on TileInfo.create().
Don’t miss these samples
While many new samples are added with each release to demonstrate new capabilities, we also add samples that show a different aspect of features introduced in past releases. For example, here are two of the new samples we added this release:
ES modules – using web workers: There is a new ES modules sample showing how to integrate custom web workers to improve application performance. The sample uses the APIs workers module to simplify the use of workers within your application. Web workers let you perform computationally expensive tasks, such as spatial joins, on a background thread to prevent blocking or slowing down the user interface (UI).
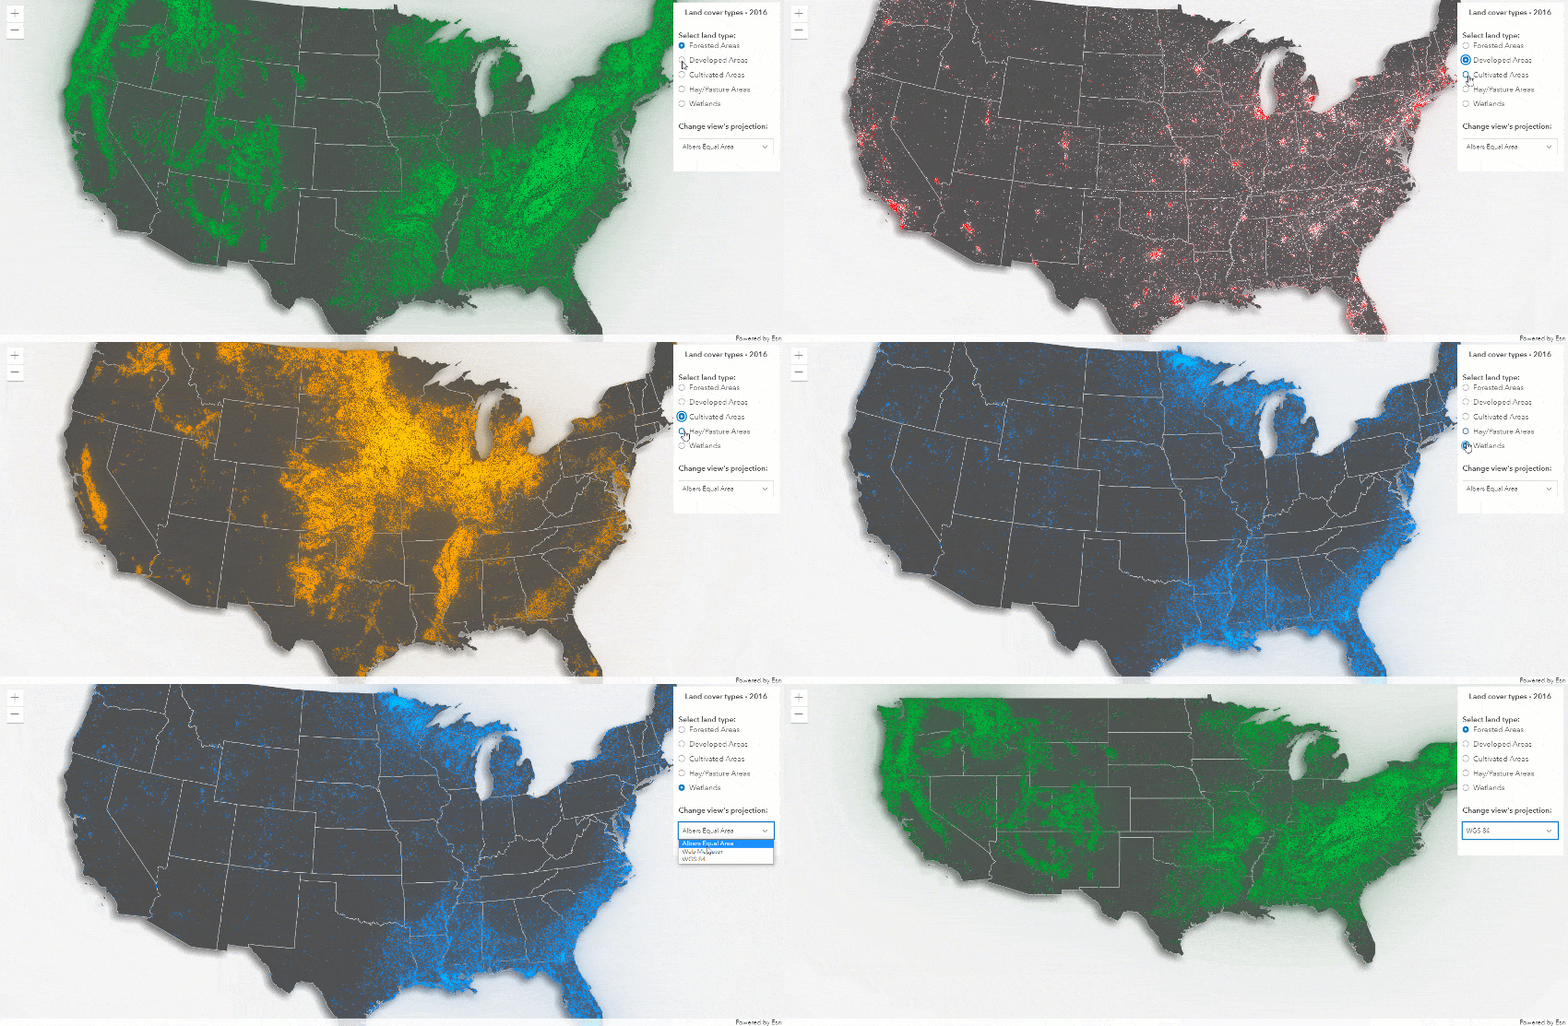
Hosted tiled imagery layers: This sample shows you how you can dynamically change the rendering and projection of a tiled imagery layer on the fly.
Learn more
There are many more improvements, such as:
- Elevation profile enhancements
- General widget updates, including a visible property for all widgets as well as a property to change the heading level in widgets (useful when building an app that meets accessibility standards).
- Updates to the applyEdits() method to support making edits across multiple layers or tables in a single call.
Review the release notes for a full overview of the release, or play with the new samples to take it for a test drive.
Note: The downloads for version 4.20 of the API and the SDK will be available on July 21st. Dojo will no longer be included as part of our API downloads because the API no longer uses it (as of version 4.18).


Hi Julie,
Regarding the Note:
Could you please give a little more detail as to what are the modules/components of the API that were impacted.
Thank you.