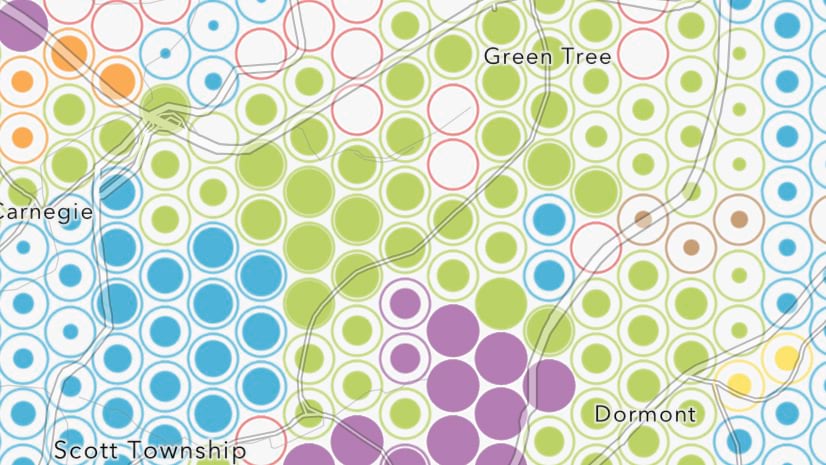
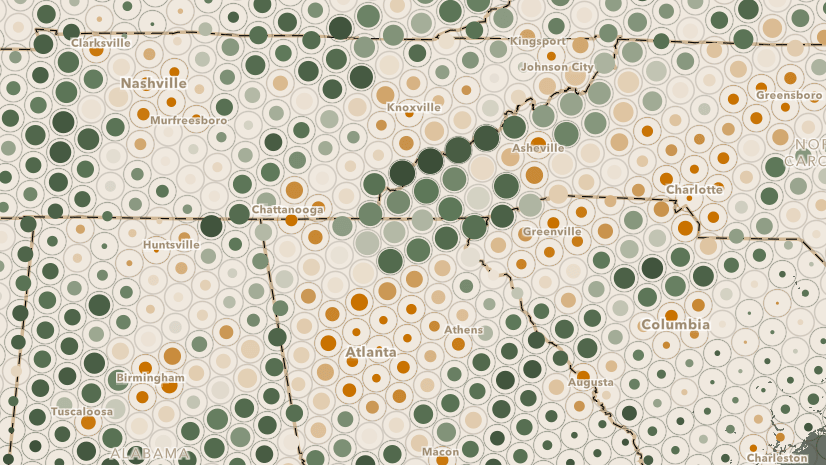
More than 50 years ago, Richard Saul Wurman introduced an innovative cartographic style for visualizing population density. He and his graduate students described the symbology as “spots and dots”. At Esri, we consider this a theme named reference size within our existing size style. This theme is defined by a grid of evenly-sized circular cells that are proportionally filled based on a numeric value, such as population.
The map below from 1967 is one example of how Wurman used this style to visualize population density.

While this is an effective way to visualize density, it is not commonly used, probably because it has been historically difficult to create. However, the recent introduction of client-side binning in the ArcGIS Maps SDK for JavaScript (ArcGIS JS SDK) makes it easier to create this style for point layers without data preprocessing.
How the reference size theme works
The reference size symbol visualizes a single cell in a geographic grid. Each symbol is composed of two parts: an outside ring of fixed size, and an inner circle (or dot) whose size varies dynamically based on a data variable.

This theme works well for a few of reasons:
- The outer ring creates a boundary or limit that communicates the absolute data maximum. This is effective for visualizing percentages and bounded totals, which also means…
- Symbols can’t overlap, making the data easier to comprehend.
- This technique clearly distinguishes between 0% (single outer ring only) and no data (no ring whatsoever)

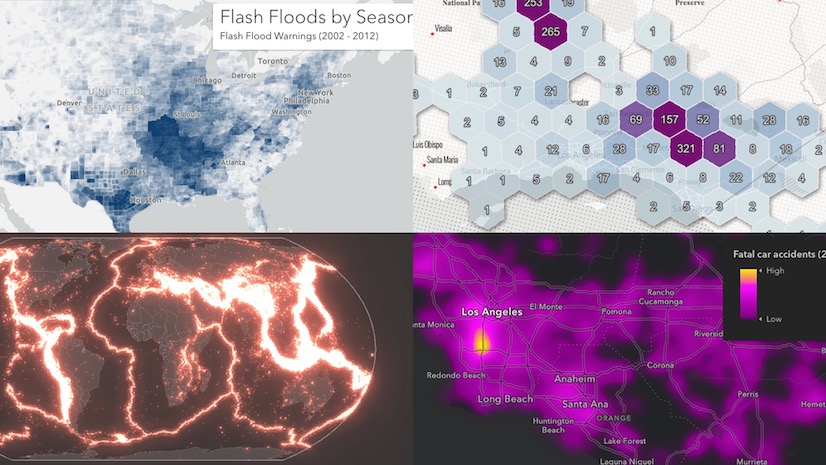
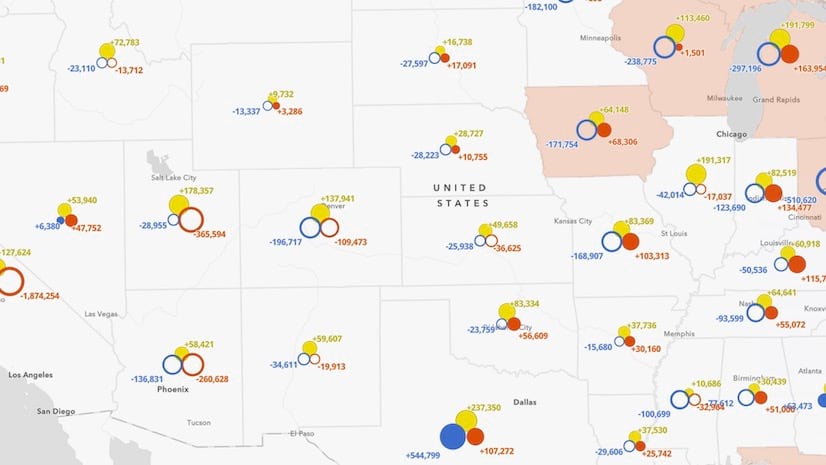
The drawback to the reference size theme is that it isn’t ideal for visualizing proportions and outliers. For example, the map below is better at showing blocks in Dallas with a significantly higher population than most. Sometimes, the outliers are the focus and story of a map.

However, proportional symbols with dense datasets only work well in a narrow visible scale range. Zooming out just a couple of levels causes symbols to overlap, making the map too cluttered.

That’s why aggregation techniques like binning are important. Binning with the reference size theme applied helps users digest detailed, dense datasets at small map scales (when zoomed out). The visualization technique you choose depends largely on the density of your data and the scale at which you view it.
Reference size can work together with proportional symbols
So which technique is better? Reference size or proportional symbols?
This animation shows how the web allows you to leverage the best of both worlds. The reference size theme is used in the binning renderer to summarize density at small scales. Proportional symbols visualize individual points at large scales.
All valid scales are considered.

Why binning improves the experience for creating reference size visualizations
A few years ago, Jennifer Bell demonstrated how you can create this style using a CIM symbol in the ArcGIS JS API. Her article describes how you can create a spatial grid using the Generate Tesselations tool in ArcGIS Online to create a grid of evenly-spaced polygons. You then enrich the grid with the data you wish to map. That process is still valid, and I encourage you to check out the Create a reference size visualization JS SDK sample.
While the ArcGIS Online analysis tools are a great way to create an enriched spatial grid, they can be time-consuming to run. They also return new layers that are disconnected from the underlying point data. This step alone can be a barrier to anyone wanting to try a reference size visualization.
Client-side binning in the ArcGIS JS SDK and ArcGIS Online removes the necessity to preprocess data. If you have a point layer you’d like to visualize as a density, then you can create a polygon grid without having to create a new layer or feature service.
How to create a reference size visualization for binning
A reference size visualization is created in three phases:
- Enable binning
- Create a reference size symbol
- Write Arcade expressions to control the sizes of the reference size symbol layers
1. Enable binning
First, enable binning on your point layer and assign it a simple renderer so you can see the grid. At a minimum, you should set a fixedBinLevel, appropriate for the scale at which you would like to summarize the data, and define an aggregate field that returns the count or number of points contained by the bin. The article Binning now available in the ArcGIS API for JavaScript introduces binning in the ArcGIS JS API and the various options you can control in a binning visualization.
const featureReduction = {
  type: "binning",
  fixedBinLevel: 6,
  fields: [
    new AggregateField({
      name: "aggregateCount",
      statisticType: "count"
    })
  ],
  // renderer creating the reference size theme
  // will eventually be defined here
  renderer: {
    type: "simple",
    symbol: {
      type: "simple-fill"
    }
  }
};
 binned at a city scale.")
2. Create a reference size symbol
A reference size symbol consists of two symbol layers: a hollow outer ring (not an outline) and an inner dot. We must define this symbol using a CIMSymbol. CIM allows us to define complex symbols with multiple layers, whose properties can be overridden using data values.
I won’t show the entire CIMSymbol used in the final app (you can view that here), but here’s the general structure to follow. Note the geometry for the first and second symbol layer is the same. It is the symbol representing each symbol layer that is different.
featureReduction.renderer = {
  type: "simple",
  symbol: {
    type: "cim",
    data: {
      type: "CIMSymbolReference",
      symbol: {
        type: "CIMPointSymbol",
        symbolLayers: [
          {
            type: "CIMVectorMarker",
            primitiveName: "innerDot",
            markerGraphics: [
              {
                type: "CIMMarkerGraphic",
                geometry: { /* Geometry definition of a circle */ },
                symbol: { /* Solid fill */ }
              }
            ]
          },
          {
            type: "CIMVectorMarker",
            primitiveName: "outerRing",
            markerGraphics: [
              {
                type: "CIMMarkerGraphic",
                geometry: { /* Geometry definition of a circle */ },
                symbol: { /* Hollow fill with outline */ }
              }
            ]
          }
        ]
      },
      primitiveOverrides: [
        {
          type: "CIMPrimitiveOverride",
          // Name of the primitive (symbol layer to modify)
          primitiveName: "outerRing",
          // The symbol property to vary by expression
          propertyName: "Size",
          // Defines the Arcade expression that returns a
          // size based on a scale value
          valueExpressionInfo: { }
        },
        {
          type: "CIMPrimitiveOverride",
          primitiveName: "innerDot",
          propertyName: "Size",
          valueExpressionInfo: { }
        }
      ]
    }
  }
};
 binned at a city scale. Each bin is represented with a reference size symbol. However, the symbols aren't data-driven.")
Now we have the correct symbol. The only remaining task is to vary the inner dot sizes based on a data attribute.
3. Write Arcade expressions to control the sizes of the reference size symbol layers
The symbols as defined in the previous step are defined with fixed sizes. Apart from there being no data-driven component to the visualization, fixed sizes are problematic as illustrated below.
When zoomed out, the symbols begin to overlap and turn into an unintelligible mess. This happens because symbols are at a fixed size in screen space (i.e. pixels). As the user zooms out, each pixel represents larger and larger real world areas, causing symbols to overlap.

Conversely, when zoomed in, huge gaps begin to appear between the bins, making them appear very small and unrepresentative of the bin’s geographic boundary. Zooming in results in each pixel representing smaller real world areas.

Therefore, we need to define Arcade expressions within primitive overrides to control the size of both the outer ring and inner dot by scale. You can think of a primitive as a symbol layer. To override a visual component of a symbol layer, you must give the symbol layer an identifier in the primitiveName property. That name is then referenced in the primitive override object.

Here’s how the primitive override for determining the “fixed” size of the outer ring looks. Pay special attention to the Arcade expression, which must return a number representing the size of the ring in points. Note how the initial view scale becomes a reference scale for scaling the size of the ring in screen space.
featureReduction.renderer = {
  type: "simple",
  symbol: {
    type: "cim",
    data: {
      type: "CIMSymbolReference",
      symbol: {
        type: "CIMPointSymbol",
        symbolLayers: [
          // symbol layer definitions here
          // one for outerRing
          // one for innerDot
        ]
      },
      primitiveOverrides: [
        {
          type: "CIMPrimitiveOverride",
          // Name of the primitive (symbol layer to modify)
          primitiveName: "outerRing",
          // The symbol property to vary by expression
          propertyName: "Size",
          valueExpressionInfo: {
            type: "CIMExpressionInfo",
            title: "Size in pixels of outer ring at maxScale",
            // The Arcade expression used to vary symbol size
            // by scale. This should return a result in pixels
            expression: `
              var binWidthMeters = 800;  // bin width in meters at level 6
              var viewResolution = 38;  // meters per pixel
              var initialViewScale = 144447;
              var binWidthPixels = binWidthMeters / viewResolution;
              return (binWidthPixels * (initialViewScale / $view.scale)) * 0.75;
            `,
            returnType: "Default"
          }
        }
      ]
    }
  }
};
In contrast, the expression for changing the size of the inner dot must take into account a data value and the view scale. We’ll cover that process in the case studies below.
Case study: New York City motor vehicle crashes
In the year 2020, New York City had a reported 103,804 motor vehicle accidents. Each crash location is visualized in the map below.

Drawing more than 100,000 points on a map at this scale makes it difficult to understand the relative density of crashes in the city. About the only thing I can really see in this map is the city boundary of New York and some open spaces, like Central Park. Aggregating points to geographic bins and visualizing them with the reference size theme can help us better understand the spatial patterns that exist in the data.
Let’s explore a few examples.
Density of crashes
The following map shows the density of motor vehicle crashes based on the aggregate count of crashes within each bin. The outer ring represents a maximum value of 300 crashes. Therefore, a fully filled bin indicates more than 300 crashes occurred in that area. Sizes are proportional to the number of crashes.
Using a bounded total count makes this a great way to visualize density.
. The reference size theme helps us easily see where more crashes occur.")
Here’s what the primitive override looks like for the inner dot in this example.
featureReduction.renderer = {
  type: "simple",
  symbol: {
    type: "cim",
    data: {
      type: "CIMSymbolReference",
      symbol: {
        type: "CIMPointSymbol",
        symbolLayers: [
          // symbol layer definitions here
          // one for outerRing
          // one for innerDot
        ]
      },
      primitiveOverrides: [
        {
          type: "CIMPrimitiveOverride",
          primitiveName: "innerDot",
          propertyName: "Size",
          valueExpressionInfo: {
            type: "CIMExpressionInfo",
            title: "Size in pixels of inner ring at maxScale",
            // outerSize is the pixel size at the largest scale
            // The innerSize is determined by multiplying
            // the outerSize by the total count
            expression: `
              var binWidthMeters = 800;  // bin width in meters at level 6
              var viewResolution = 38;  // meters per pixel
              var initialViewScale = 144447;
              var binWidthPixels = binWidthMeters / viewResolution;
              var value = $feature.aggregateCount / 300;
              // 300 establishes the upper bound or
              // data value representing the outer ring.

              var innerRatio = IIF(value > 1, 1, value);
              var outerSize = binWidthPixels * (initialViewScale / $view.scale);
              var innerSize = outerSize * innerRatio;
              return IIF( innerSize < 3, 3, innerSize ) * 0.75;
              // 0.75 pixels to points (size unit of CIM)
            `,
            returnType: "Default"
          }
        }
      ]
    }
  }
};
Crashes with injuries
The outer ring of the reference size symbol provides a reference point to some kind of maximum value. That’s why it is ideal for representing a percentage or even a ratio. As opposed to proportional symbols, the reference size symbol clearly communicates whether a feature’s attribute value is at 100% or some percentage less than that.
In this example, I’m visualizing the number of injuries as a ratio to the number of crashes in a bin. If there is a 1:1 ratio (or higher of injuries to crashes), then the circle will be completely filled, indicating areas where each crash is more likely to result in injury.
. The reference size theme is an ideal way to represent ratios and percentages.")
Here’s what the primitive override looks like for the inner dot in this example.
featureReduction.renderer = {
  type: "simple",
  symbol: {
    type: "cim",
    data: {
      type: "CIMSymbolReference",
      symbol: {
        type: "CIMPointSymbol",
        symbolLayers: [
          // symbol layer definitions here
          // one for outerRing
          // one for innerDot
        ]
      },
      primitiveOverrides: [
        {
          type: "CIMPrimitiveOverride",
          primitiveName: "innerDot",
          propertyName: "Size",
          valueExpressionInfo: {
            type: "CIMExpressionInfo",
            title: "Size in pixels of inner ring at maxScale",
            // outerSize is the pixel size at the largest scale
            // The innerSize is determined by multiplying
            // the outerSize by the ratio of injuries to crashes
            expression: `
              var binWidthMeters = 800;  // bin width in meters at level 6
              var viewResolution = 38;  // meters per pixel
              var initialViewScale = 144447;
              var binWidthPixels = binWidthMeters / viewResolution;

              // AVG_MOTORIST_INJURED is an aggregate field defined in the binning configuration
              var innerRatio = IIF($feature.AVG_MOTORIST_INJURED > 1, 1, $feature.AVG_MOTORIST_INJURED);
              var outerSize = binWidthPixels * (initialViewScale / $view.scale);
              var innerSize = outerSize * innerRatio;
              return innerSize * 0.75;
            `,
            returnType: "Default"
          }
        }
      ]
    }
  }
};
A bivariate example: density and injuries
You can also apply a second visual variable to a reference size visualization, such as data-driven color. In the legend below, the size of the inner dot represents the density of crashes, whereas the color represents the ratio of injuries to crashes.

The bivariate nature of this visualization can help you clearly see a geographic pattern of where areas with a high density of crashes also have a high propensity for injury. This visualization removes the noise that creeps in when visualizing percentages; sometimes areas have an unusually high percentage of an attribute because they represent a small sample size where a high degree of variation is more likely. For example, a bin with only one crash and one injury would appear very important in the previous example when it probably shouldn’t be.
 visualized with reference size. Color is used to visualize areas where crashes resulted in a higher number of injuries.")
You can simply add a color visual variable to the renderer (completely separate from the CIMSymbol), to add a second variable to the reference size visualization.
featureReduction.renderer = {
  type: "simple",
  symbol: {
    type: "cim",
    // CIM symbol definition used in the "Density of crashes" example above
  },
  visualVariables: [
    {
      type: "color",
      field: "AVG_MOTORIST_INJURED",
      legendOptions: {
        title: "Ratio of motorists injured per crash"
      },
      stops: [
        { value: 0, color: "#feebe2" },
        { value: 0.15, color: "#fbb4b9" },
        { value: 0.25, color: "#f768a1" },
        { value: 0.33, color: "#c51b8a" },
        { value: 0.5, color: "#7a0177" }
      ]
    }
  ]
};
Conclusion
Binning significantly improves the work required to create reference size visualizations. Specifically, binning removes the necessity to preprocess data or create derived datasets. As illustrated above, binning with the reference size theme requires a familiarity with CIM symbology and Arcade scripting. We recognize this and, as such, are working to introduce a Smart Mapping function in a future release to make this process easier.

Article Discussion: