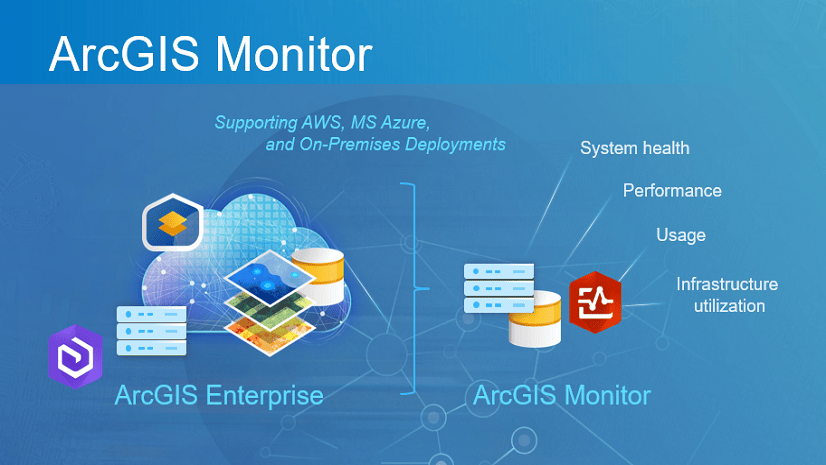
ArcGIS Monitor complements ArcGIS Enterprise by providing holistic monitoring of its components and underlying infrastructure. Monitor collects data metrics on an enterprise GIS deployment and provides alerting, notifications, and reporting capabilities. It helps GIS managers and administrators ensure their enterprise GIS is working efficiently and can reduce and prevent system downtime.
We’re pleased to announce the release of ArcGIS Monitor 2023.3 for the December holiday season!! It includes many enhancements that will help with proactively managing an enterprise GIS deployment.
Summary of what’s new
- Monitoring for hosted feature services
- Serial chart enhancements
- Improved Alert rule configuration experience
- Updated component status indicators
UPDATE: ArcGIS Monitor 2023.3.1 was released on Jan 30, 2024. It contains several bug fixes found in the 2023.3 release.
Monitoring for hosted feature services
One of the most requested feature enhancements for ArcGIS Monitor is support for collecting metrics on hosted feature services. In this release, when registering an ArcGIS Server component that serves as a hosting server with Monitor, its associated hosted feature services will be discovered and registered.
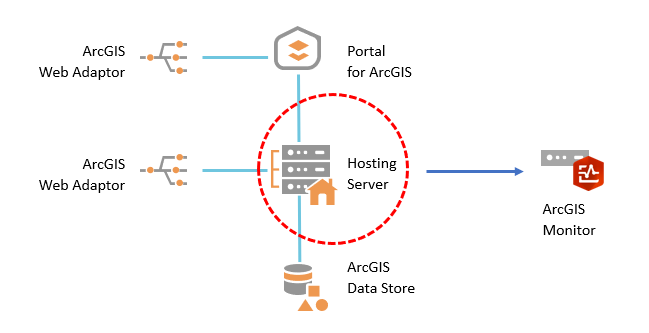
Figure 1: Registering a hosting server with ArcGIS Monitor will also register its hosted feature services
ArcGIS Monitor will collect the same metrics for hosted feature services as for referenced feature services, except for two properties: i) average instances used and ii) instance saturation percent, as these are not applicable. These two properties will not appear in Monitor for hosted feature services.
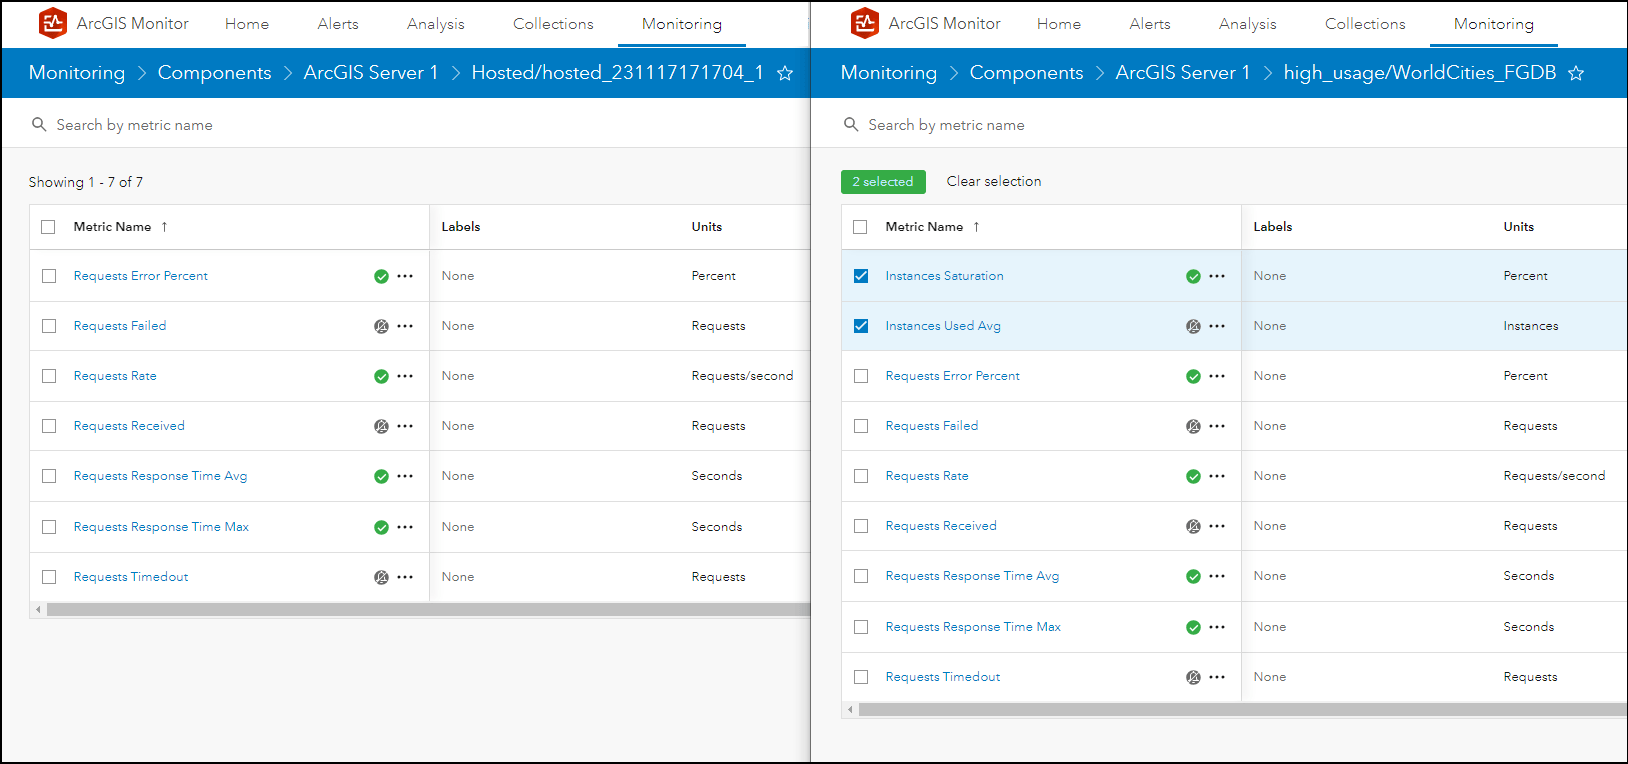
Figure 2: Comparison of reported metrics hosted vs referenced feature services
To determine if a registered feature service in Monitor is hosted or referenced, under the Monitoring tab > view the service’s overview page. On the left side of the page, under Status > Specifications > the Instance Type property will show if the feature service is hosted (instance type = hosted) or referenced (instance type = dedicated or shared). For hosted feature services, their Instance Limits property will also display as 0 min – 0 max.
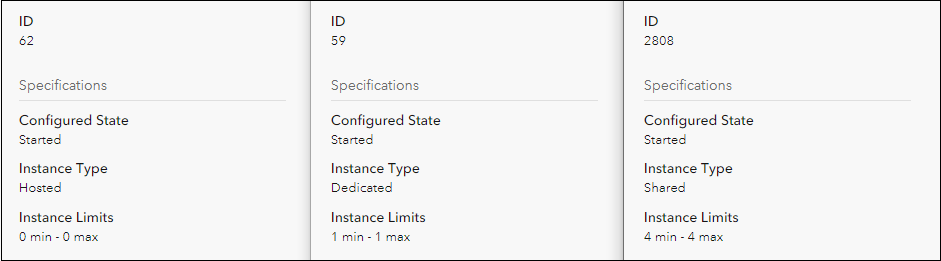
Figure 3: Service overview page comparison hosted vs referenced (dedicated and shared) feature services
Lastly, when viewing the overview metrics page for a selected hosted feature service, the Instances Saturation (%) chart will display with “no data available” and this is expected. Collecting metrics for hosted feature services is only available for hosting servers at ArcGIS Enterprise 11.1 and higher, because the ability to query for these metrics were only enabled at the Enterprise 11.1 release.
Side note: Component ID values are now displayed on a component’s overview page on the left side under Status > General, see graphic above. Component ID values can also optionally be displayed as a column on the Components table under the Monitoring tab. Easily finding a component’s ID can help with defining data expressions for Collections and Analysis view elements.
Serial Chart enhancements
Several improvements have been made to displaying data in serial charts in Analysis views. Series data can now be sorted in either descending or ascending order based on the values of the metric displayed. In other words, you can show the “top” or “bottom” series data values. For example, a data expression could query for the average response time of services, then sorted to present the top or bottom items reported.
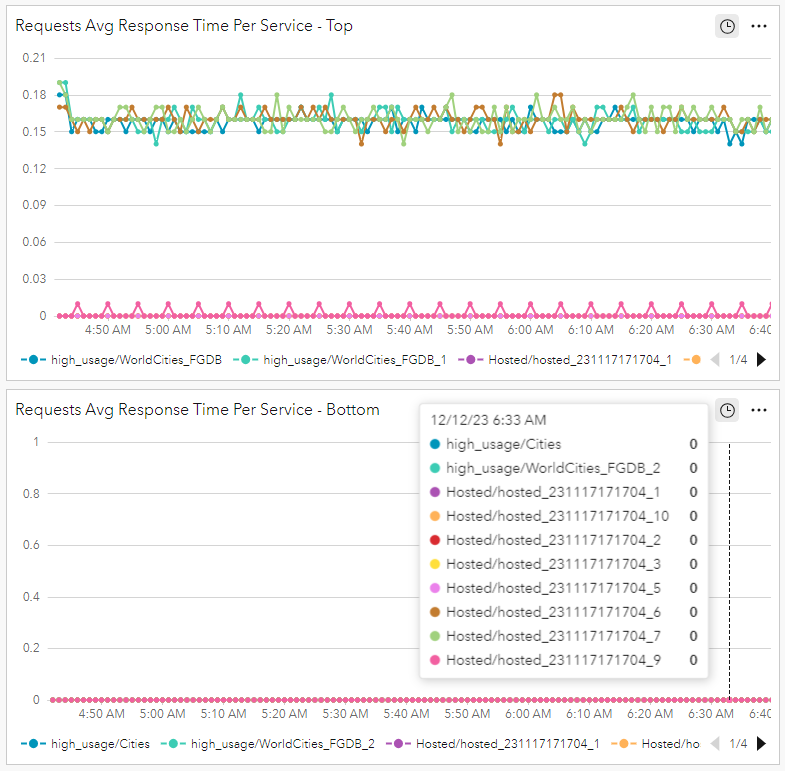
Figure 4: Serial charts showing average response time of requests for services, in descending and ascending order, respectively
Some new formatting options have also been added: series data can be labeled based on an attribute, and the total number of series displayed in a serial chart can be specified, from 1 to 10 series. This helps control the amount of data displayed; instead of viewing too many overlapping series data which can make the chart unclear. Adjusting the previous serial charts to only display 3 series data yields the following result:
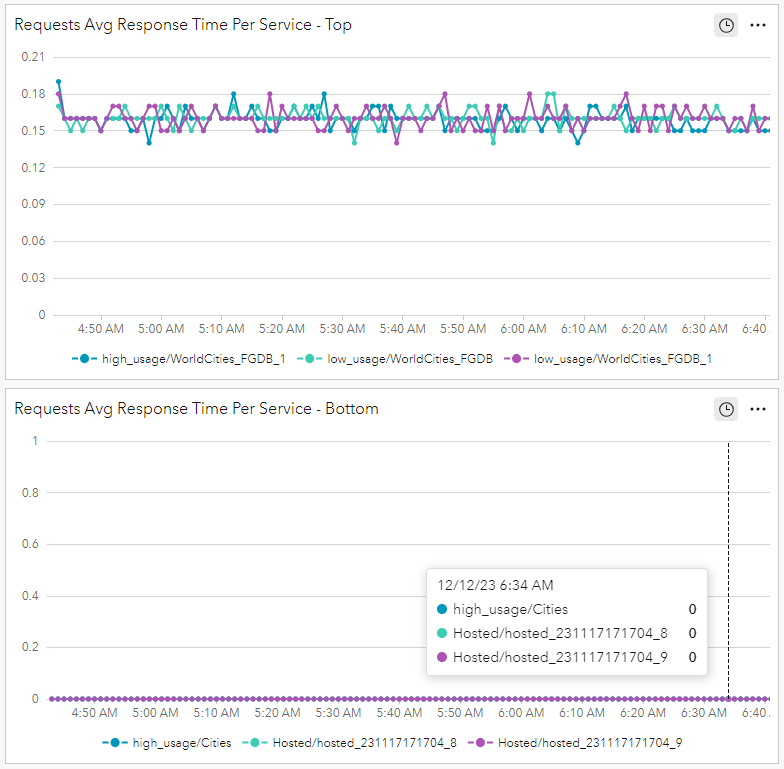
Figure 5: Serial charts showing average response time of requests for services, the top and bottom 3, respectively
The charts in Figure 5 show the 3 services with the highest (descending) and lowest (ascending) average response time of requests. These new serial chart capabilities provides GIS managers and administrators more flexibility to configure reported metrics in Analysis views.
Improved Alert rule configuration experience
Several enhancements have been made to provide a better user experience for configuring alert rules. Under the Monitoring tab, a new Metrics page has been added. This displays metrics for all registered components with Monitor, you can select the same metrics for different components and configure their alert rules in bulk. For example, you could select CPU Utilized for two different host machines, then click the Edit alert rules button. This displays the Edit Alert Rules dialog where the current reported data for the metric are shown and you have the option to configure alert rules for each individual component or batch edit all selected components. This can help save time when you want to assign similar alert rules for the same metric for different components.
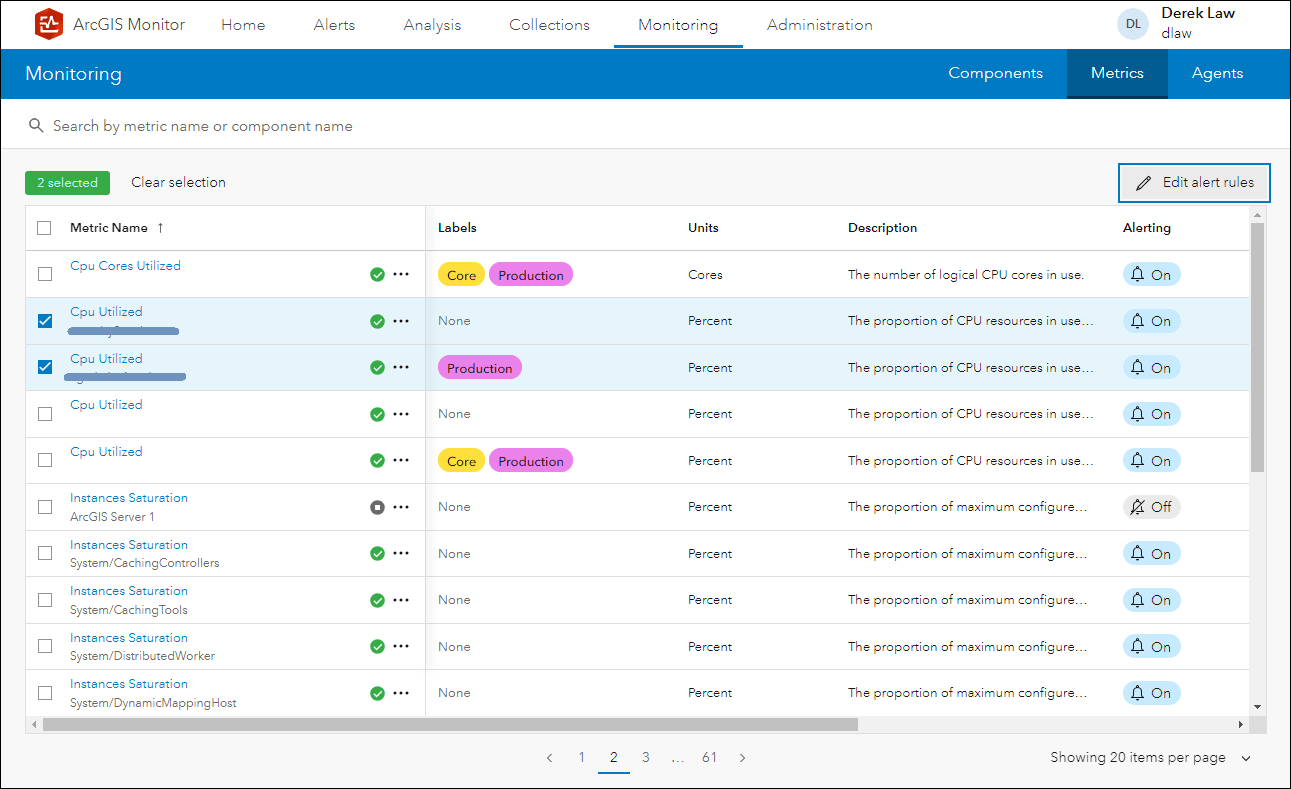
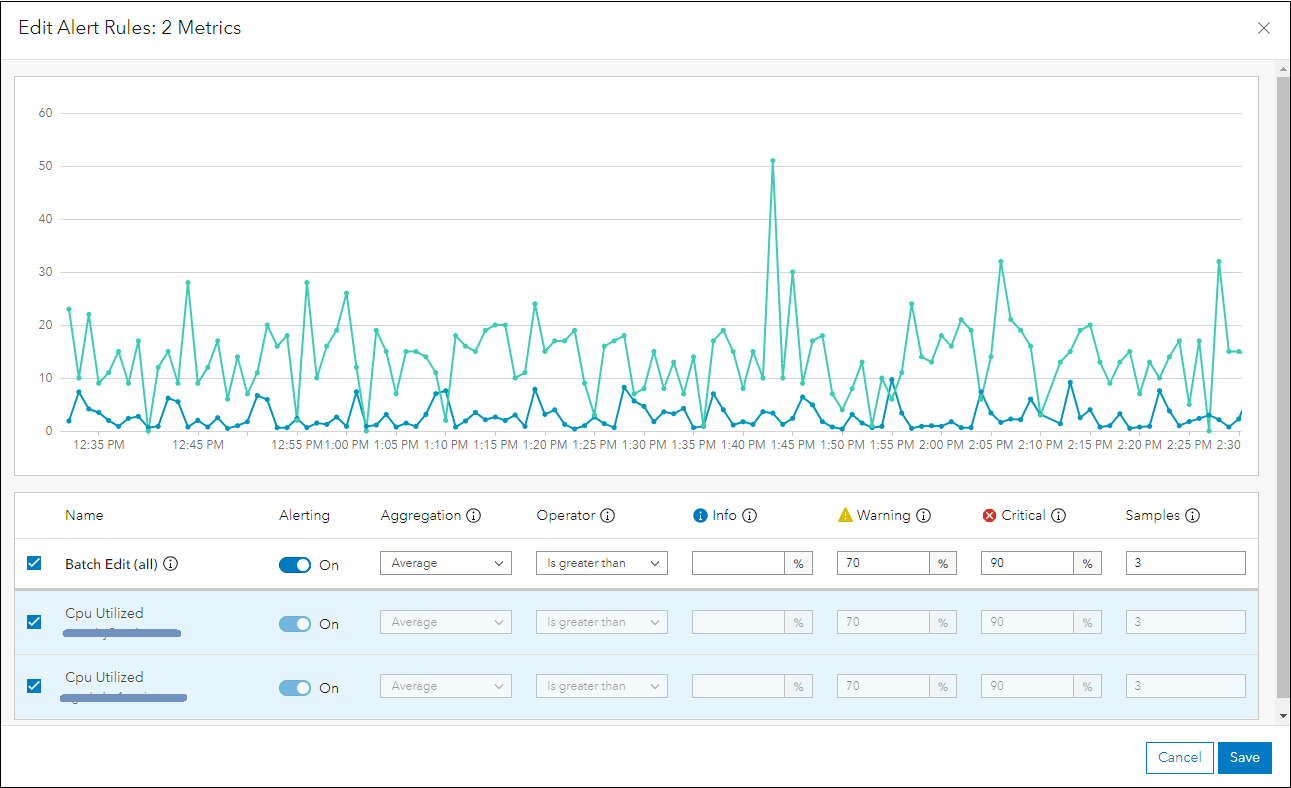
Figure 6: The CPU Utilized metric is selected for two host machines, their alert rules are edited in batch
Under the Administration tab, a new section called Metrics has been added. This enables default alert rules to be configured for metrics, which are applied when a new component is registered with ArcGIS Monitor. In addition, you also have the option to apply the default alert rules to metrics for components already registered with Monitor by clicking the … More options menu for a selected metric.
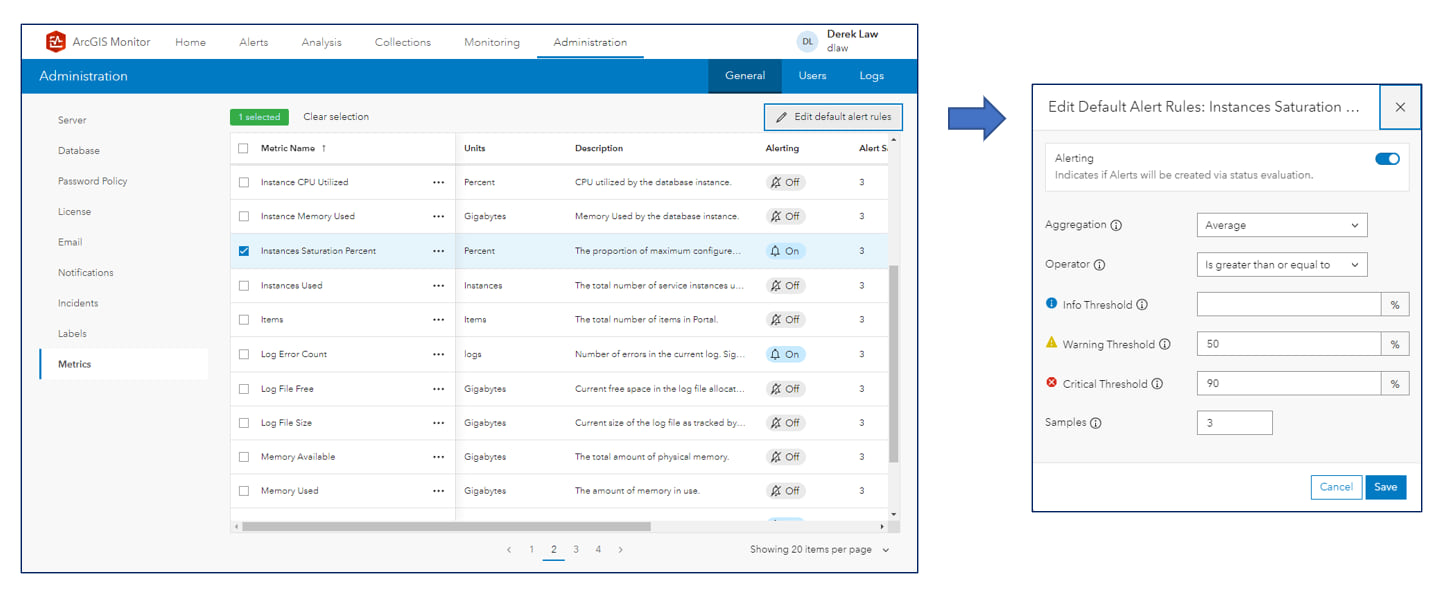
Figure 7: New Metrics section under the Administration tab allows for default alert rules to be set
Component status indicators
One behavioral change in ArcGIS Monitor 2023.3 is how a component’s status is determined. In previous releases, a component could have the following status: nominal, info, warning, critical, or unknown. Feedback has indicated that when a component has “unknown” status some users were concerned there might be an issue, when this might not be the case. In Monitor 2023.3, the specification to determine a component’s status has been changed to more accurately reflect its state. Four new status indicators have been added: incident active, monitoring off, alerting off, and no data, to better inform you about a component’s status. These replace the previous “unknown” status, depending on a component’s state. We expect this will help GIS managers and administrators better understand the status of a registered component.
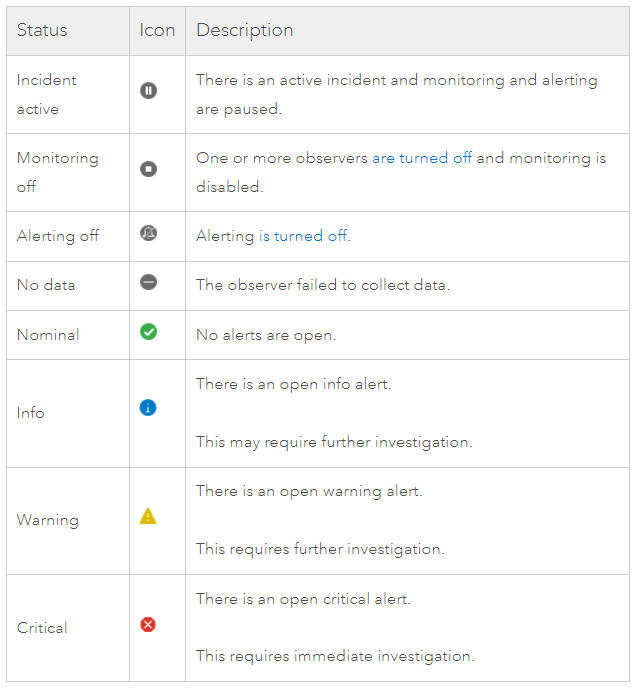
Figure 8: ArcGIS Monitor 2023.3 status indicators for components
There are several other useability enhancements such as default color swatches for Labels, and section headers in Analysis views can be collapsed and expended. A complete list of updates are listed in the ArcGIS Monitor 2023.3 release notes.
To learn more and connect with us about ArcGIS Monitor 2023.3, please visit:
- Product Page
- Documentation
- ArcGIS Monitor: An Introduction – Esri UC 2023 tech session video
- ArcGIS Monitor: Operational Scenarios – Esri UC 2023 tech session video
- Esri Community
Sincerely,
The ArcGIS Monitor team

Article Discussion: