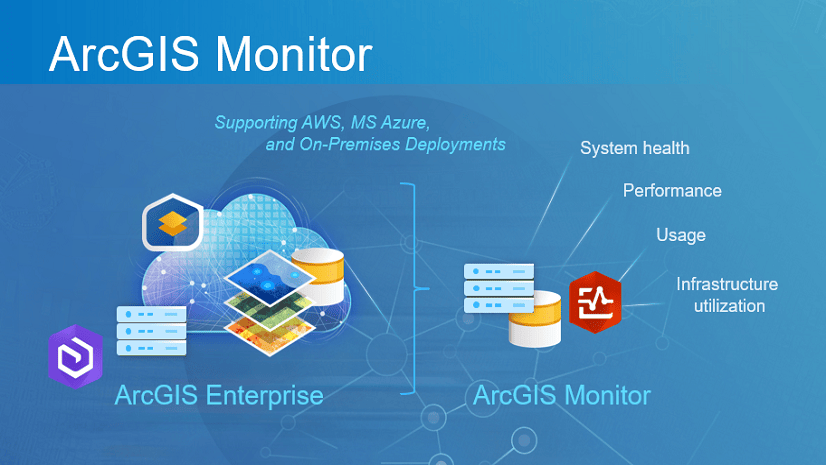
ArcGIS Monitor complements ArcGIS Enterprise by providing holistic monitoring of its components and underlying infrastructure. Monitor collects data metrics on an enterprise GIS deployment and provides alerting, notifications, and reporting capabilities. Read the ArcUser article 5 Reasons to use ArcGIS Monitor to learn more about how Monitor can help with your ArcGIS Enterprise deployment.
This blog is intended for GIS managers and administrators who have installed ArcGIS Monitor. You’ve logged into the ArcGIS Monitor web app and can see the Home page with some open alerts and host metrics charts displayed. What should you do next?
The objective of this blog is to provide a general workflow for setting up ArcGIS Monitor to work with your enterprise GIS deployment. A high-level outline:
- Register components and set alerts
- Define collections
- Configure Analysis views for reporting
- Register an email server
- Create notifications
Following this general workflow will help you get started with using ArcGIS Monitor to get more insights into your enterprise GIS deployment.
1. Register components and set alerts
A component is any enterprise GIS resource that you register with ArcGIS Monitor so it can collect data metrics on it. Components can include: enterprise portals, ArcGIS Server sites (federated and stand-alone), databases, geodatabases, and host machines. When an ArcGIS Server site is registered, its web services are automatically added as components to Monitor. Monitor can register enterprise GIS resources that are hosted on-premises, on virtual machines, and in Cloud environments. The list of supported GIS resources that can be registered as components is documented here.
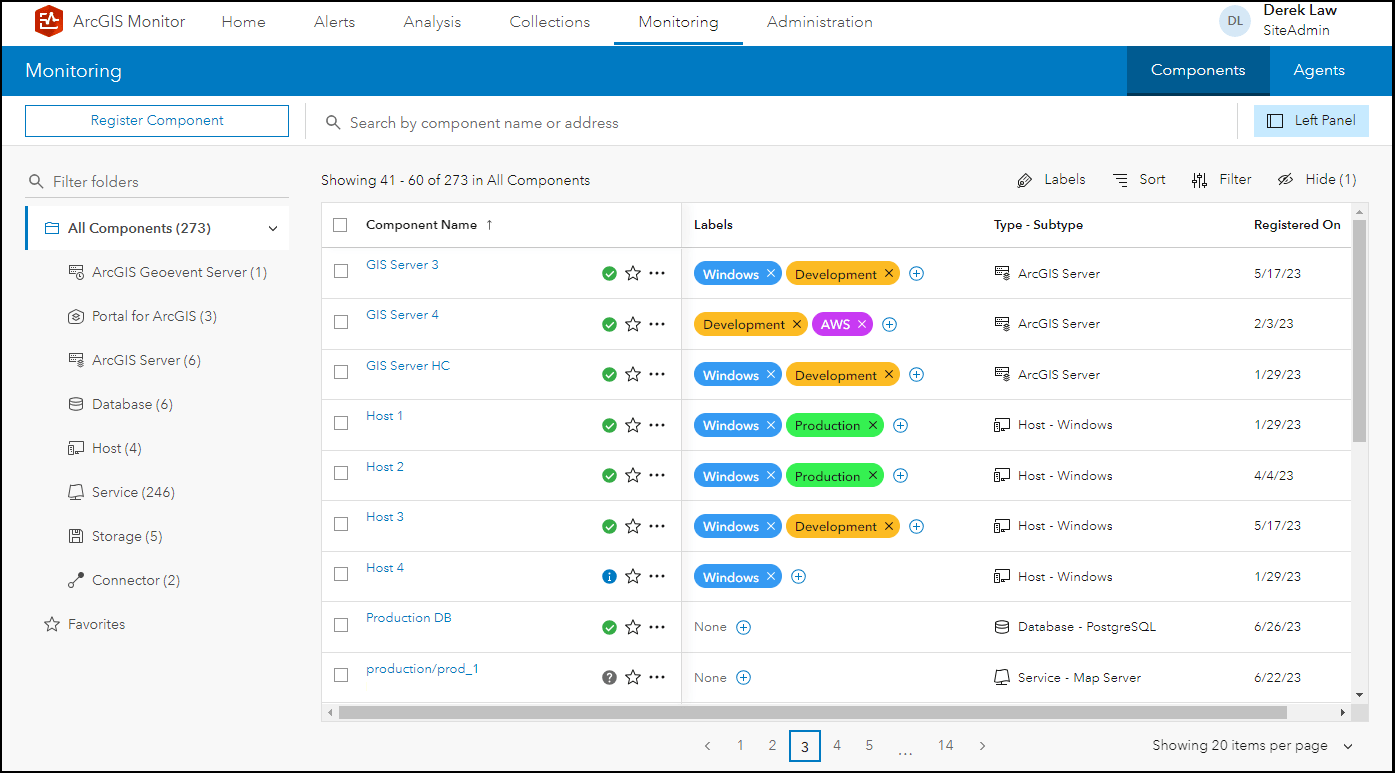
Components are added via the Monitoring tab > Register Component button. This activates the Register Component wizard and the options shown will vary depending on the component type being registered. Typically, the component registration workflow starts with choosing the type of component. Then, you give the component a name and description. Finally, you specify the connection information ArcGIS Monitor needs to communicate with the component. Detailed steps for registering different component types are available here. Registered components will appear in a list on the Monitoring tab and can be sorted and filtered.
Side note: As you register components, you can optionally define Labels for them. A label is a metadata tag that can help you organize your monitoring environment. Labels can be used to sort and filter the component list on the Monitoring tab and they can be leveraged in several of the ArcGIS Monitor expression builder dialogs. A labeling strategy that supports your organization’s structure is strongly recommended. For example, labels could be based on system environments (e.g., dev, staging, production), security posture (e.g., private, public) or business owners (different business units).
After registering a component, the next step is to set alert rules. Alert rules are threshold values that are set on a component’s metrics. If the value of collected metrics meets the thresholds set, then an alert is opened. Alerts indicate that a component may be in an unhealthy state and requires your attention.
For example, you could set the alert rules on the “Request Response Time Avg (s)” metric of a web service: if the average response time is greater than 5 seconds, open an alert – because a high response time suggests slow performance for the web service. When the alert is opened and occurs frequently, you could investigate to determine possible causes and thereby improve performance. Three different thresholds can be set for alerts: info, warning, and critical – each representing a different status; the respective statuses represent increasing severity. ArcGIS Monitor includes default alert rules for some component properties. Other examples of recommended alert rules to set alerts on:
- For ArcGIS Server sites: average response time, site availability, instance saturation
- For web services: request rate, average response time, instance saturation
- For host machines: CPU utilized, memory utilized, storage capacity
Metrics of different component types are described in the metrics reference documentation. Leveraging alerts enable you to proactively manage your enterprise GIS. In other words, alerts can help identify possible issues that affect enterprise GIS health and performance.
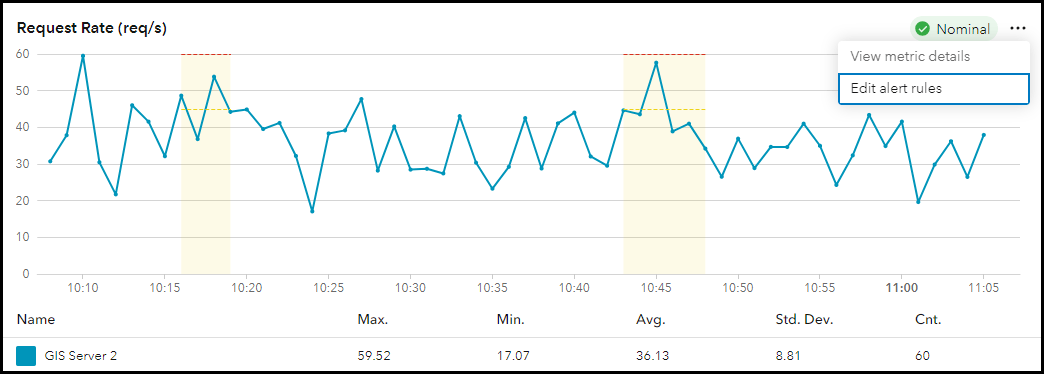
On the Monitoring tab, click a component to display more detailed information. Key data metrics for the component are shown as individual data visualizations (e.g., as serial charts). To set alert rules for a data metric, click the More options button (located in the upper right corner) > Edit alert rules. For example, you could select an ArcGIS Server site in the components list, view its data metrics, for the Request Rate parameter, edit its alert rules.
In the Edit Alert Rules dialog, you can turn alerting on, specify the aggregation, and customize threshold values for each of the three alert levels. Learn more about configuring alert rules.
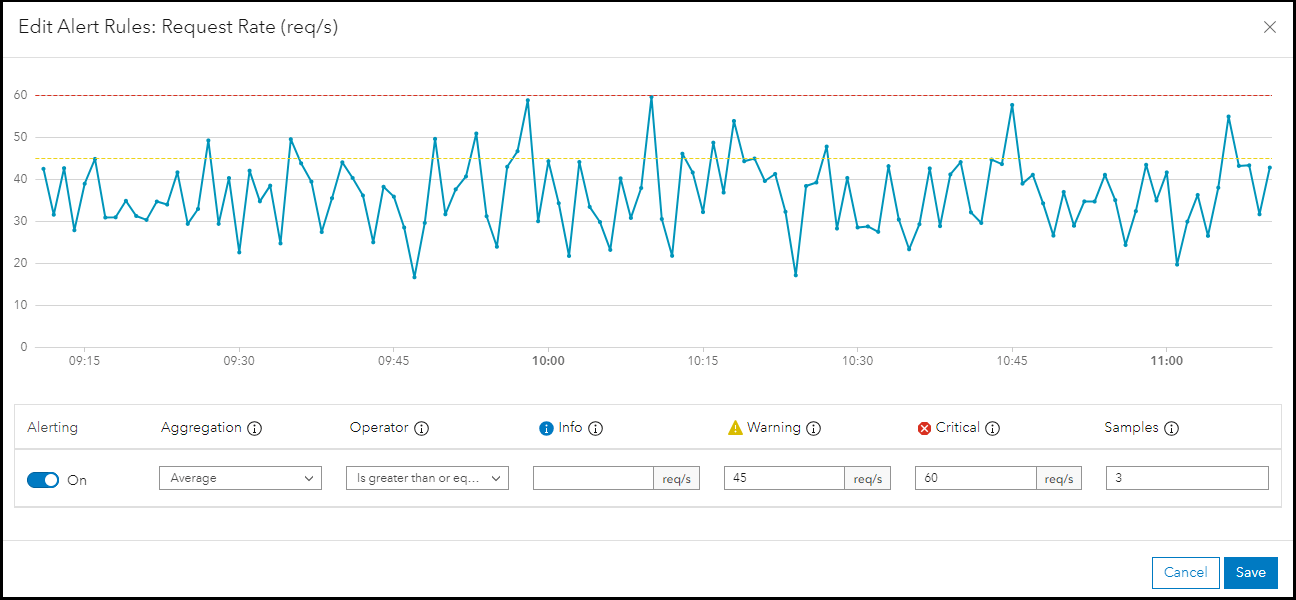
Alerts can be set for all of a component’s metrics. Click the Metrics subtab of a component to see a table of all its metrics.
2. Define collections
A collection is a logical grouping of components which can be defined for organizational purposes. This step is not required, but might be helpful for reporting purposes. For example, you could create a collection of all components of a certain type, like ArcGIS Server sites or all components that are part of your production environment (e.g., all components labeled as “production”). Components that participate in collections are defined by using a SQL-like expression builder. Collections offer a way to organize components dynamically. For example, if you have a collection that contains all registered Windows host machines; when you register a new Windows host, it will automatically be added to the collection.
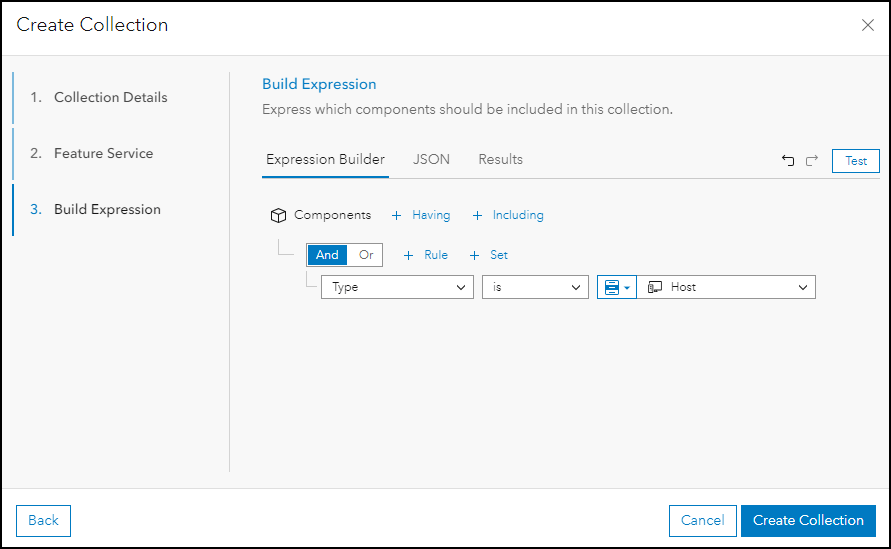
To define a new collection in ArcGIS Monitor, navigate to the Collections tab > Create Collection button. The Create Collection wizard appears, where you can give the collection a name and description, enable a feature service (optional), and specify the data expression that determines which components will participate in the collection. Collections should align with your organization’s management practices. Learn more about collections.
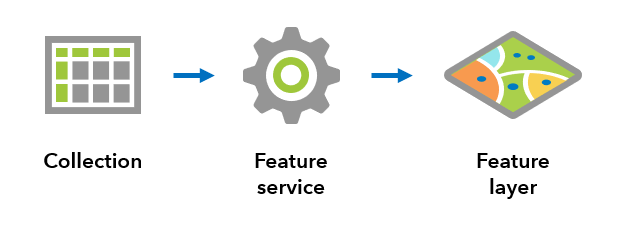
Side note: one benefit of grouping components into collections is the ability to enable a feature service for the collection. This means that all data metrics for the components that participate in the collection will be gathered and stored into a feature service (hosted in ArcGIS Monitor). The feature service can then be added as an item in an enterprise portal, which could be leveraged by any ArcGIS client apps that support feature layers. For example, the data metrics reported in a collection could be consumed and displayed in ArcGIS Dashboards. This is a great option if you want to display and share data metrics for a subset of components to stakeholders interested in those components outside of ArcGIS Monitor.
3. Configure Analysis views for reporting
The Analysis capability in ArcGIS Monitor provides an expression builder experience to define data expressions and display them in an Analysis view (i.e., a dashboard layout). This allows you to select the data metrics you’re interested in viewing from the components registered with Monitor. Constructing data expressions and Analysis views enables you to create your own custom reports on collected data metrics. An Analysis view can report the data metrics for many different use cases ranging from a high-level overview of enterprise GIS health to monitoring critical components of the organization.
By default, Monitor includes a Sample Analysis – it displays the number of open alerts and host data metrics; this example Analysis view is also shown on the Home page when you initially log into the web app.
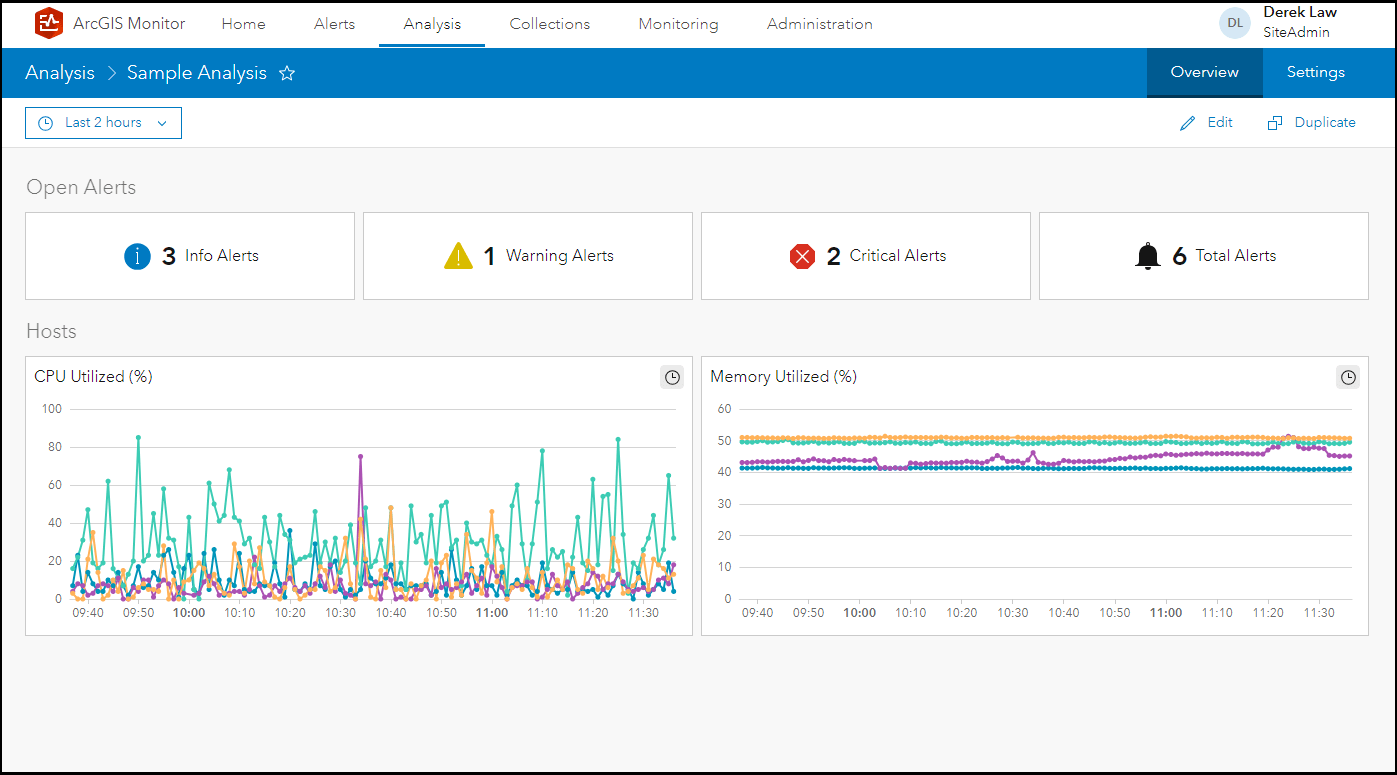
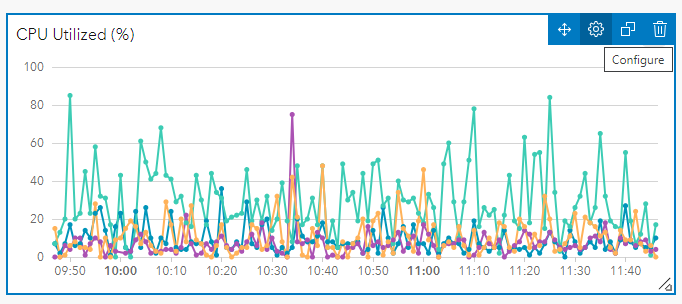
You can see how the Sample Analysis view was created by navigating to the Analysis tab > click Sample Analysis (which displays its layout) > Edit button (in the upper right corner of the page). This enables edit mode for the Sample Analysis view where you can then click the Configure button for an element (it appears when you hover over the element) to see how it was configured.
The general workflow for creating a new Analysis view:
i) Click Create Analysis on the Analysis page
ii) Click Add Element > select the element to add
iii) Click New Data Expression > construct the data expression
iv) Select the data expression from the list and configure the element’s display properties
v) Position the element in the layout
vi) Repeat steps ii to v as appropriate
More detailed steps are provided in the Create analysis views documentation.
For example, a useful report metric is ArcGIS Server instance saturation (%) – this property describes the proportion of configured service instances in use, where high values indicate that more instances are needed to handle incoming service requests. A serial chart element can be configured to display the instance saturation (%) for all registered ArcGIS Server sites in Monitor. The data expression for ArcGIS Server instance saturation is:
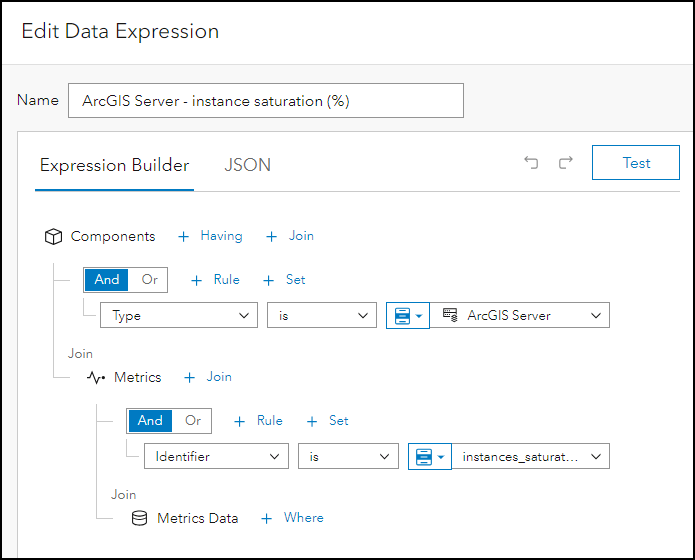
The data expression shown selects all components of type “ArcGIS Server”, queries their data metrics, and filters for the “instance_saturation” data. After the specific data metrics are queried, the serial chart element can be configured to display the average instance saturation observed:
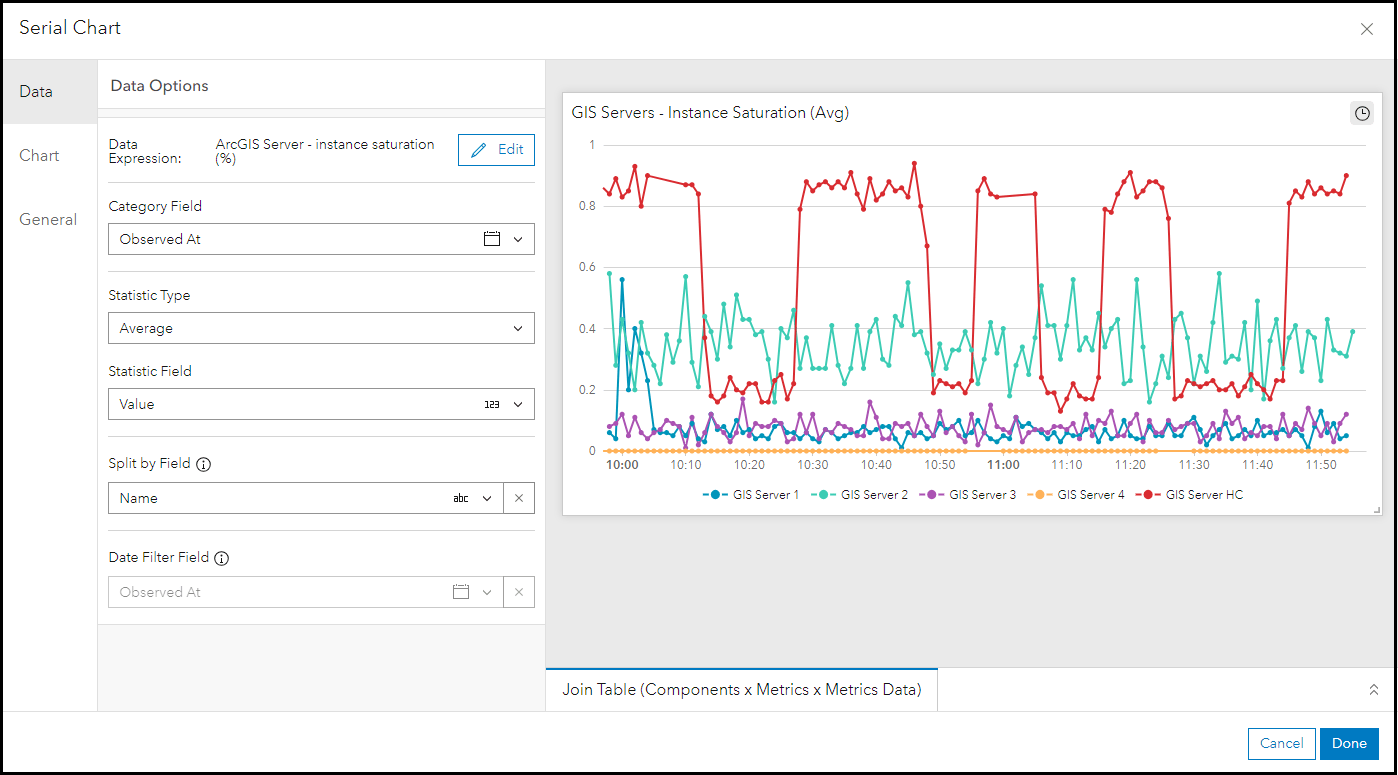
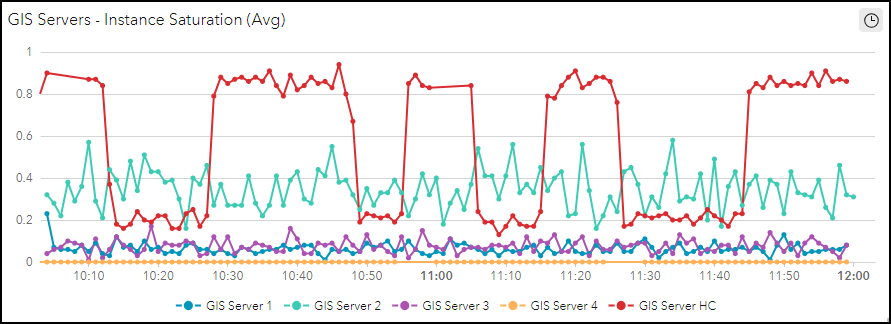
Serial Chart properties: For Data Options, the category field (i.e. x-axis) would be “Observed At”, the statistic type is “Average”, the statistic field is “Value”, and the split by field is “Name” – so you can see data for each registered ArcGIS Server site. For Chart, select chart type as line, orientation as horizontal, and position the legend at the bottom. For General, you can add a custom title for the chart. The final ArcGIS Server instance saturation (%) report metric displayed in the Analysis view:
For help on constructing data expressions, review the metrics reference which describes the ArcGIS Monitor information model.
4. Register an email server
One of the key capabilities of ArcGIS Monitor is the ability to send notifications. You must first register a Simple Mail Transfer Protocol (SMTP) server with ArcGIS Monitor by navigating to Administration tab > Email setting. Step-by-step instructions can be found in Configure email server settings. After an SMTP server is configured, ArcGIS Monitor can start sending email notifications.
5. Create notifications
After registering an email server with ArcGIS Monitor, you can now leverage notifications. A Notification represents a specific event or changes to the monitoring environment. For example, you can be notified when a critical alert opens or when a web service stops unexpectedly. This can help you proactively manage your enterprise GIS by making you aware of potential problems early on before they become a bigger issue. There are two types of notifications:
1. a collection notification – notifies on the components in a specific collection
2. a custom notification – notifies on a large number of events that can occur in Monitor
Navigate to the Administration tab > Notifications setting. Click +Add Notification to configure a new notification. This displays the Add Notification wizard where you specify notification type, name, description, events that will trigger the notification, and email and webhook configurations. Detailed steps are provided in Create notifications.
For example, you could create a custom notification that triggers when a web service registered for monitoring is stopped:
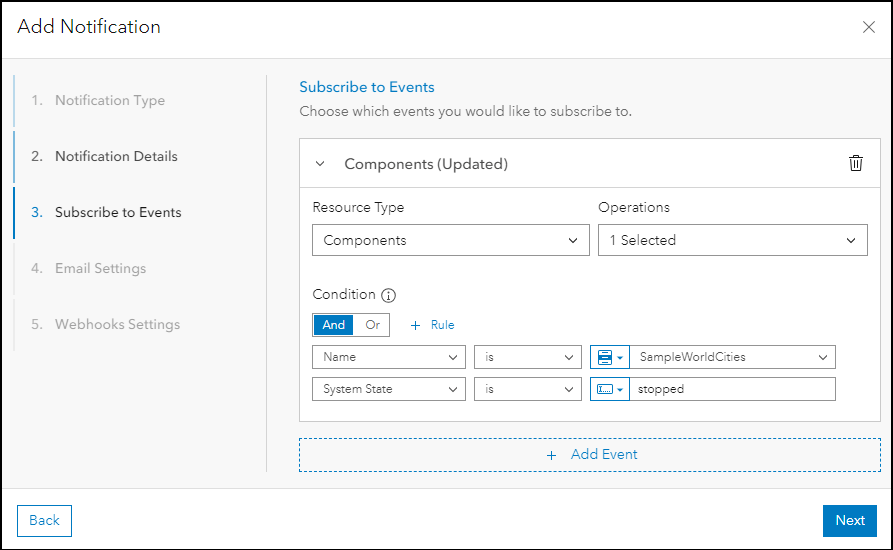
For Subscribe to Events click +Add Event, for Configure Event – Resource Type select “Components”, and for Operations select “Updated”. Then for Condition click +Add Condition, select Name is <web service name>, then click +Rule, and select System State is, type in “stopped”. Create notifications in Monitor as needed to support how you manage your organization’s enterprise GIS.
Summary
The intent of this blog is to provide a general workflow to help get you started with configuring ArcGIS Monitor. More detailed information is available in the ArcGIS Monitor help documentation. You can also post questions in the ArcGIS Monitor forum on Esri Community.
Sincerely,
The ArcGIS Monitor team


Great Post Josh! Quick Question – in the last section about Notification, when we try to add the ‘stopped’ condition the drop down does not populate and when we type in the value it does not save. Any thoughts?