Did you know you can easily create many of the demos we present at conferences?
At FedUC 2018, Madeline Schueren, from the Esri Geodesign team, showed some of the many ways you can leverage 3D point cloud data. In her demo, she showcased how to use this dynamic type of 3D data in Scene Viewer to make decisions.
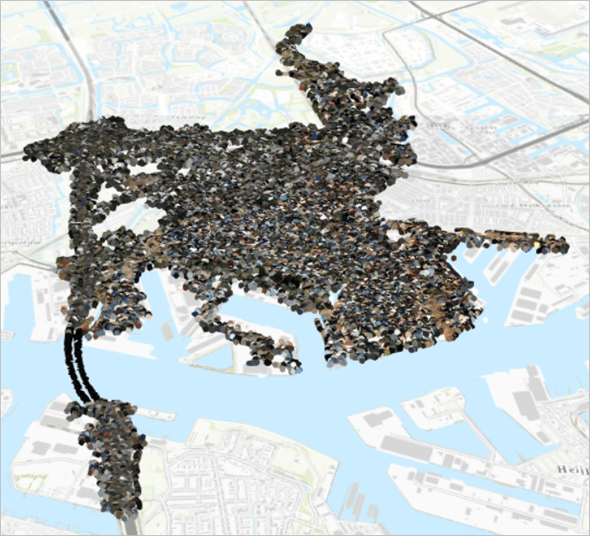
In her 3D web scene demo, Madeline introduced a web map with data from Schiedam, Netherlands. The data consisted of a collection of citywide LiDAR supplied by CycloMedia, a company specializing in collecting LiDAR over entire cities using terrestrial laser scanning. Lidar data is readily available in ArcGIS Online and can easily be added to a web scene, accessible via computer or mobile device.
Madeline’s web scene of Schiedam is here for you to explore, but you can also create your own.
City of Schiedam- CycloMedia
Explore the web scene below.
Step 1- Make a web scene
1. Sign into your ArcGIS organizational account.
If you don’t have an account, get a free trial.
2. At the top of ArcGIS Online, click Scene .
A new web scene opens.
3. On the ribbon, click New Scene and choose New Local Scene.

To view Schiedam data, you need to use a local scene. The LiDAR data is in a projection suitable for the Netherlands, and can’t be shown in the default WGS 1984 projection.
4. In the Search bar, type Schiedam and press Enter.

5. In the Designer pane, click Add Layers.
6. Click My Content and choose ArcGIS Online. Search for Schiedam RGB.
All the results in your map view will be represented by pins.
7. Click the plus signs for Schiedam_RGB_Part_1-3 to add the layers to your scene.

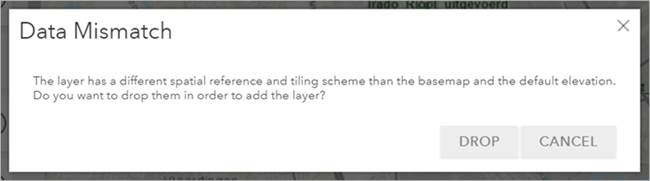
Note – you’ll see a Data Mismatch window. This is because the default local scene shows the United States and your newly added data is in the Netherlands.
The layers you are adding have a different spatial reference and tiling scheme than the basemap and default elevation.
8. Click Drop to remove the default elevation and add your new layers. This also removes the basemap and default elevation from your map.
Note— Web scenes can’t project data on the fly, so all layers you add must be in the same projection, or they won’t appear on the map.
9. In the Add Data pane, search for Topo RD.
10. Find the Tile Layer result from Esri_Nederland and add it to the scene.
Topo RD is a projected basemap created by Esri Nederland.
11. In the Add Layers pane, click Done, then click Save Scene.
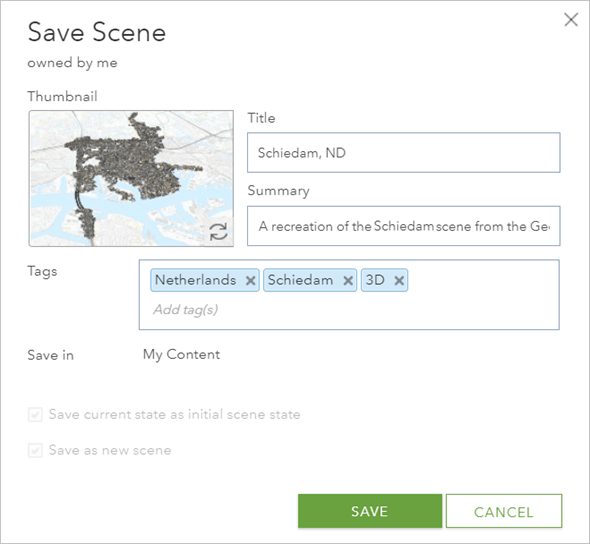
Congratulations, you’ve just recreated the scene Madeline used in the presentation. Now have a little fun exploring and using it.
In her presentation, Madeline measures street signs for replacement. The one she measures is along the A4, a motorway that cuts south from Amsterdam.
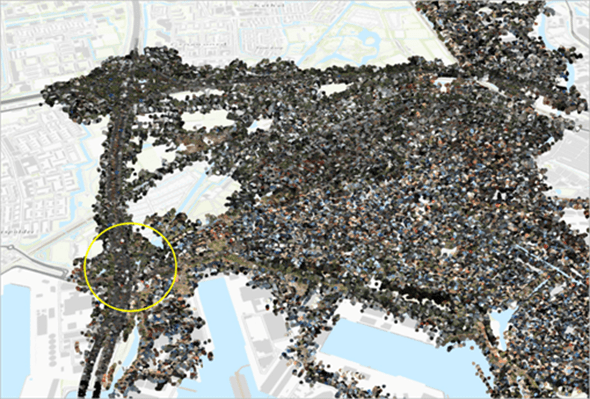
Step 2- Measure street signs
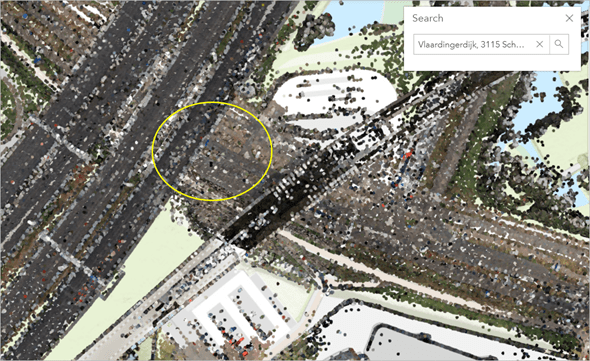
1. Type Vlaardingerdijk, 3115 Schiedam, NLD in the search bar.
The sign you’re looking for is on the righthand side of the underpass.
2. On the toolbar, click Measure.
3. Click a corner of the sign and measure the length and width.

4. For comparison, explore along the A4 to find other road signs.
The ability to remotely collect features can be very helpful to local and national governments and others. With the growing amount of lidar and other 3D data available to the public, workflows like this are made much easier.
Does your city or country have available lidar data? Explore what’s available, and try creating your own web scene.
If you’re ready for a more in-depth tutorial on Scene Viewer, check out Get Started with Scene Viewer at Learn ArcGIS.


Commenting is not enabled for this article.