1.0 What does it do?
Nitrate is a commonly identified groundwater and surface-water pollutant; it poses serious threats to human health and the environment. One important source of nitrate in the environment is due to wastewater treatment using Onsite Sewage Treatment and Disposal Systems (OSTDS) (a.k.a., septic systems). To facilitate water resources and environmental management (e.g., the calculation of total maximum daily loads, TMDL), we developed an ArcGIS-Based Nitrate Load Estimation Toolkit (ArcNLET) to simulate nitrate transport from septic systems in groundwater and to estimate nitrate load from septic systems to surface water bodies such as lakes and rivers. It is a screening tool based on a simplified conceptual model of groundwater flow and nitrate transport.
We have used it to estimate nitrate load from thousands of septic systems to surface water bodies in two neighborhoods located in Jacksonville, FL, USA, where nitrate due to septic systems is believed to be one of the reasons of nutrient enrichment and an isotope study indicates that denitrification is significant. While our study includes local and global sensitivity study to identify critical parameters to nitrate concentration and load estimates as well as uncertainty analysis to quantify uncertainty in model parameters, we only describe below the basic steps of using the software for nitrate load estimation in a deterministic manner.
2.0 Using ArcNLET to Predict Nitrate Distribution and Load
A typical ArcNLET workflow consists of four steps:
1. Calculating groundwater flow velocity and direction with the Groundwater Flow module.
2. Generating flow lines using the particle tracking function.
3. Calculating nitrate plumes via the Transport module.
4. Estimate load with the load estimation function.
For illustration purposes only, a test site consisting of a neighborhood in the Lakeshore area located in Jacksonville, Florida is presented. This neighborhood has many septic tanks that are close to a river. It is desired to estimate the nitrate load to the river from these 265 septic tanks as well as visualize the nitrate plumes. The data used for this example is available on the ArcNLET webpage http://people.sc.fsu.edu/~mye/ArcNLET/
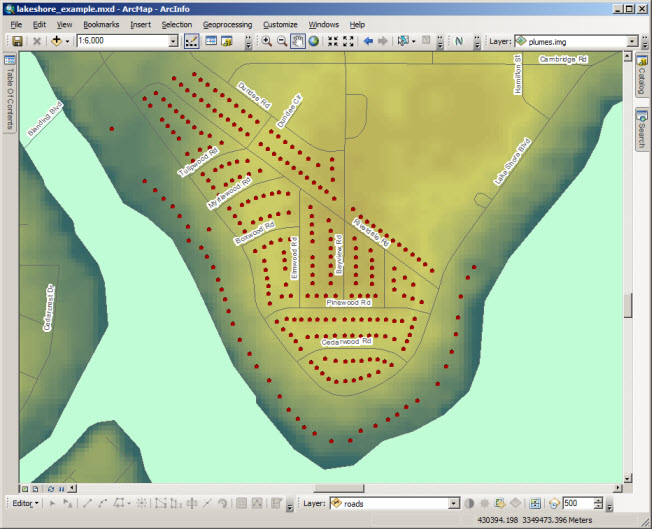
2.1 Calculate Groundwater Flow
The first step is to calculate groundwater flow velocity and direction. As inputs, a 1/3 arcsecond (approximately 10 m) digital elevation model (DEM) of the area was obtained from the publicly available USGS National Elevation Dataset. The location of the river was obtained from the National Hydrography Dataset. Raster files representing hydraulic conductivity and porosity were created and were set to be constant values (2.113 m/day and 0.25, respectively) over the entire neighborhood. However, ArcNLET supports spatially variable conductivity and porosity values, if available.
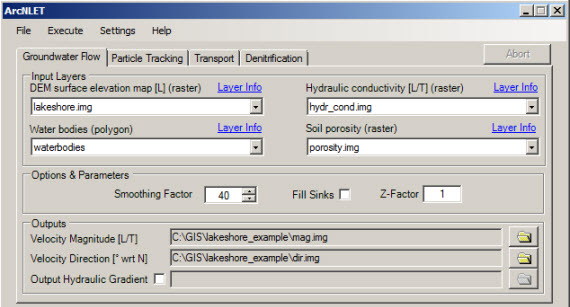
After loading all the input data into ArcMap, select the appropriate layer from the dropdown boxes for each input. Then, set the smoothing factor to 40. This factor controls how much the water table resembles the topography and can be estimated from well measurements. It is generally in the range 20 to 80 for the USGS DEM, but may be larger for LiDAR DEM so that the water table can be viewed as a subdued replica of topography. Leave the other parameters as default. Select the output file locations by clicking the folder icons next to the appropriate boxes. To execute the flow model, click on the Execute menu and select the ‘Groundwater’ entry. After completion, you will get two rasters, one representing flow velocity magnitude and the other flow velocity direction. You can turn off these raster layers as they are of little use on their own.
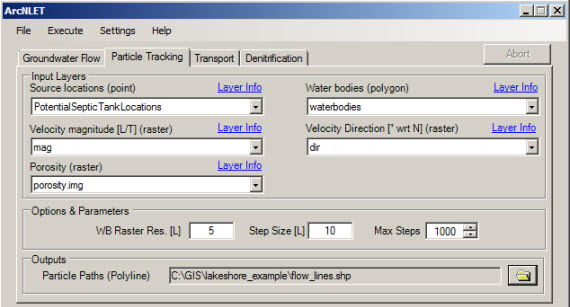
2.2 Generate Flow Lines
Flow lines serve two purposes. The first is to calculate the flow from each septic tank and the second is to visualize the flow field. In the Particle Tracking tab of ArcNLET, select the source locations input layer to be the septic tank locations. For the velocity magnitude and direction layers, select the rasters you just calculated in the previous step. The remaining inputs (porosity and water bodies) are the same ones used for the Groundwater Flow module. Select the location of the output shapefile by clicking the folder icon. Leave the parameters at their default values. Execute the module by selecting the Particle Tracking entry from the Execute menu.
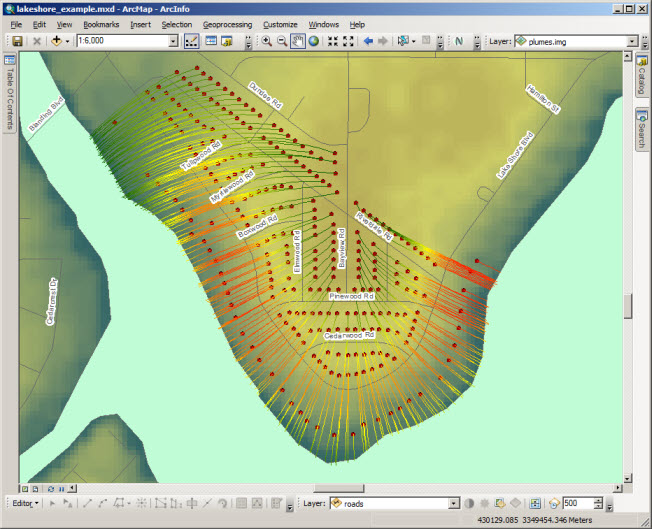
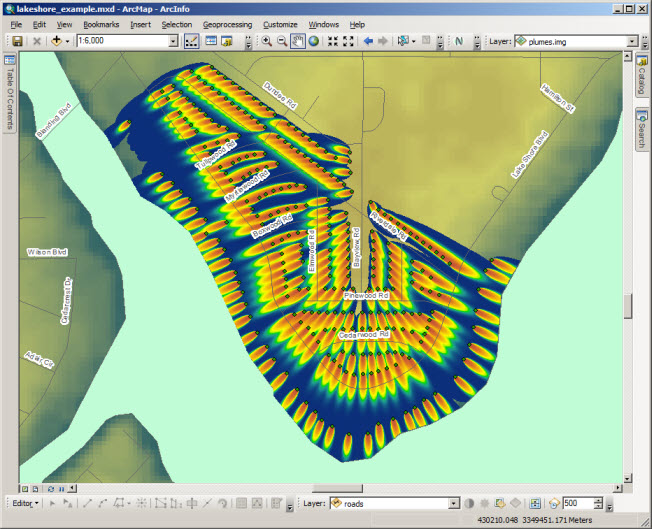
After execution is complete, you will see the flow lines for each septic tank. The lines can even be color-coded using the data in the attribute table to indicate the flow velocity along the path. In the figure below, the lines have been color-coded where green and red colors indicate low and high flow velocity, respectively.
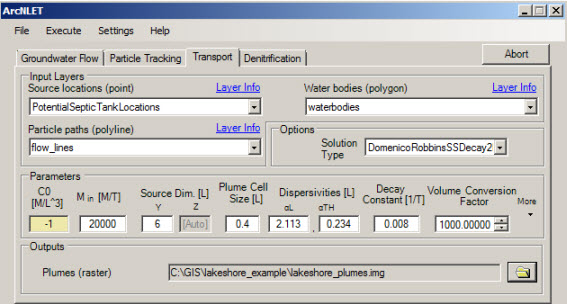
2.3 Calculating Nitrate Plumes
ArcNLET can calculate nitrate plumes from one or more septic tanks. In the Transport tab, you can see that there are more options and parameters for this module compared to the others. These options and parameters are related to various physical characteristics of the study area (e.g., dispersivity and decay constant), characteristics of the septic tanks (e.g., nitrate concentration at the drain field and width of the drain field), or are simulation parameters (e.g., plume cell size and volume conversion factor). Some parameters such as the nitrate concentration at the drain field (C0) can be set on a septic tank by septic tank basis using the attribute table of the source locations input file. In this example dataset, C0 has been set via this method to 40 mg/l (a “-1” in the C0 box in ArcNLET indicates that the value of C0 will be read from the attribute table for each septic tank).
The default values of all the parameters are appropriate for the Lakeshore dataset therefore it is not necessary to change them right now. For the input layers select the flow lines which were calculated in the previous step, the septic tank locations and the water bodies. Select the location of the output plumes raster by clicking the folder icon.
Once the process completes, you will get a black and white raster file showing the concentration distribution of nitrate. This can then be colorized with a color ramp of your choice. Additionally, you will get a point shapefile showing the locations of the calculated septic tanks, the attribute table of which contains much information (e.g., input load from each tank to groundwater).
2.4 Nitrate Load Estimation
The final step is to estimate the amount of nitrate entering the river. This is done via the Nitrate Load Estimation module which can be accessed via the ‘Denitrification’ tab. As input, select the point shapefile generated by the Transport module. The Risk Factor box is a multiplicative safety margin applied to the estimated load and will be left at “1” for this example. Run the module using the Execute menu.
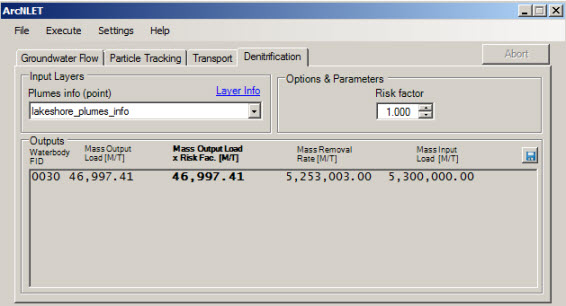
The output appears in the box and shows the load to the river, the rate of nitrate removal due to denitrification, and the input load of nitrate to groundwater from all septic tanks. If there were more water bodies, they would each have their own load estimates. In this example, units in the output are milligrams because the input concentration, C0, in the Transport module was specified in milligrams. The time unit is days because the hydraulic conductivity in the Flow module was specified in days. The estimated load to the river is 46,997 mg/day (0.1 lb/day).
We thank Rick Hicks at the Florida Department of Environmental Protection for his help on this project. Download the ArcNLET installation package for ArcGIS 9.3.x or ArcGIS 10 at http://people.sc.fsu.edu/~mye/ArcNLET/.
Special thanks to Fernando Rios (University at Buffalo, jfernand@buffalo.edu), Ming Ye (Florida State University, mye@fsu.edu), Paul Z. Lee (Florida Department of Environmental Protection, paul.lee@dep.state.fl.us), and Liying Wang for providing this post.

Article Discussion: