Note: Everything in this blog post applies to 3d web scenes as well as web maps (unless otherwise specified), so you can pretend that anywhere it says “maps” or “web maps” there’s an “and/or [web] scenes” appended.
One of the best things about ArcGIS StoryMaps is, of course, the ability to take web maps, drop them straight into any story or briefing, and use them in all kinds of versatile ways to support your place-based storytelling goals.
You’ve likely noticed, though, that you can’t edit a web map’s content or appearance directly in ArcGIS StoryMaps, outside of adjusting layer visibility. That’s because those maps are already produced by some pretty robust GIS tools — namely ArcGIS Pro and Map Viewer — that have all the geospatial analysis and visualization power you need to create impactful cartography. A story or briefing is really just the vehicle for that cartography, providing context and related information through a narrative structure to explain something about the world we inhabit.
However, that doesn’t necessarily mean that web maps are purely plug and play once you’ve brought them into a story or briefing. ArcGIS StoryMaps does provide several options that dictate how a given web map behaves or can be interacted with. This blog post will walk through each of them, explaining what they do and offering advice regarding when (or when not) to use them.
What are the web map options in ArcGIS StoryMaps?
After you’ve added a web map to a story (either to the main body of the story or as part of a sidecar slide) or a briefing, you’ll see a pencil icon in a toolbar at or near the top of the map when you’re hovering over it in the builder. That pencil takes you back into the map editor. On the left is the layer panel, listing all the layers in the map. At the top of that panel are a few more icons; one is a little gear, which turns the layer panel into an options panel when selected.

The map options panel contains the following items; I’ll cover each of them in turn:
- Allow map navigation
- Sub-option (if parent is toggled on): Search
- Sub-option (if parent is toggled on): Current location
- Legend
- Sub-option (if parent is toggled on): Keep legend open
- Keep pop-up open
- Docked pop-up
- Overview map
- Scale bar
- Map view across screen sizes
Note: Before diving into each option and what they do, it’s important to be aware that most of these features and functions will not be initially visible on maps that are set to “float” alongside inline text or that are being viewed on a smaller mobile device screen (like a smartphone). For those instances, readers can expand the map using the button in its upper right-hand corner to access these features.
Allow map navigation (initially toggled on)

What does it do? When map navigation is enabled, readers can zoom in and out, move around the map, and essentially explore it at will. A “home” button will be present to return the map to its original author-specified state. Turning map navigation off will make the zoom controls and home button disappear, and the map will be locked into the initial view that the author has specified.
When should you use it? Leaving map navigation on is best for maps that are meant to be explored at the reader’s leisure — often data-rich maps with lots of interactivity. If you have a map that serves a very simple, obvious purpose (like a locator map, e.g.) or is very focused on one particular area, and you don’t want readers to wander away from that area, disabling map navigation is advisable.
Search (only appears if map navigation is on)

What does it do? Adds a search widget in the upper left-hand corner of the map that readers can use to search for particular addresses or points of interest within the map.
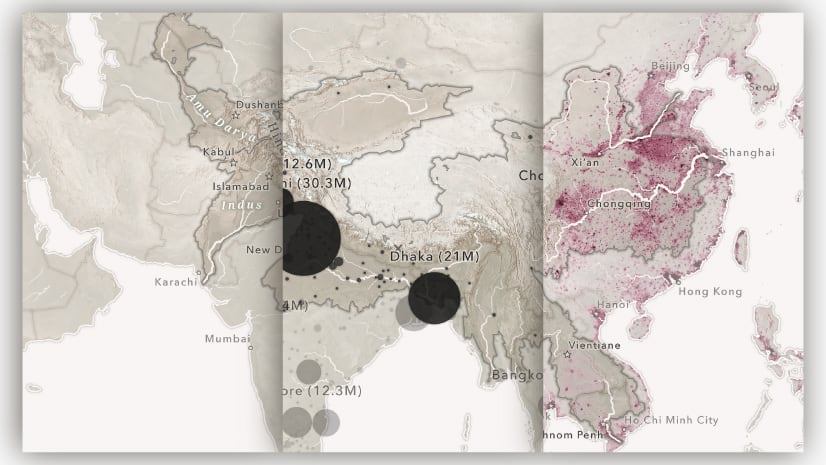
When should you use it? Because the search library is global, it makes the most sense to activate the search widget when the coverage of data and features in the map is extensive, to allow readers to perhaps search for their own home or places that are important to them to see how those locations are impacted by what the map is conveying. [Note that the author of a web map can configure it to only search for features within a layer in that map, in which case it could be sensible to activate the search widget for larger scale or more focused maps.]
Current location (only appears if map navigation is on)

What does it do? Adds a “target” icon above the zoom and “home” controls that, when pressed, will focus the map on the reader’s location (as long as the device and browser they’re using have location services enabled).
When should you use it? As with the search option, you’ll mostly only want to have this ability turned on if the data and features in your map are of a sufficiently global scale that there will be something in the map to examine wherever a reader’s current location happens to be. There are also some applications for maps in stories or briefings that are especially intended to be used for field work, where readers are more likely to be on the ground in the map’s area of focus and could benefit from seeing their immediate location in relation to the geospatial information on the map.
Legend (initially toggled off)

What does it do? Adds an icon in the lower-left corner of the map that, when pressed, unfolds a legend containing the symbology and labels for every visible layer in the map (as long as its legend property is enabled in Map Viewer, which is the default setting).
When should you use it? Because the legend captures every visible, legend-enabled layer in the map, it will often end up with space occupied by representations of features that are obvious or aren’t really crucial to understanding the map, like a “national borders” or “waterbodies” layer. Since there isn’t a way to control that at the ArcGIS StoryMaps level without turning layers off entirely, you should be judicious about when the legend is truly necessary within a web map. Remember that you can always provide an explanation and additional context in the surrounding portions of the story or briefing (sidecar is great for this!), or even bring in a separate graphical legend that only contains the layers that need to have their symbologies explained.

Keep legend open (only appears if legend is on)
What does it do? The same thing as the legend option, except the legend will already be open whenever readers first come to that map (they can still opt to manually collapse the legend themselves using an X button at the upper-right hand corner of the legend).
When should you use it? Given that the legend occupies an appreciable chunk of the map when it’s open, you’ll need to again be judicious in determining how critical the information on the legend is to understanding what the map is saying and whether that’s worth potentially blocking a portion of the map. Generally, this treatment works best when the map is all about just one specific slice of data and only has one feature class that needs to be symbolized.

Keep pop-up open (initially toggled off)

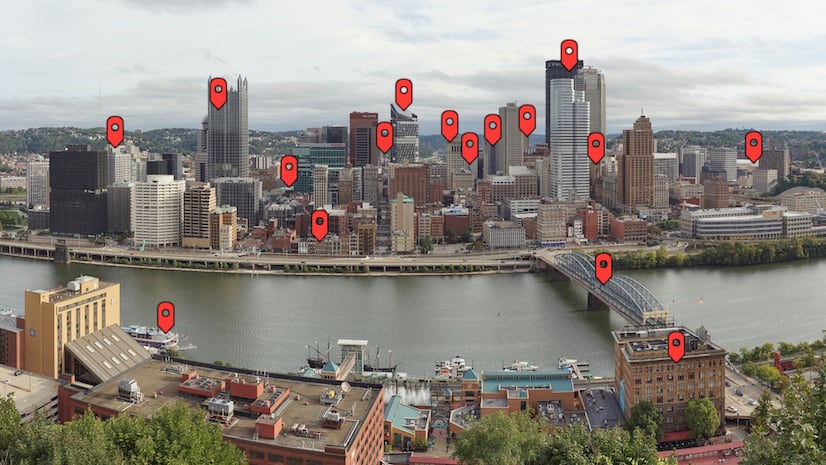
What does it do? Allows for one author-designated feature to have its pop-up open whenever a reader first comes to that map. To implement, toggle the option on and then select the desired feature (or vice versa).
When should you use it? When there’s one specific feature that a map is meant to showcase, especially if the importance of that feature wouldn’t be apparent otherwise. Note that you usually don’t want to employ this in conjunction with Keep legend open because the pop-up may conflict with the legend.
Docked pop-up (initially toggled off)

What does it do? Places all pop-ups, when opened, in the bottom left-hand corner of the map.
When should you use it? If you have longer, more information-dense pop-ups, it can be beneficial to keep them off to the side so that they don’t cover as much of the map’s central portion, allowing readers to explore and bounce from feature to feature more easily. However, it can be easy to lose track of which feature is actually selected (e.g., if it’s one point in a sea of point data) when there isn’t a physical connection between that feature and its pop-up, so be aware of that, especially if you’re also using Keep pop-up open. Also, you definitely don’t want to employ this in conjunction with Keep legend open because the pop-up and legend will occupy the same space.

Overview map (initially toggled off)

What does it do? Adds a small globe in the lower right-hand corner of the map that provides broader geographic context for the current extent of the map via a locator box on the globe. The box will change size and position as the reader moves the map. [Note that an overview map will not appear on mobile phone screens even when the map has been expanded.]
When should you use it? For maps smaller than global or continental scale, the reader might benefit from getting a sense of where the map is in the context of the world. While there’s not much downside to turning this on, not every map needs an overview map. For instance, if you have seven sidecar slides in a row containing maps of the same city at roughly the same scale, you probably don’t need to turn on the overview map for any of those slides except perhaps the first one.

Scale bar (initially toggled on)

What does it do? Includes a scale bar at the right end of the partially translucent credits bar at the very bottom of the map (which you may have not even noticed before). [Note that this option is unavailable for web scenes, which don’t permit a scale bar.]
When should you use it? The scale bar is completely unobtrusive and is a core element of many maps, so there’s not much harm in leaving it turned on most of the time (although the scale bar becomes less accurate at smaller scales due to the nature of map projections, so it might even be advisable to turn it off for, say, global scale maps where the reader can’t zoom in). One major use case for turning the scale off involves web maps that aren’t really maps because they’re using media layers, in which case the scale becomes meaningless and even misleading.

Map view (initially set to “Preserve extent”)

What does it do? This option — which is not an “on/off” choice like the others, but rather an “either/or” — determines how the map will look when it’s viewed across different screen, browser window, and block sizes. “Preserve extent” will ensure that the map always maintains the same geographic area (e.g., a map set to include the entire state of Pennsylvania will always show all of Pennsylvania), while “Preserve scale” will maintain the same scale at all times (e.g., less of Pennsylvania might show when the map is displayed in a smaller space).
When should you use “Preserve extent?” When it’s important that the entire contents of the map’s focus area be visible to viewers across all screen sizes.
When should you use “Preserve scale”? When changing the map’s scale across different screen sizes might cause some disruptive behavior to the map’s purpose — for instance, maps that are using layers with scale dependency, or maps with carefully spaced symbology that might blend together at smaller scales.
_________________________________
While all these bells and whistles can be fun to experiment and play around with, it’s always important to remember that they each exist for a particular reason: to serve the purpose and function of the web map within the story or briefing that contains it. As long as you keep that in mind, you’ll be set up to create impactful narrative experiences using web maps and scenes in ArcGIS StoryMaps.
If there’s other functionality or customization that you’d like to see with web maps and scenes in ArcGIS StoryMaps, don’t hesitate to drop us a line using the in-app feedback form and select Direct product feedback from the drop-down menu to let us know how we can improve the product for your needs.
_________________________________
Cover photo by andreusK, © Adobe Stock.


Article Discussion: