ArcGIS Urban 1.1 has a set of new exciting features in store. Apart from export functionalities, we have also added a street-view mode as well as support for existing trees. Furthermore, you can now add space use types to your plans and import zoning types based on a zoning layer’s symbology.
Are you new to ArcGIS Urban? Skip the details and try it for yourself. You can now find four example cities ready for you to explore. We have also created a set of tutorial videos that will guide you through the sandbox cities and help you get to know the essentials about ArcGIS Urban.
Try ArcGIS Urban with the new example cities
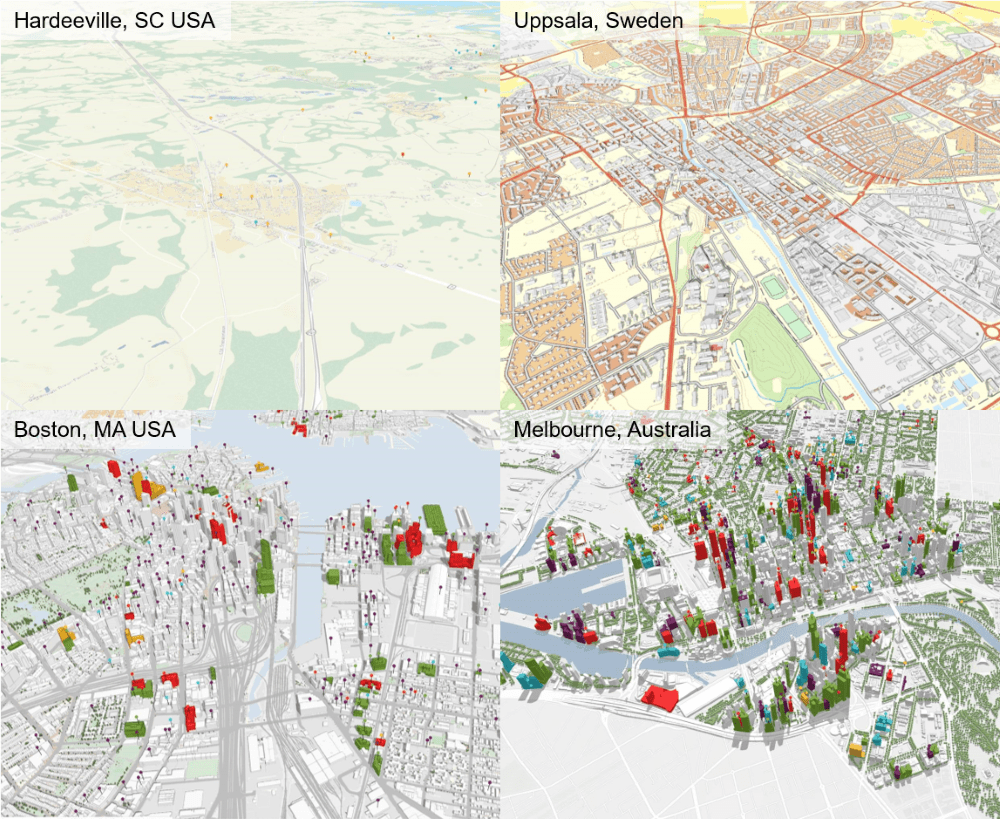
Starting with ArcGIS Urban 1.1, you can pick from four example cities (Hardeeville, Uppsala, Boston and Melbourne) available out of the box at start up. The example cities are a way to try out ArcGIS Urban without having to set up or prepare any data. They already have data available for you to explore and play around with.

The cities differ in character, location, size and the types of urban development challenges they face. When you select an example city, a new Urban model in ArcGIS Online is set up and the example data is copied to your content. This means that you can edit and play around the with the data as much as you like.
Street view
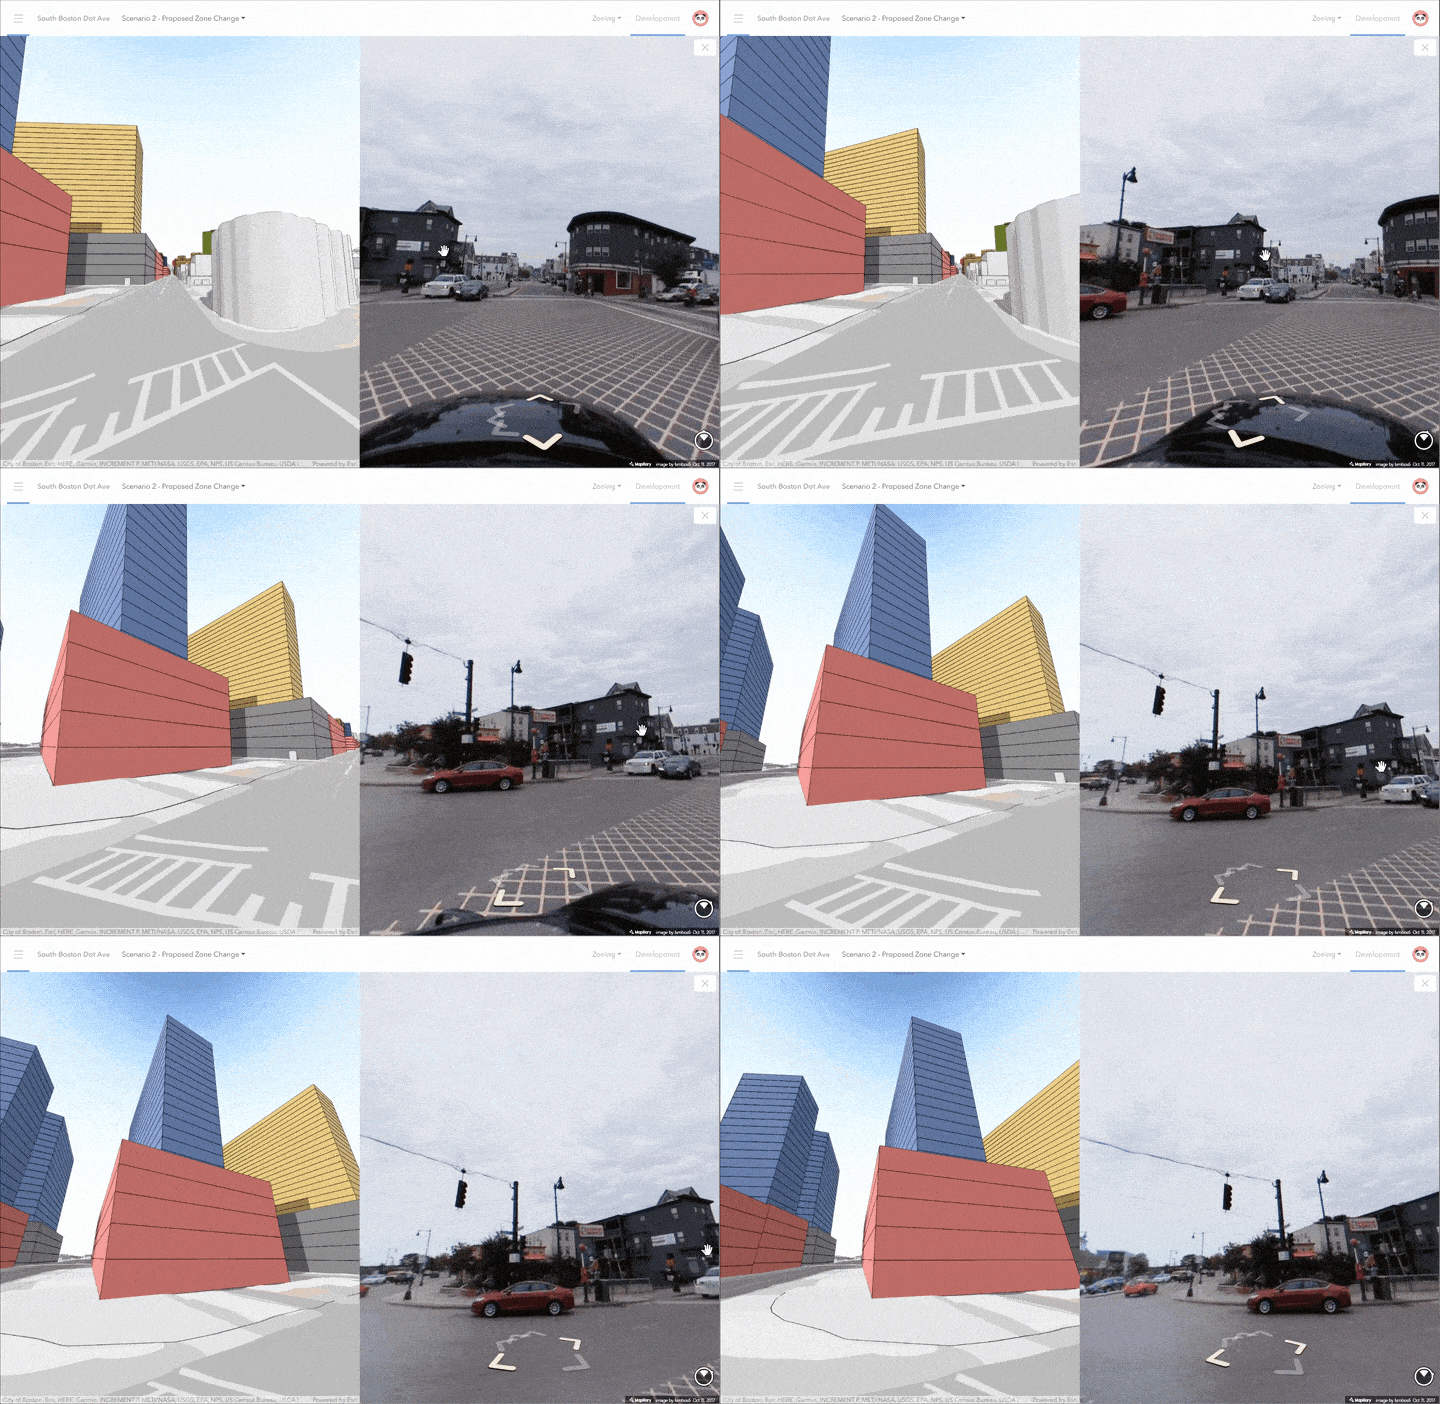
Pedestrian views are important in urban planning. In the new street view mode, you can explore your city from a street-level perspective. By using a split screen, you can compare the future of your city with what you can see today. The street view mode is available in the overview and in the plan editor.

Export to ArcGIS StoryMaps & co.
ArcGIS Urban 1.1 comes with new export functionality that enables you to consume and share the content you created in ArcGIS Urban to be used in other applications and tools.
Export capacity indicators to spreadsheet
Apart from viewing capacity indicators in the plan editor, you can now also export the calculated values to a spreadsheet. You can export all scenarios at the same time and get an overview of the capacity indicators for comparison, including population, households and jobs. Additionally, there is a breakdown of space use types and their respective gross floor area. The spreadsheet also includes all zoning types and the sum of the assigned parcel areas for each scenario. This new functionality allows users to create dashboards or use the values for reports.
Export plan scenarios to web scenes and web maps
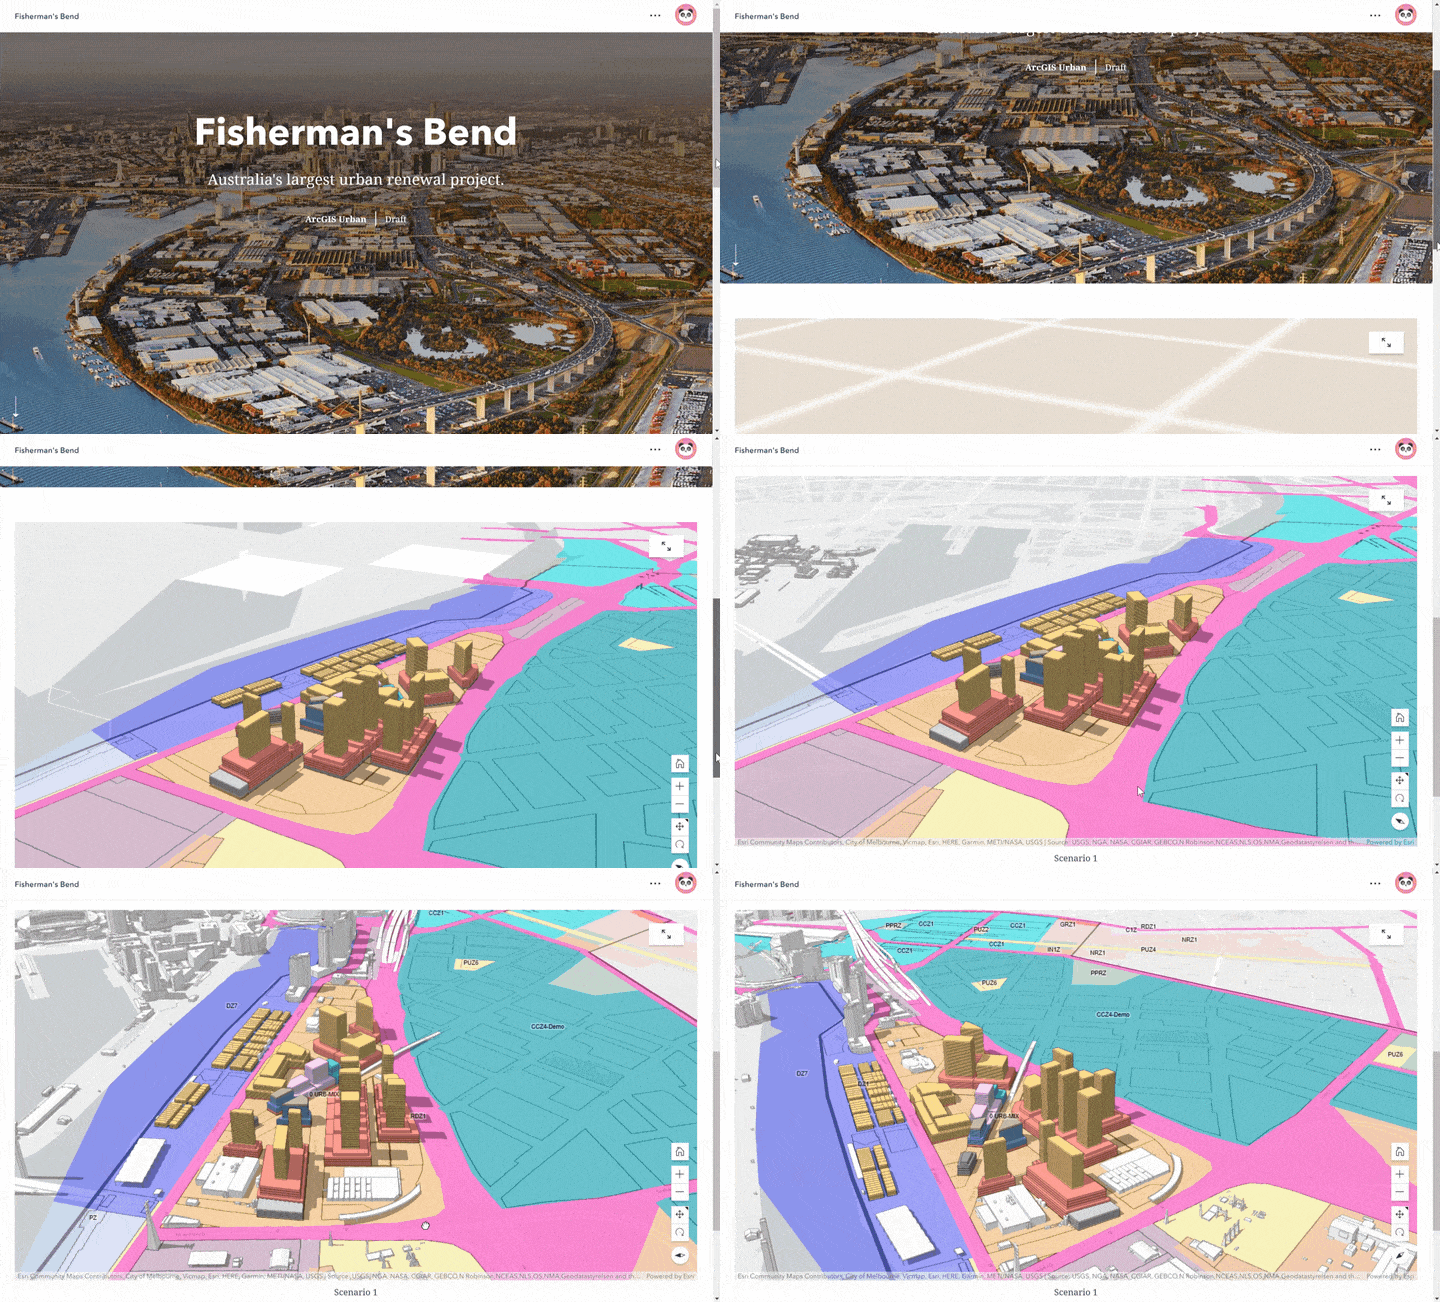
When using the new publishing workflow in the plan editor, you can select the scenarios you would like to make public. The data is exported as web scenes (3D) and web maps (2D), so you can open the scenarios in the SceneViewer or the MapViewer on ArcGIS Online. Also, you can use the data in ArcGIS StoryMaps and other web apps, e.g. by embedding a scenario for interactive exploring.

Publishing creates a separate feature layer replicating your scenario’s data that you can use in other design tools and software (for example ArcGIS Maps for Adobe Creative Cloud). You can find the exported webscene under design visualization for each scenario in ArcGIS Urban, or in your ArcGIS Online content inside the plan’s folder.
This functionality enables you to more easily use what you created in ArcGIS Urban across the platform. For example, you may want to publish a scenario of a redevelopment plan as a webscene to embed in a story map. The story map additionally explains the intent, goals, and strengths of the scenario to stakeholders. Or you may want to publish a scenario as a webmap for use in Survey 123 to collect structured feedback or to engage with in a public meeting.
Take a screenshot
With ArcGIS Urban 1.1. you can now capture beautiful, high-resolution screenshots as png images to use in your presentations and documents. The screenshots exclude all UI elements and give you a clean shot of your 3D scene in ArcGIS Urban.
Add your own Space Use Types to plans
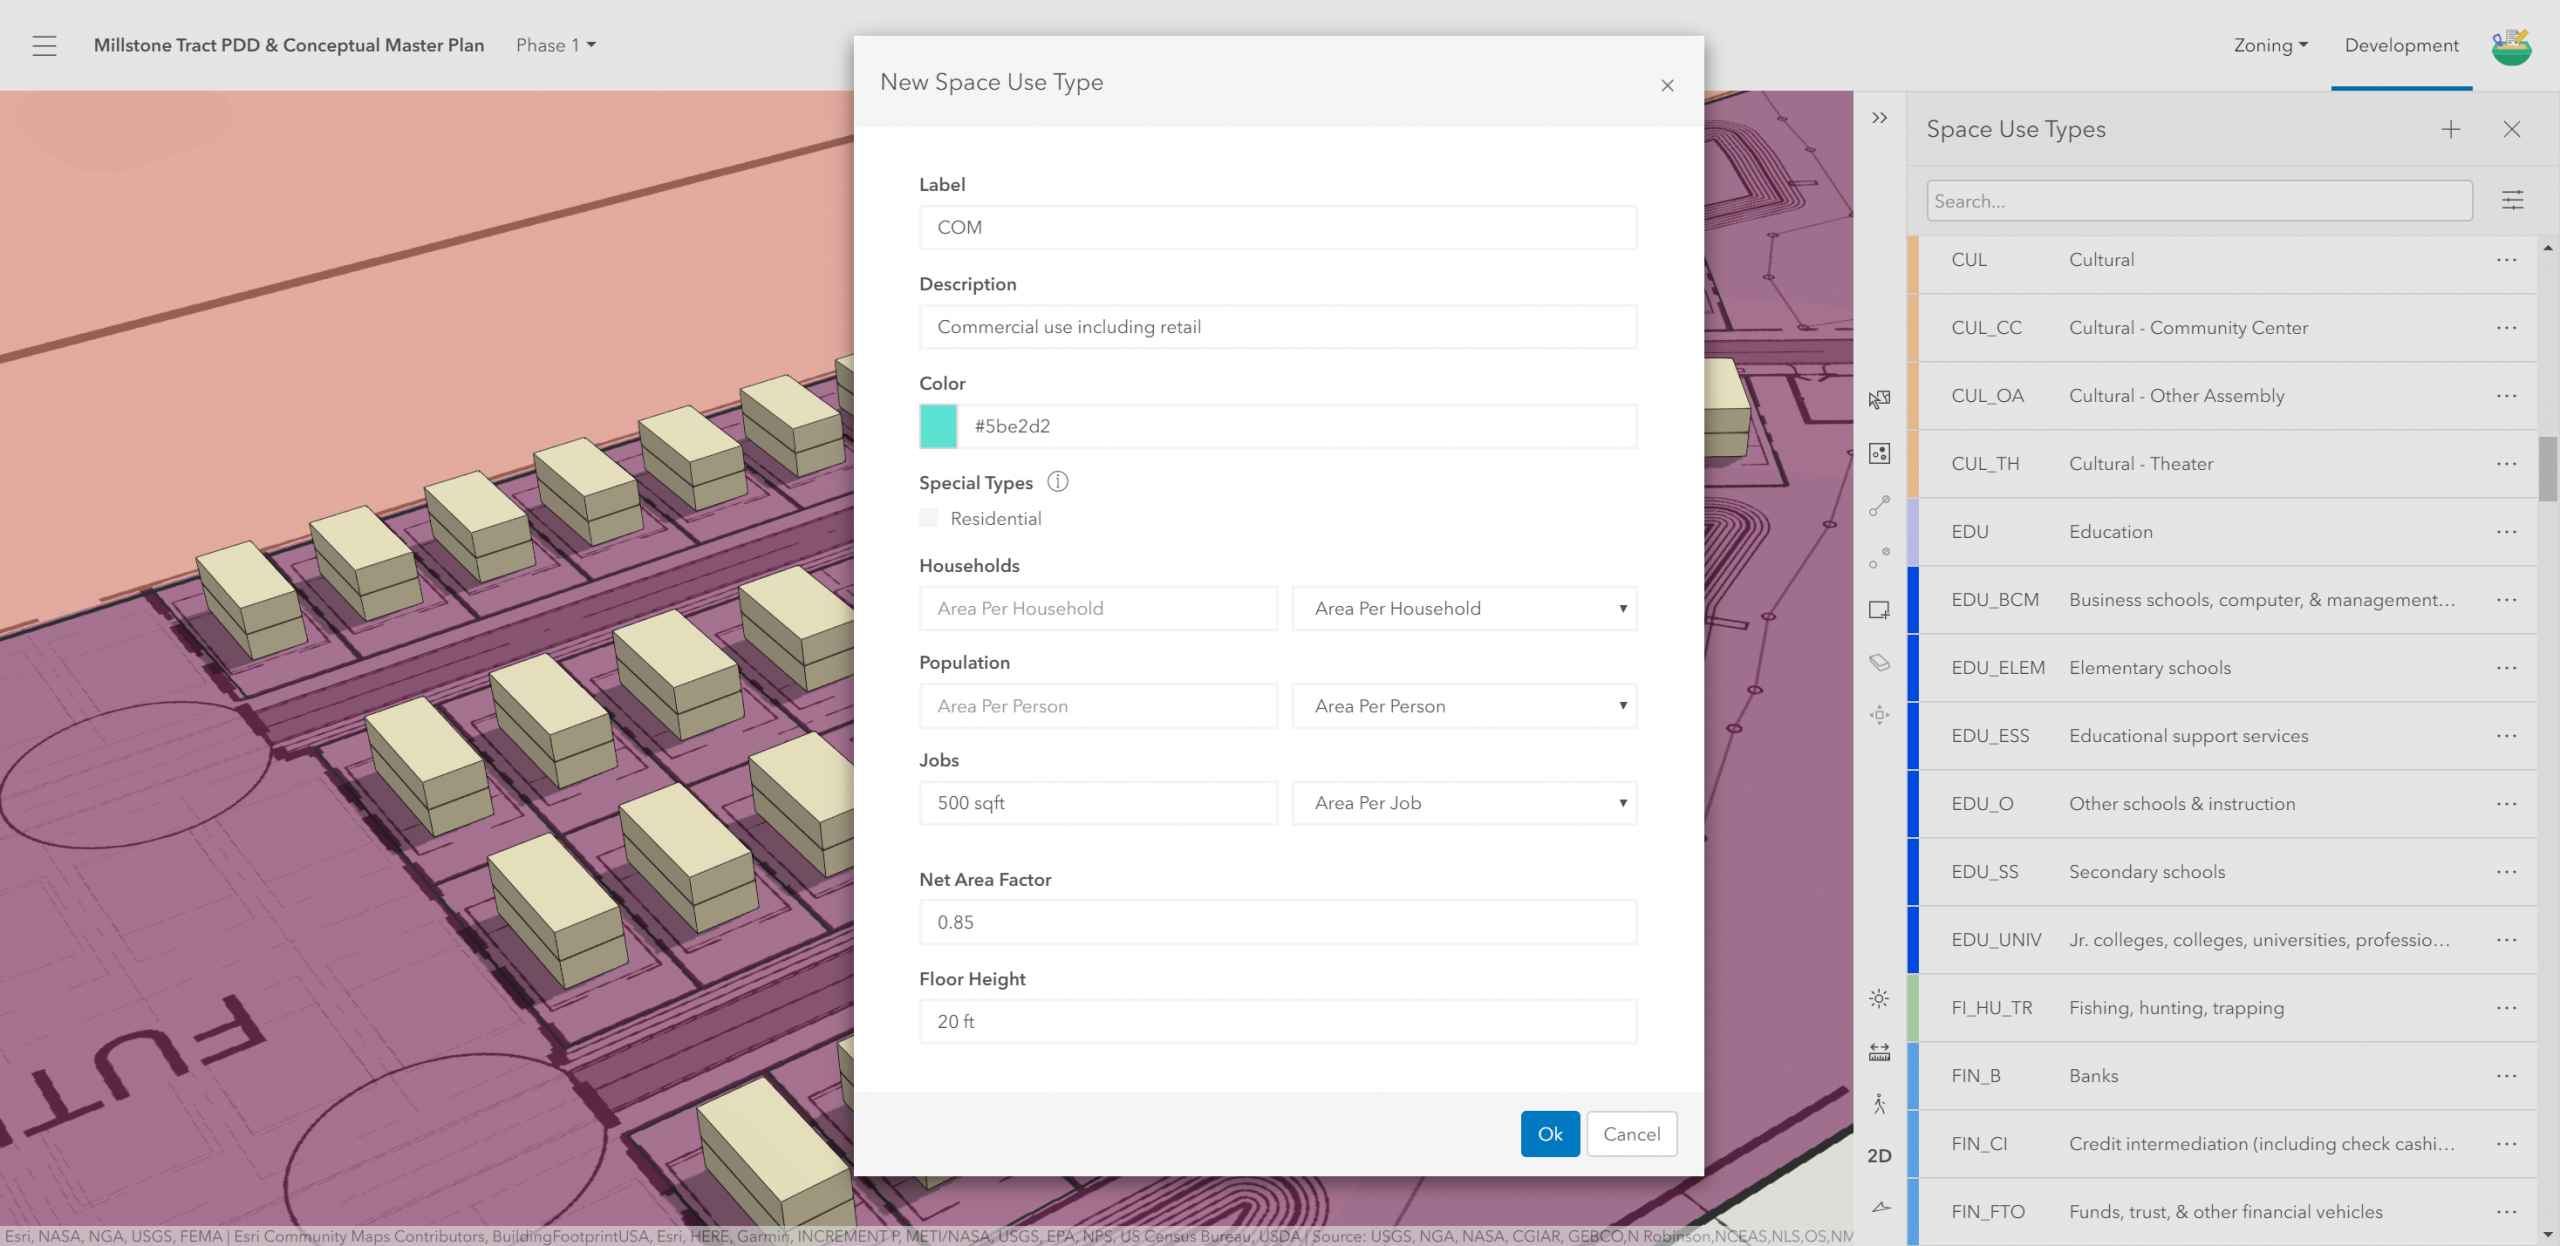
Another new feature which comes with ArcGIS Urban 1.1 are plan-specific space use types. You can now add and configure space use types within each plan and apply them to your proposed building types. Configurable space use types help to test out different assumptions, e.g. regarding the average area taken up by a person. You can then use them to build out different scenarios, e.g. a low, medium and high density scenario.

Simpler import of your zoning data
In the data manager, we added a way to create your list of zoning types based on the symbology of your zoning layer. Hence, you can import the zoning types from a feature layer and extract a list of unique zoning types including name, description and color.
Learn more
This is just a subset of newly available features. We have also added support for existing trees, improved the publishing workflow and worked on the data manager. Find the full list of new features with more details in the ArcGIS Urban 1.1 release notes.
Want to see these new features live in ArcGIS Urban? Schedule a demo or play around with it yourself in a trial version.


Commenting is not enabled for this article.