The ArcGIS Utility Network is supported in the ArcGIS API for JavaScript since the 4.20 release. With the 4.22 release, the UtilityNetworkTrace widget is now provided to trace how resources flow through a utility network.
Introducing the Utility Network Trace widget
The Utility Network Trace widget can be used to execute one or multiple traces concurrently to streamline workflows. It leverages the named trace configuration capability, which allows you to add and store complex traces in a utility network, and share them across an organization through web maps. The trace parameters are preset for each specific trace, making the widget easy to use.
Place starting points and barriers, and select a trace to run from a customized list of traces.
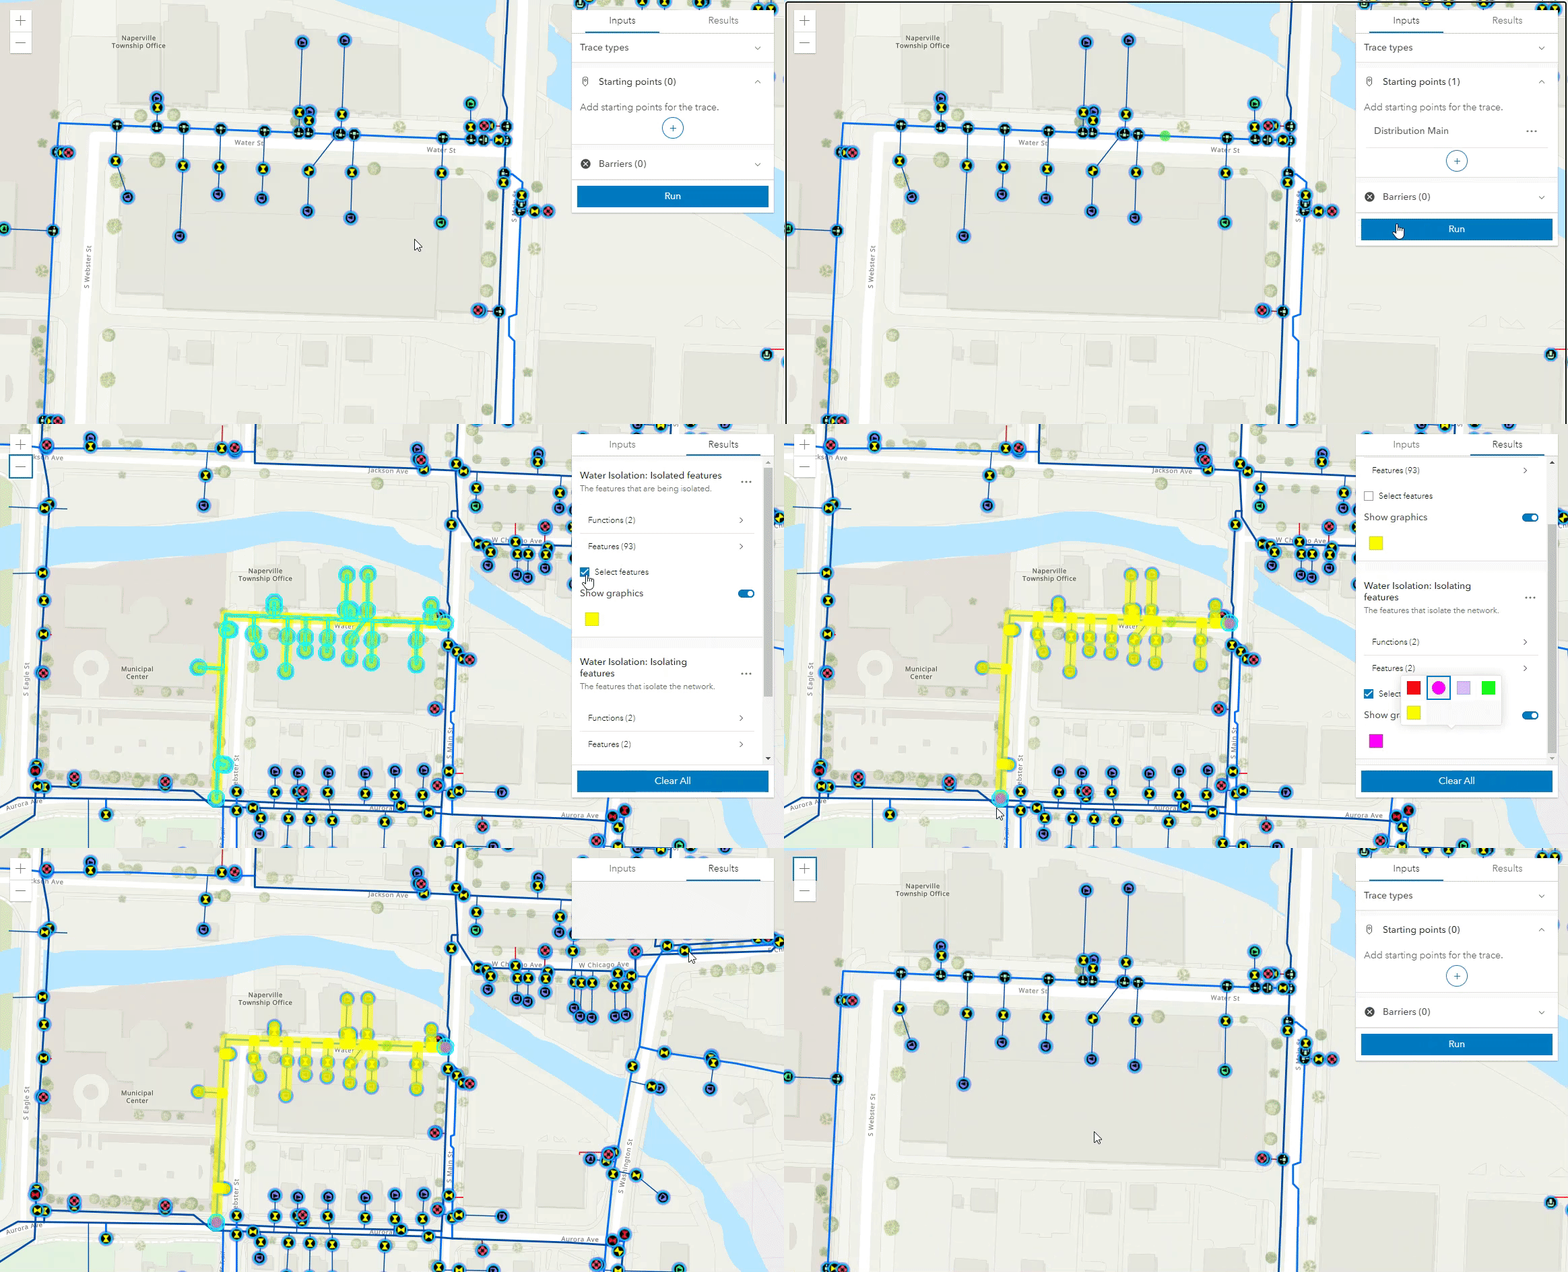
Check out the live sample for this widget: UtilityNetworkTrace widget sample code
Get Started
At a minimum, the widget requires ArcGIS Enterprise 10.9 and a Utility Network version 5 created with ArcGIS Pro 2.7 (or later). The ArcGIS Utility Network user type extension is required to run traces on feature services published to Enterprise 11.1 or earlier.
Step 1. Publish a feature service with the utility network
First you need to create a utility network and publish a feature service using an Enterprise deployment (10.9 or later). Follow the steps for utility network creation and configuration.
If you need sample data and step-by-step guidance to publish your first utility network service, deploy one of the ArcGIS Solutions listed here.
Step 2. Add and share named trace configurations
Once you’ve published the feature service, you can use ArcGIS Pro to trace the utility network and add named trace configurations.
Then, add your utility network feature service to a map, activate the trace configurations to share in your web map, and publish the map to your organization’s portal.
Step 3. Create an application
To add this widget to your web application using the ArcGIS API for JavaScript, load the web map you published and add the widget to the MapView. See the code example below:
// Load the web map with the utility network
const webmap = new WebMap({
  portalItem: {
    id: "86aeebb28ec24932bad52ff851b517b1"
  }
})
const view = new MapView({
  container: "viewDiv",
  map: map,
});
// Create a new instance of the widget
const unt = new UtilityNetworkTrace({
  view: view
});
// Add the widget to the view
view.ui.add(unt, "top-right");
The web map must contain a utility network feature service and be published with named trace configurations.
The utility network feature service must be secured since the ArcGIS Utility Network user type extension is required for users who wish to run a trace on the web service.
Use the Utility Network Trace widget
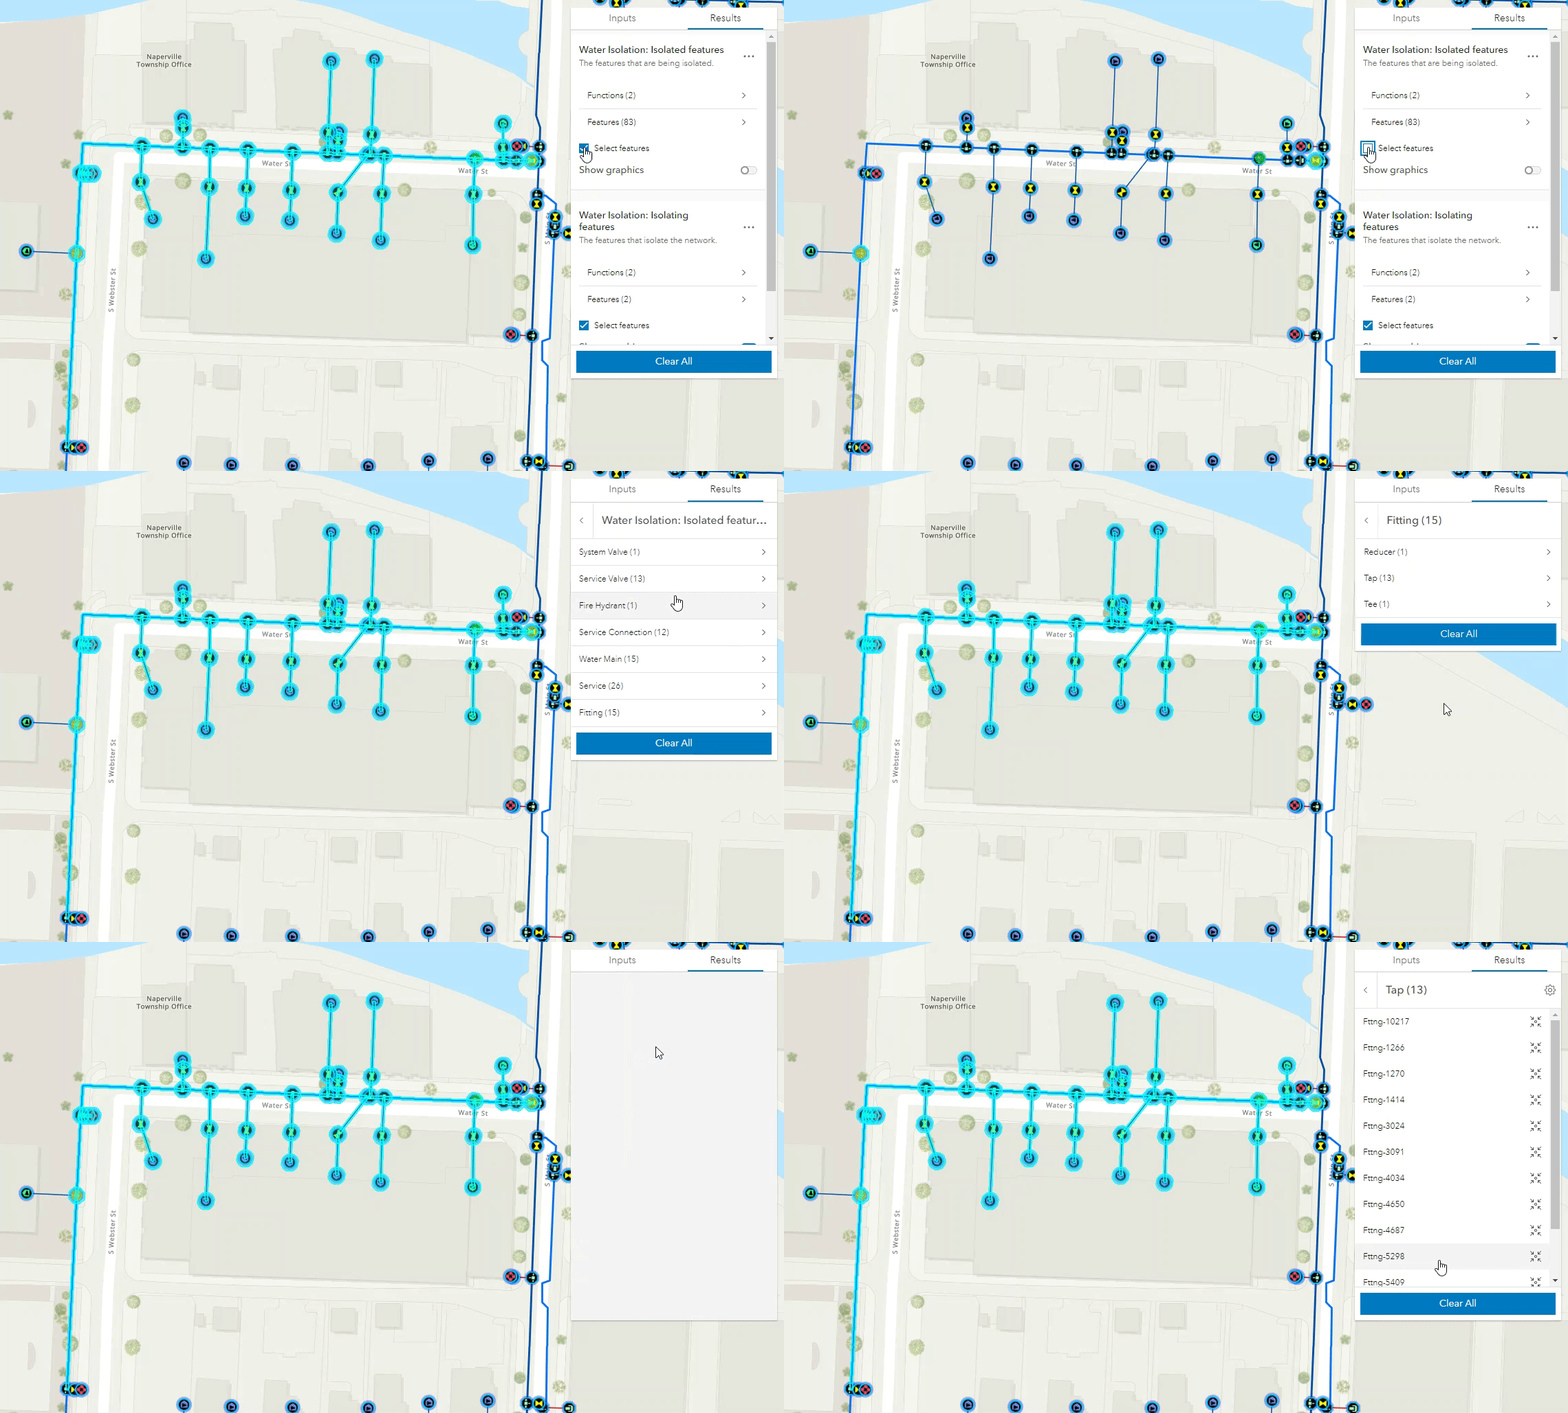
Water Isolation example
Use case: I need to isolate the impacts of a water leak to minimize service interruptions to customers. I will identify which system valves need to be closed to stop the flow of water, and which customers will be affected by the ensuing water outage.
To do this, I can trace a utility network feature service for water distribution.
Step 1. Select trace types
For this use case, the widget loads with two traces already selected in the Trace types dropdown. These two traces are different configurations of the Isolation trace. One of them will return the isolating features (the system valves that need to be closed to stop the flow of water), and the other trace will return all the isolated features (the features where the water will stop flowing).
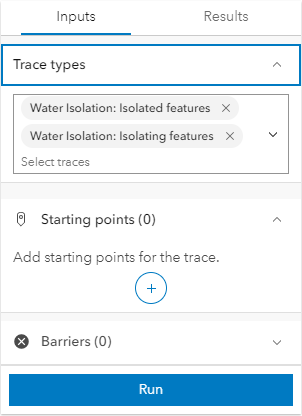
Note: To preset trace types in the widget for your applications, define them in the selectedTraces property using the trace configuration’s global IDs.
// Define the preset trace types
const unt = new UtilityNetworkTrace({
  view: view,
  selectedTraces: ["{E8D545B8-596D-4656-BF5E-16C1D7CBEC9B}", "{04F8E462-F050-42C0-9E07-79D2BA7677CE}"]
});
Step 2. Add starting points
I will add a starting point at the leak location since this is where I need to stop the flow of the water, so the repairs can be made.
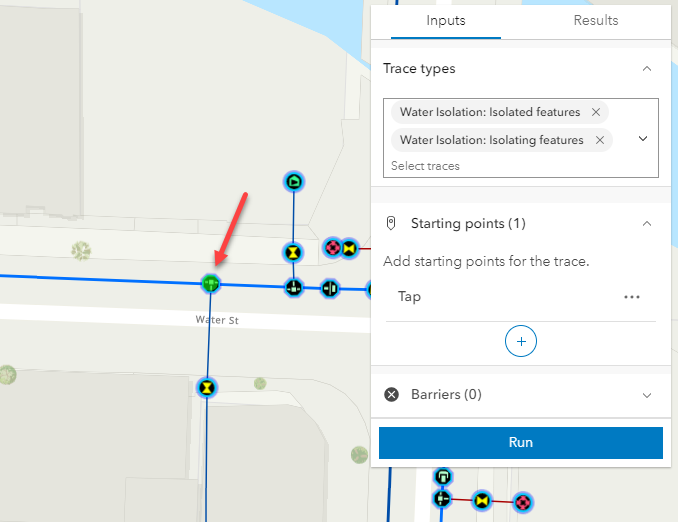
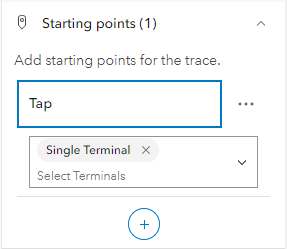
If the feature has terminals, you can change which terminal is used to start the trace. There is only one terminal for this feature, which is the default terminal that will be used.
Step 3. Add barriers
Optionally, set features in your network as barriers for a trace. For example, a section of the water network is closed due to another field team doing work in the area to install a new system valve. I can place a barrier to exclude that part of the network in my trace results.
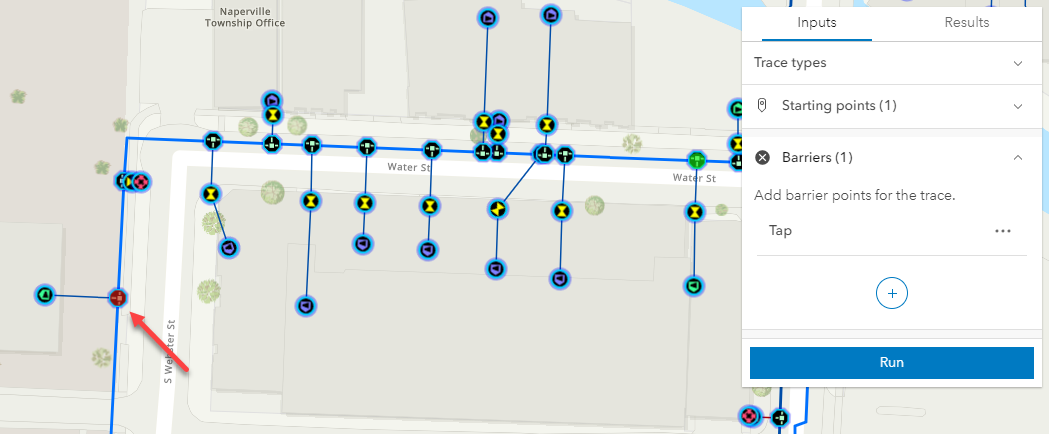
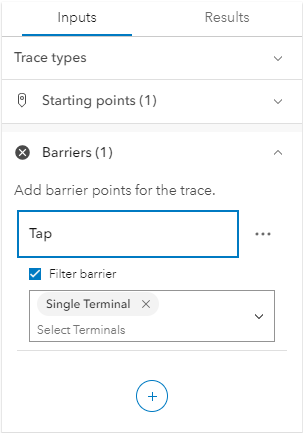
These feature barriers can also be treated as filter barriers to first discover the subnetwork controllers before applying the barriers.
Step 4. Run the trace
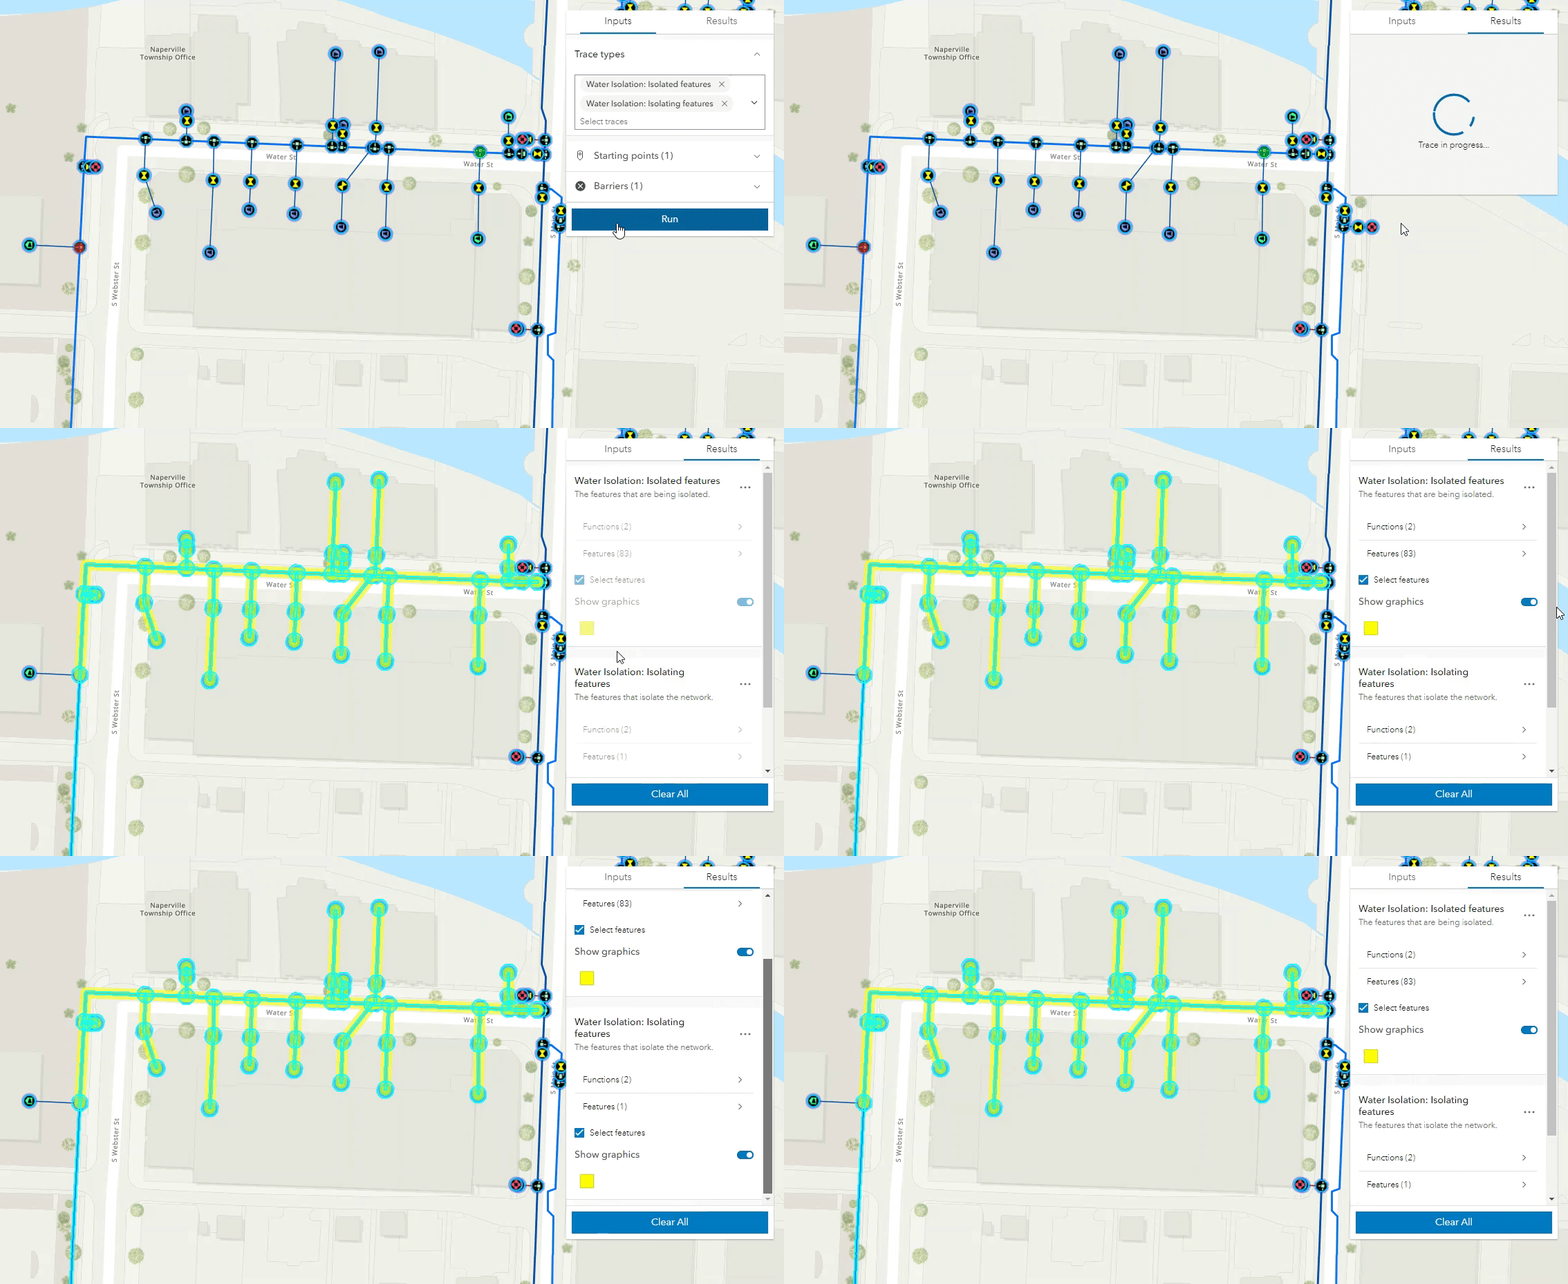
Once I’ve selected the trace types and set starting points and barriers, I can click Run to execute the traces. All traces are run concurrently and results are returned as the traces are completed. The trace results can be displayed as a selection, graphics, or both.
Step 5. Explore the trace results
The type of results for a trace operation can be defined with the Result Types parameter when adding a named trace configuration to your utility network feature service. The Aggregated Geometry and Selection result types can be specified independently or concurrently to generate output geometries and create a selection set for a trace.
If Aggregated Geometry is specified, the results from the trace are aggregated by geometry type and displayed as a graphic layer on the map. Toggle the graphic layer on or off and change its display color.
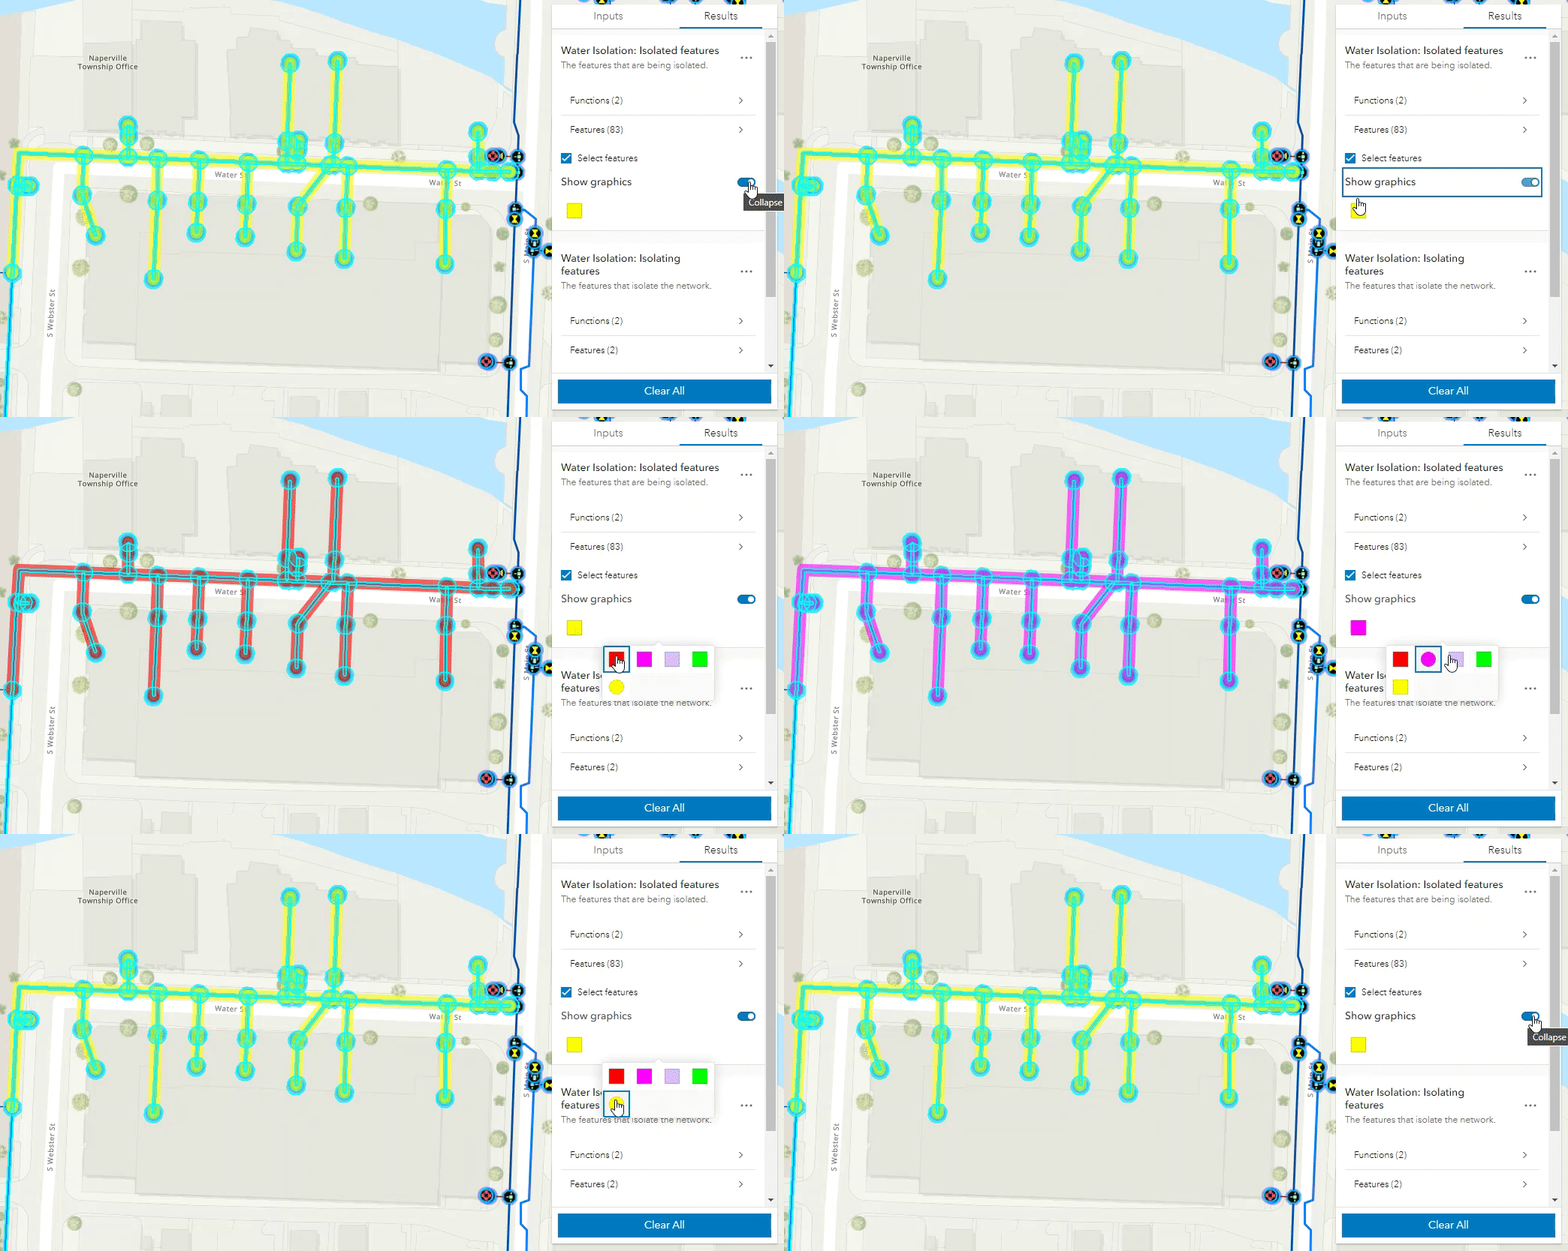
If Selection is specified for the result type in the named trace configuration, then the results for the trace are returned as a selection set. Also, this is the default behavior if no result type is defined in the trace configuration. Use the checkbox to select and clear the features on the map and explore the list of selected features organized by asset group and asset type.
Note: The list of selected features is only available if the showSelectionAttributes widget property is set to ‘true’ for this application.
Upstream and Downstream example
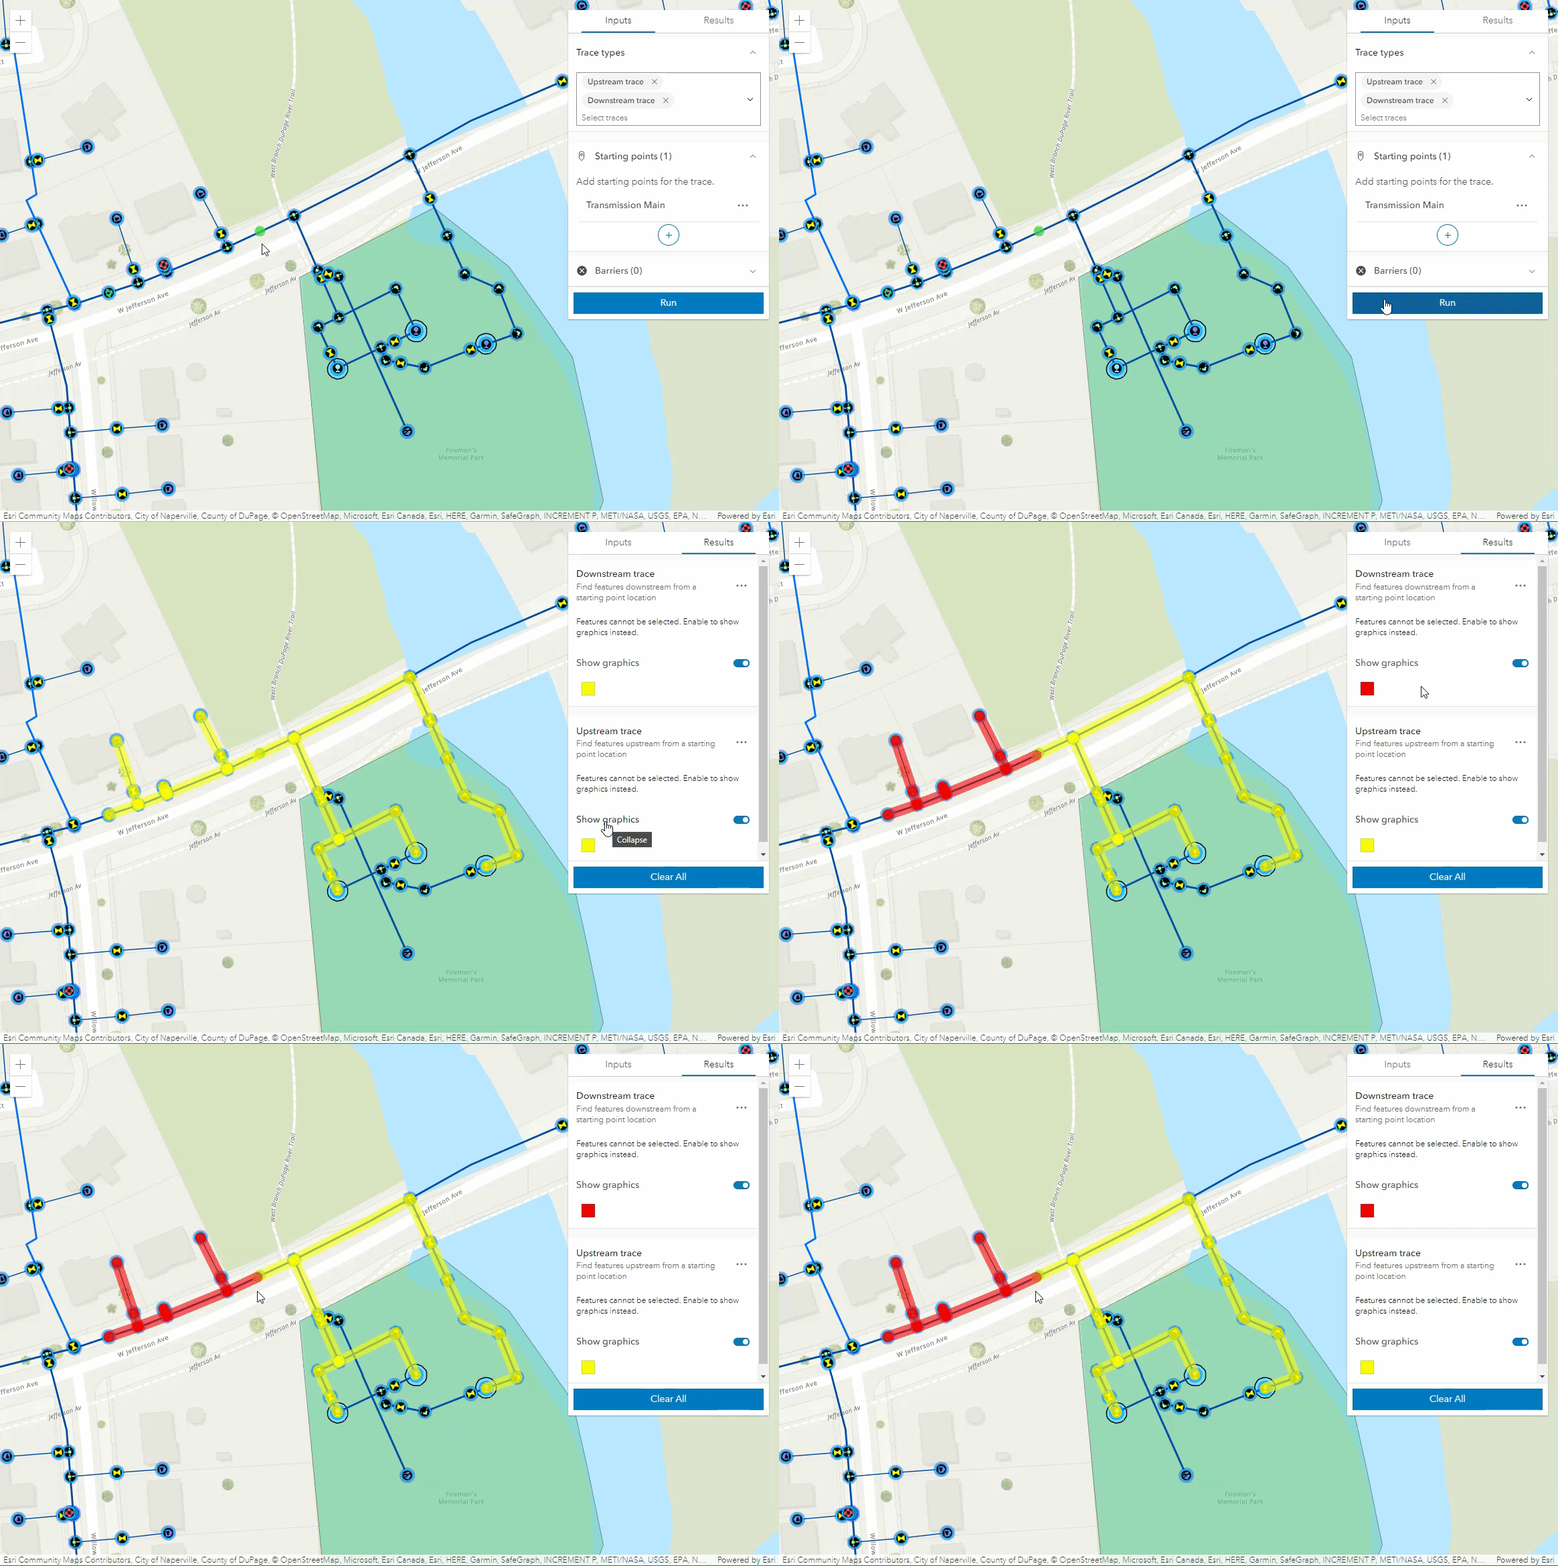
Following similar steps as in the water isolation example above, I can run different trace types such as Upstream and Downstream, and quickly visualize the results using different graphic colors.
Ready to give it a try? Add the widget and a web map with named trace configurations to your web application, and leave no trace behind!


Article Discussion: