Skip to Content

Solid Earth Science

Geospatial is a force multiplier for the science of Earth's surface and subsurface

Science is the basis for fighting climate change together. Esri is committed to providing resources to help create a sustainable future.

Access climate change overview

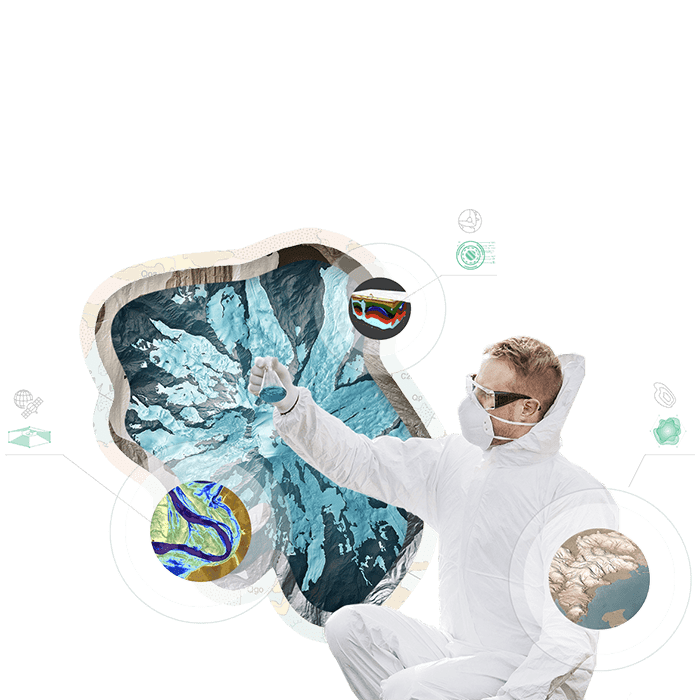
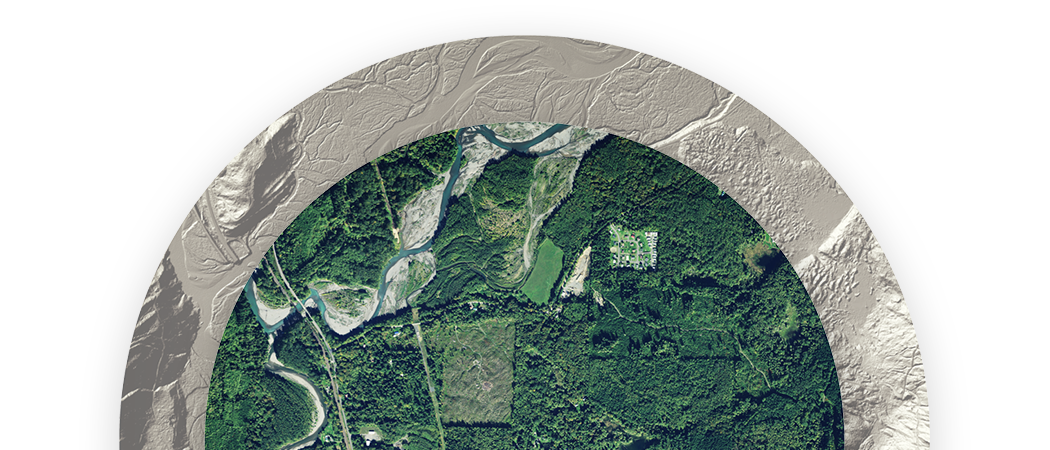
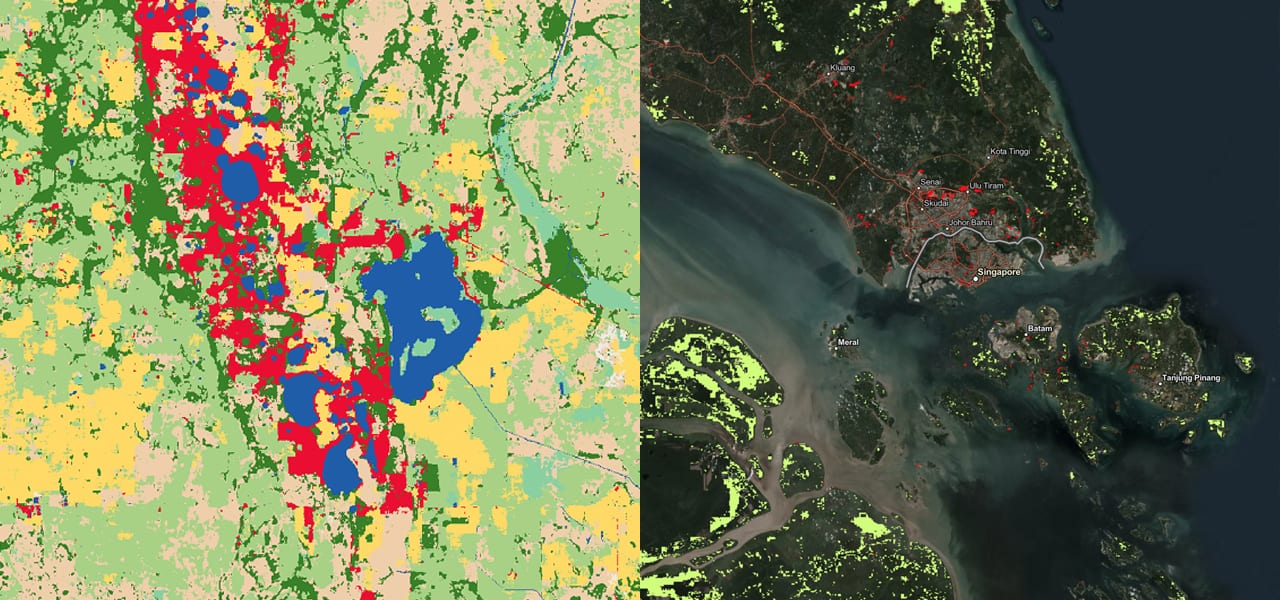
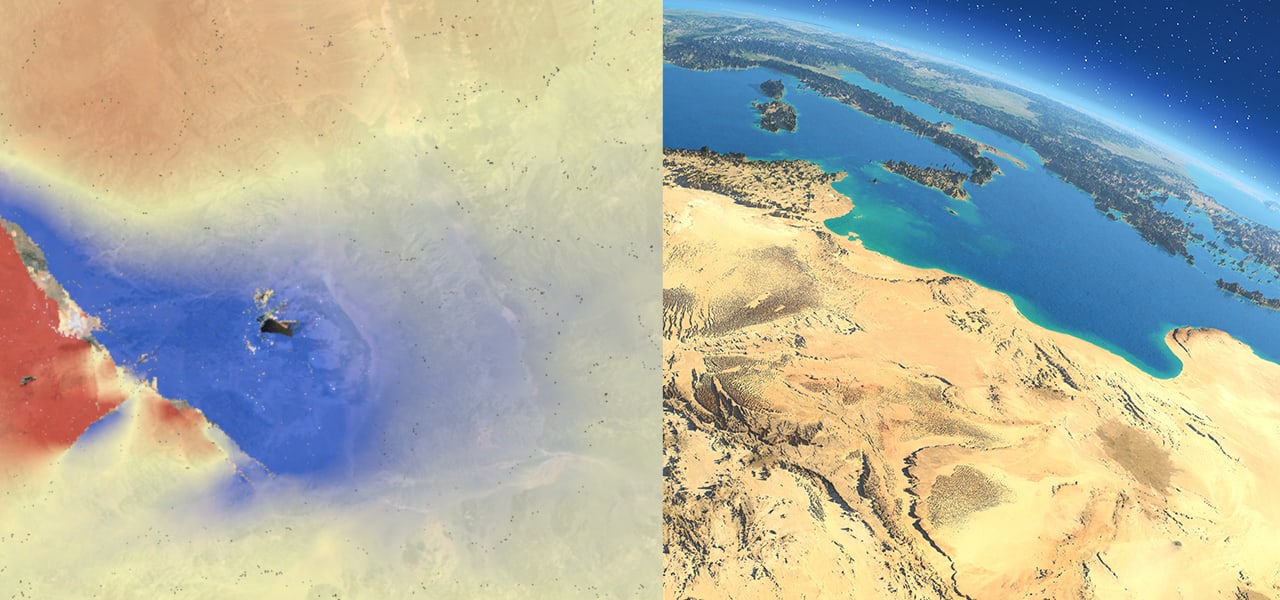
By way of reliable, verifiable spatial analysis and visualization, GIS helps solid earth scientists, such as geologists, ecologists, foresters, agricultural scientists, and terrestrial conservation biologists, answer a myriad of questions about spatial patterns and what process is responsible for those patterns. GIS is also a modern platform for the open sharing of data and compelling science communication at many scales: individual researchers, lab workgroups, multiple departments, multiple universities, university-to-agency collaborations, and citizen engagement.

The earth beneath our feet

New capabilities in ArcGIS Pro and ArcGIS API for Javascript enable geologists and geophysicists to view and slice lithology and cross sections for a better understanding of the subsurface.

Explore the live app

World ecosystems

World Ecosystems are a massive biophysical stratification of terrestrial Earth at an unprecedented resolution of 250 meters. The result is a first-ever global map of distinct physical variables and land cover, all in support of ecosystem services assessment.

A graphic of a contour map with a stretch of small rocky islands surrounded by still pale blue water

Experience the World Ecosystem apps

Try our ecological web apps for exploration and analysis.

View maps and apps

Open-access journal article via ScienceDirect

An assessment of the representation of ecosystems in global protected areas using new maps of World Climate Regions and World Ecosystems.

Read the article

Open journal article via Wiley Online Library

Modeling global Hammond landform regions from 250‐m elevation data.

Read the article

Open-access journal article via BioOne

A New High-Resolution Map of World Mountains and an Online Tool for Visualizing and Comparing Characterizations of Global Mountain Distributions.

Read the article

Land cover 2020/2050

A better understanding of how our world has changed provides insight into building a more sustainable and prosperous future. Use these remarkable resources—at unprecedented global resolution—to analyze both present and historic land cover, observe changes over time, and forecast likely growth patterns.

Explore 2020 land cover
Explore 2050 land cover
Two maps showing areas in Southeast Asia that should be prioritized for conservation

NASA Disaster Response

Responders need reliable, accessible, and discoverable data and products for analysis in each stage of the disaster life cycle. NASA's Earth Science Disasters Program and Center for Climate Simulation have developed portals and apps providing hazards data to many audiences. These resources help drive effective response, recovery, and resilience during and after natural hazards.

See NASA's disaster maps
See NASA's landslide reporter
A graphic of sandy hills with a small gulf leading into deep blue waters, with the left half of the image overlaid with a blur effect and a scattering of map points

Washington Geological Survey

Geologists in Washington State are using GIS to study current landscapes, uncover the history of volcanic eruptions and ice-age floods, manage mineral and fossil resources, and identify areas at risk from landslides and tsunamis. 

Explore the geology portal
View supporting resources
A graphic of a computer monitor displaying a colorful heat map with a small ,magnified section of it projecting outward in a circular border

National Water Model

This public-private partnership with Esri and the federal National Water Center forecasts stream flow at over 2.7 million locations across the US to deliver impact-based decision-support services. Street-level water information and guidance from tools such as flood maps serve as the foundation for additional private sector water services.

Learn about the model
View supporting resources
A graphic of a laptop displaying a 3D model of a suburban housing development in white, red, and blue, overlaid with several small legends of analysis options

Polar Geospatial Center

The Arctic and Antarctic are both leading indicators of climate change. Shifts that will eventually affect the entire planet are among the most readily visible there, and understanding these shifts is crucial. Esri partners with the University of Minnesota Polar Geospatial Center to share rich elevation models with the government and scientific communities.    

Visit the website
See Polar Geospatial web apps
Two overlapping map displays, each with a blue contour map alongside legends of analysis options, overlaid with a small round polar map

Unprecedented Map of Biodiversity Importance

Through a landmark collaboration, NatureServe is developing an unparalleled tool for identifying the places most critical for conserving at-risk species in the contiguous United States. With support from Esri, The Nature Conservancy, and Microsoft, NatureServe and its network of state natural heritage programs are modeling habitat for more than 2,600 at-risk, taxonomically and ecologically diverse species. These complex data are being synthesized into a map of biodiversity importance—a dynamic, transparent, and repeatable guide to effective conservation decision-making.

Read more
A pale green and white contour map overlaid with another map showing regions colored in green and brown, and a closeup image of a small yellow and brown bird

Story map

The Anatomy of Super Volcanoes

This project mapped ignimbrite flows in the Andes from data collected in the field or previously published.

See the story map

Our collaborators in solid earth science

Previous
Next

Special product licenses for scientific organizations