Skip to Content

ArcGIS Insights Case Studies

  • A drone in flight

    Drone pilots reduce risk while improving safety

    Airspace Link combines data and technology to enable safe and compliant drone activities for clients.
  • Data-driven marketing at Brandman University

    Brandman University uses ArcGIS Insights to analyze their data and improve their marketing campaigns.
  • Multiple rows of ventilators

    USACE improves resource allocation and planning

    The United States Army Corps of Engineers (USACE) uses ArcGIS Insights to forecast COVID-19 pandemic peaks and efficiently distribute resources.
  • A nighttime view of city buildings in Akron, Ohio

    Akron boosts data transparency during pandemic

    The City of Akron, Ohio uses ArcGIS Insights to enable real-time access to personnel data and streamline operations for city administrators.
  • A person with wireless headphones on, writing notes with a computer next to them

    Students use ArcGIS Insights for virtual classes

    Villanova University students use Insights to create more than a dozen different types of interactive graphs, maps, charts, and tables.
  • A large broken pipe, also known as a watermain, with water spraying out of it into a drainage ditch

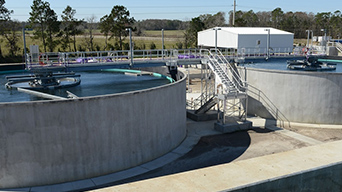
    Region of Peel improves water asset management

    The Region of Peel, Ontario uses ArcGIS Insights to analyze water main breaks data for maintenance planning and future expenditure estimates.
  • Workers moving N95 mask boxes to and from a FedEx van

    Direct Relief solves medical supply chain problems

    Aid organization Direct Relief uses ArcGIS Insights to model net readiness for COVID-19 around the country.
  • Woman outdoors wearing an N95 mask with a grocery cart

    State of Georgia forecasts during a pandemic

    Georgia state officials use ArcGIS Insights to forecast the number of COVID-19 patients and analyze the health care capacity of state hospitals.
  • Small porcelain home on top of a stack of gold coins and a magnifying glass

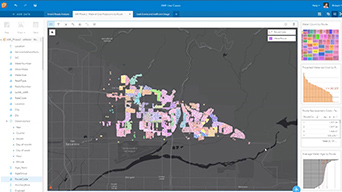
    Lee County improves property valuation

    The Lee County Property Appraiser uses ArcGIS Insights to enhance the property valuation process with improved data analysis and collaboration.
  • Police car with blue flashing siren

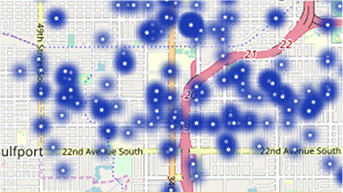
    Altoona Police reduces crime with analytics

    Altoona Police uses ArcGIS Insights to effectively allocate resources and personnel and conduct crime analysis.
  • Downtown area with high rise buildings and office buildings

    Topeka improves organizational transparency

    The City of Topeka uses ArcGIS Insights to increase organizational transparency by giving the public an easy way to access city data.
  • Man and a woman in an office looking at a computer monitor

    Washington State enhances service

    The Washington State Department of Labor & Industries (L&I) uses ArcGIS Insights to enhance its staff allocation process.
  • Street grid map with scattered blue dots

    St. Petersburg Police modernizes policing

    The St. Petersburg Police Department in Florida uses ArcGIS Insights for better policing with data-driven maps, dashboards, and analysis.
  • Forest wildfire with trees and orange and yellow flames

    Direct Relief provides wildfire aid

    Direct Relief uses ArcGIS Insights to analyze disaster data and more efficiently supply resources to health care agencies and first responders..
  • Red fire hydrant with water shooting out

    View analysis models by Cityworks

    Cityworks uses ArcGIS Insights to help users analyze data, providing greater insights into asset management strategies, tactics, and operations.
  • Large concrete vat at a water treatment plant

    Florida utility company improves operations

    St. Johns County Utilities in Florida enables its workforce to collaborate and make data-driven decisions with the help of ArcGIS Insights.
  • Beach crowded with people and multicolored buildings along the shoreline

    Horry County predicts business trends

    Horry County, South Carolina, uses ArcGIS Insights to identify patterns and make predictions on the success of tourist-based businesses.
  • Blue colored map with statistics and graph

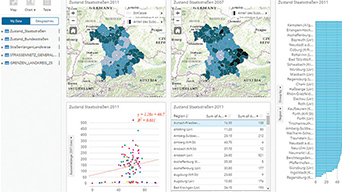
    Bavarian agency manages road infrastructure

    Germany's Bavarian State Building Administration uses ArcGIS Insights to plan, build, operate, and maintain its transportation infrastructure.
  • Cobb County improves health and wellness

    Cobb County, Georgia, uses ArcGIS Insights to analyze data and uses findings to improve health and wellness services.
  • Water company improves data analysis

    The East Valley Water District uses ArcGIS Insights for advanced data analysis.
  • Body of water and green plants in a wetland

    Chesapeake Conservancy enhances conservation

    Chesapeake Conservancy utilizes ArcGIS Insights to analyze data and uses findings to guide conservation and outreach efforts.
  • Two people biking on a trail through the woods

    French council informs decisions with data

    The Indre-et-Loire Committee Council in France uses data analysis findings from ArcGIS Insights to plan community development initiatives.
  • Four windmills and a blue sky with white clouds

    Aegean Energy streamlines data collection

    Aegean Energy Group, wind and solar energy developers, uses ArcGIS Insights to improve data collection, analysis, and reporting processes.
  • Suburban houses nestled in green trees

    Municipality supports economic development

    The Municipality of East Hants in Canada uses ArcGIS Insights to gain actionable information from data to craft an economic growth strategy.
  • Opelika Utilities analyzes meter readings

    Opelika Utilities identifies hundreds of nonoperational meters and enough water loss to merit a net gain of $25,000 per month in revenue.
Previous
Next

Have questions?

Chat now

Begin a conversation online.

Start chat

Give us a call

Talk over the phone.

1-800-447-9778
(United States)
Outside the United States