Every year, students around the world push the boundaries of geographic information system (GIS) technology and bring discovery to life. This year, one former student’s award-winning work is helping us understand something as old as flight: how birds traverse the world.
Dagmara Pasiak, a former geomatics master’s student from ETH Zurich, was recognized for her project, Investigating Bird Movement with an Interactive 3D Web Map. Her study blends spatial analysis, 3D web design, GPS tracking, and ecology to reveal patterns in avian migration and behavior.
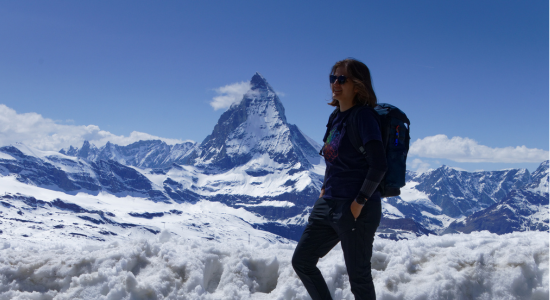
“I was always fascinated by visualizing movement in time. I love hiking, traveling, and wildlife photography . . . GIS was somehow the thing connecting everything I was doing,” said Dagmara when discussing the inspiration behind her project.
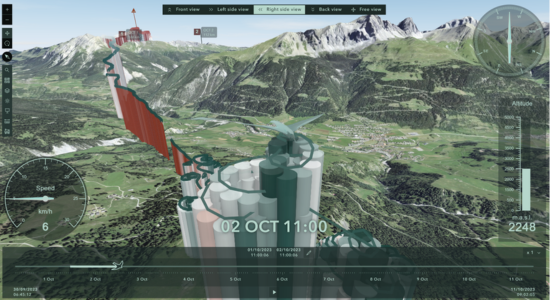
Through extensive research and collaboration with experts, Dagmara created an interactive 3D GIS web application that provides a multidimensional data exploration experience for behavioral ecologists studying bird movement across space and time. Rather than building her mapping framework from scratch, the foundation of her project was built with ArcGIS Maps SDK for JavaScript.
For her application to render large tracking datasets, visualize complex patterns, and offer an intuitive user experience to explore temporal data and bird behavior, Dagmara used a suite of ArcGIS tools. She paired the SDK with Calcite Design System components to construct the interface and incorporated layers from ArcGIS Living Atlas of the World to offer geographic context. Along with this, she also used the SDK’s Charts components and the Elevation Profile component to let researchers examine speed, altitude, and terrain together.
One of the key features of the application is its Explore mode, which allows users to easily generate and interpret migration data through visualizations. Designed for accessibility, her application makes scientific findings easier to communicate to diverse audiences, such as conservationists, policymakers, and the public. By offering a new dimensional perspective for visualizing data, her application transforms complex scientific knowledge into a geographic story anyone can follow.
After studying for her bachelor’s degree in Poland and then abroad for her master’s in Switzerland, Dagmara joined the Esri Research & Development Center in Zurich as a software development intern. After earning her master’s degree, during which she worked on her project, she transitioned into a full-time role as a product engineer, turning her passion for 3D mapping and visualization into a successful career.
In this Q&A, Dagmara shares her GIS journey, the inspiration behind her project, and how pursuing her personal passion helped launch her career in the geospatial industry.
Q: What got you interested in GIS?
A: For my bachelor’s, I studied geoinformatics, and then for my masters, geomatics . . . I didn’t know the field existed before scrolling through possible degrees while searching for my bachelor’s. I was always interested in nature and maps, and it combined my passions.
Q: What inspired your project?
A: The idea emerged after my bachelor’s thesis, when I really loved working with track data. When I hike, I always make maps of my own tracks with my Garmin. I was fascinated by visualizing movement in time . . . Then, I thought, How could I make this more applicable for scientific importance in terms of conservation and helping nature?
Q: What did you create?
A: I wanted to create a tool that would help scientists answer questions in what’s called movement ecology . . . I wanted to understand how 3D GIS can help us better understand the movement of birds . . . We have the best data on big birds, like raptors. You need a large animal to carry a rechargeable tracking device . . . The data from honey buzzards is perfect for testing the app, as you can follow them with up to a meter of resolution while they soar and cross all different types of ecosystems and weather conditions during the migration.
The app is not only for the GIS field. I want others to use it to gain more insight into animal behavior.
Q: Where did collaboration play a role in this project?
A: It was thanks to the help of a behavioral ecologist at Max Planck Institute for Animal Behavior. She gave me insights into what I needed and access to the data . . . I had one supervisor from my university, who was more on the project structure and cartography side, in terms of research. Then I had one from Max Planck, on the animal behavior side, making sure the ecology knowledge was applied correctly. And then I had one from Esri, making sure the technical side and web cartography were applied correctly.
I really recommend asking as many people as you can who are willing to help. Finding people from the beginning who are genuinely interested in what you’re doing was one of the most important parts of the project. Getting data and connections takes a lot of emails, so don’t get discouraged and know it takes time and patience.
Q: What was your biggest takeaway from the project?
A: I think web GIS has a huge potential to bring [information] to people and make it easy to digest. That was the intention of the app. It brings all the data together in one place, so you don’t have to spend hours downloading and processing it. This way, you can check out the birds’ tracks along the geographical context, like the terrain, light conditions, weather, and land use.
Q: What did it mean to you to be recognized for your work?
A: It was really nice to be appreciated and seen for the passion I put into the work—that it was rewarded. Even people who aren’t fascinated by birds telling me how cool it was to use the app, that’s really nice. I hope this project gains more visibility from GIS and conservation users because of this.
Q: What advice would you give someone exploring a career in GIS?
A: I’d definitely say be proud of following your interests, even if it’s extremely niche . . . like making an app to visualize birds’ movement. Which isn’t a very common path to take. I’d also say look back and see how much you’ve learned and improved. I still remember my first class, adding some hiking data to a map, and it was an extremely tough task back then, in my first semester of my bachelor’s. Now I’ve created a whole app. There were many moments during my studies that I felt so stuck, but if you zoom out and see how much progress you’ve already made, it’s easier to keep going.
Q: What’s next for you?
A: I want to keep working with maps. My goal is to find more people who could benefit from this application, and to find more ways that GIS storytelling can help nature and bridge the gap between science and accessible communication through GIS tools. I’m interested in continuing with something about birds, animals, or wildlife and movement visualization.
From mapping her own hiking trails to an award-winning project and a full-time position at Esri, Dagmara’s journey shows how a personal interest can turn into something extraordinary. For students and young GIS professionals, her story is a reminder to follow your curiosity, seek out collaboration, and never stop learning because the opportunities you pursue are often the ones you create for yourself.
If you’re a student exploring GIS career pathways, check out the Esri programs and resources available to you so that you may get a head start on your own journey.