By Mark Rees, GISP, GIS Analyst, City of Wentzville—Public Works
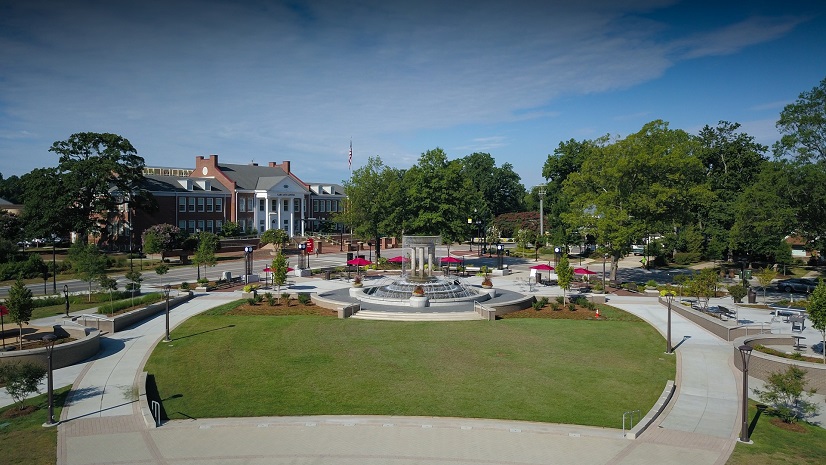
The city of Wentzville—also known as the Crossroads of the Nation—has a rich history that’s woven into the fabric of this thriving community. As the fastest-growing city in the state of Missouri, with a population of around 48,000, Wentzville embodies a unique blend of heritage and innovation. Wentzville’s journey has been shaped by a commitment to five critical success factors established by the board of aldermen: becoming a regional destination, fostering economic vitality, delivering exceptional city services, enhancing infrastructure connectivity, and cultivating a safe and welcoming community. This commitment drives the city to continuously educate and inform its residents and stakeholders about the factors that make Wentzville a place where history meets the future, ensuring responsible stewardship and fostering a sense of community pride.
The public works department is dedicated to maintaining and improving the quality of life in the community by planning for future needs, promoting environmental quality, building and maintaining municipal infrastructure, managing public capital improvement projects, and protecting the health and safety of the community. In addition, the department provides the design, construction, operation, and maintenance of public works and related services within the community in a manner consistent with the city’s vision.
I am the geographic information system (GIS) analyst within the water department. Over the past 25 years, I have used Esri technology to provide solutions to a myriad of challenges. My responsibilities have ranged from being a technician to a programmer analyst. I most enjoy using Python to automate tasks wherever possible. In August 2022, I had the opportunity to work for the City of Wentzville’s water department to help it grow its GIS presence within the utilities arena. Since then, I have developed various applications using both ArcGIS Online and ArcGIS Enterprise to aid in the transition from mostly a paper or spreadsheet documentation method to a spatially focused one.
Management of Water-Related Events
Prior to implementing a spatially enabled solution, our method of notification for main breaks and/or boil advisories was time-consuming. We would receive a call from a water operator who would draw a static map to outline the area involved in the event. An email was constructed to be sent out with this map embedded as a JPEG image. During this time, our customer service staff would be inundated with phone calls requesting updates on the current event. We would also distribute door hangers for events that involved fewer than 30 residents.
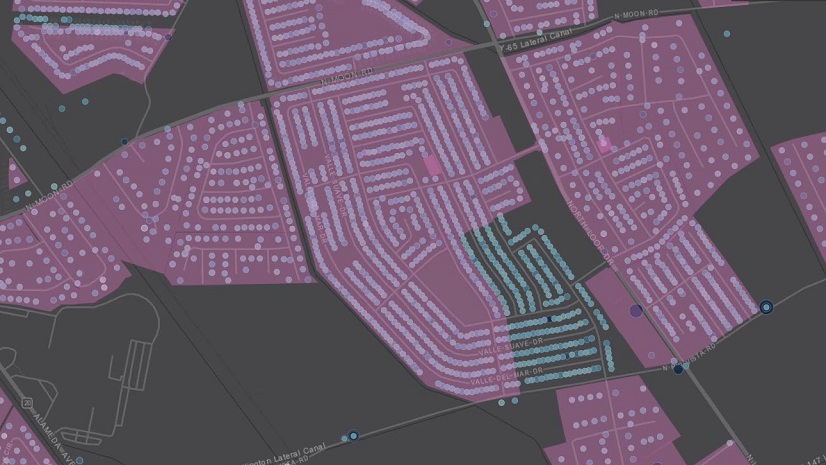
Now, the use of an ArcGIS Online dashboard provides residents with the extent of the outage or event and reduces the number of phone calls received by residents. This dashboard and a custom email notification using Python provide up-to-the-minute updates on the status of any outages in our system.

With the implementation of [the ArcGIS Online Outage Dashboard], our field utility technicians are now empowered to instantly publish communications and maps that depict and update the duration and location of system-outage, reduced-pressure, or boil-advisory conditions. This application saves valuable time during emergency repairs and dramatically improves our ability to communicate effectively and quickly with our customers.
Management of Water-Related Assets
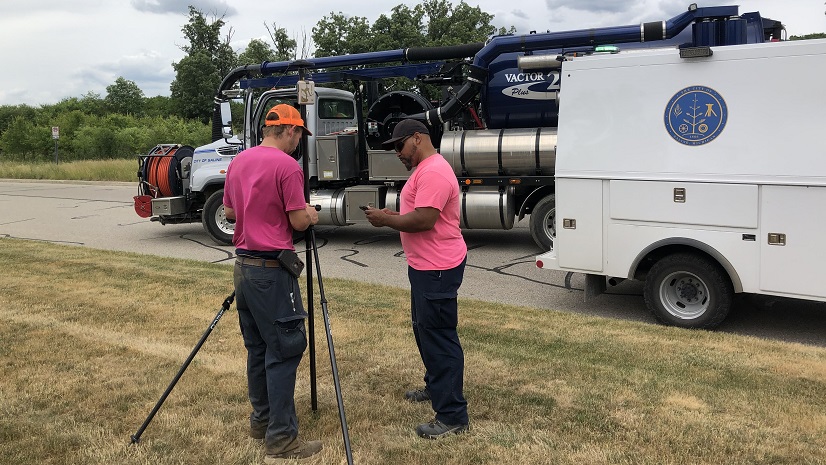
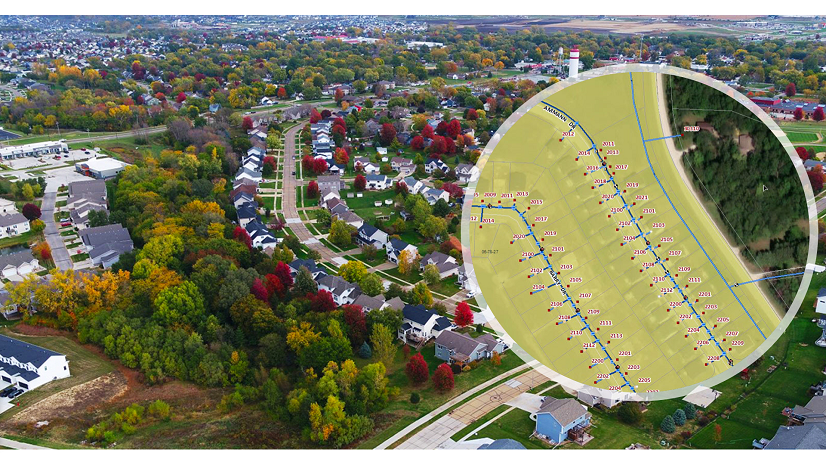
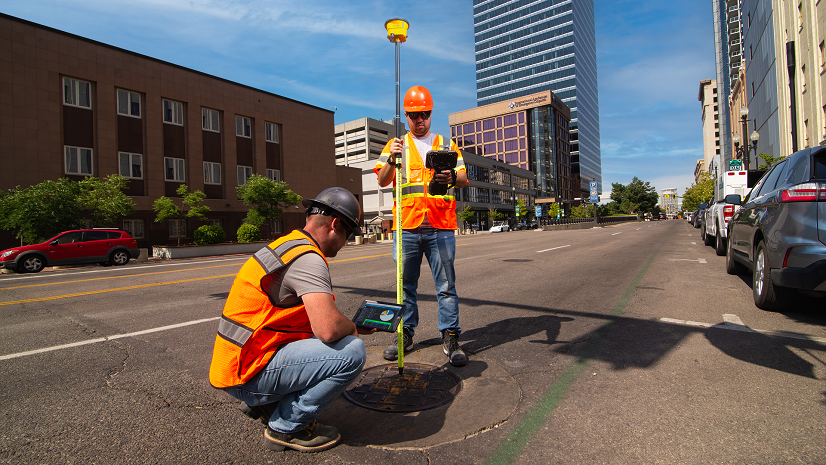
To better manage the city’s utility infrastructure, the water department began collecting data on new water infrastructure as it was installed. ArcGIS Online was used to collect this information via a hosted feature layer. Initially, a Trimble DA2 device and ArcGIS Field Maps were used to collect fire hydrant locations citywide. Along with the location of each fire hydrant, information such as brand and size and a photo of the hydrant were collected. This was providing about one-foot accuracy for data collection. To better improve our accuracy, we have since implemented a Vivax-Metrotech locating wand, connected to an ArcGIS Online hosted feature layer. This technology provides from two- to six-inch accuracy. Due to the success of using ArcGIS Field Maps within the hydrant program, it was quickly expanded to collect the location of city-owned new construction including water mains, valves, and meter pits.

The implementation of the [GIS] in the water department has been a game changer. It has not only enhanced our operational efficiency by being able to easily and quickly add new sections of main to the utility map but has also empowered us to be able to update our current utility map with accurate information.
Better Maintenance Management
Prior to ArcGIS Enterprise, the documentation of our various asset programs was handled using spreadsheets with no spatial component. Using ArcGIS Enterprise, we were able to utilize ArcGIS Field Maps and various mapping applications to better track progress on most of our annual and biannual programs. This allowed us to keep track of important information in a table tied to a specific asset. With a click of the mouse, we can identify what work has been performed on an asset, allowing for compliance with Missouri Department of Natural Resources regulations.

In terms of maintenance tracking, we use ArcGIS Field Maps to enter maintenance issues as they are identified, so we can ensure that these issues are resolved in a timely manner. A future benefit of maintenance issue tracking is that we can better plan for tools and equipment to have on hand, which could help save money in reducing inventory holding costs.


Report Automation Using Python
After creating various applications using ArcGIS Enterprise and ArcGIS Online, we needed a way to keep track of what work has been performed. We were able to achieve this by writing custom Python scripts to generate emails with pertinent information.

The following types of reports are generated nightly to ensure that we keep up-to-date on program progress:
Daily Program Progress Report
This email provides progress metrics for all the water programs currently used within ArcGIS Enterprise. These metrics include the work that’s been completed within the last 24 hours and the last seven days. This allows our supervisors to ensure that progress is being made so that we complete the scheduled work within a given work cycle.

Daily Maintenance Reports
This email provides a list of all discovered maintenance issues for hydrants, valves, and air release valves. The report organizes the list by subdivision to better organize the work and reduce time to resolving issues, by concentrating efforts spatially. The report lists each maintenance issue and the associated asset ID, closest address, and associated subdivision (if applicable). Once issues are resolved, they fall off the list since the report is generated daily.

The use of ArcGIS Online and ArcGIS Enterprise has allowed the department to significantly increase efficiency of operations. Future goals include further automation of the public outage map using Esri’s ArcGIS Utility Network to specifically notify affected customers during outage or advisory events. I am excited to be part of what the future holds for the Wentzville Public Works Department in its use of GIS technology.
As the superintendent of Wentzville’s Water Division, I’m always seeking ways to enhance our operations. We decided to incorporate GIS into our operations and sought the right person to establish a system. With the addition of our GIS analyst, we’ve transitioned from paper to a digital system, making our operations more streamlined and efficient. This has significantly improved our water management and service delivery, positively impacting the residents of Wentzville.
Stay Connected with Esri’s Water Team
ArcGIS is an extensive information system that enables modernization of workflows with easy-to-use applications for the field and office. Strengthen your organization with smart water solutions that will increase efficiency and provide insight for decision-makers. Visit the Esri Water Utilities web site for more information.
Join the Water Utilities Community
Follow #EsriWater on social media: Twitter | LinkedIn
Subscribe to the Water Industry newsletter “Esri News for Water Utilities and Water Resources“
Learn more about how Esri supports rural and small water.
About the author