Recently at the São Paulo/Guarulhos International Airport, a fully loaded Delta Airlines Airbus A-330 bound for Atlanta Hartfield International experienced a catastrophic engine failure immediately after takeoff. Maintaining control, the pilots did their job. Shutting down the left engine that was on fire, they continued a slow climb, and with 286 souls onboard, returned to the field, landing safely 10 minutes later. Very rare, this scenario is why all certified commercial twin engine aircraft are guaranteed to fly on one engine; but climb performance is reduced. Airports guarantee air carriers, passengers, and the authority governing airspace that if this happens; those stricken aircraft will not encounter obstructions during engine-out emergency departures. This underscores the importance of conducting accurate obstacle analysis and safeguarding airspace.
In my role at Esri, I work with airports across the nation that struggle with obstacle analysis. Eliminating obstruction risk is critical for airspace around airports as air traffic grows, regulations evolve, and urban development around airports intensify. Unfortunately, I have come across a lot of airport professionals that aren’t aware of the capabilities of the ArcGIS Aviation Airports extension. I know that if those airports leveraged this set of tools, they would be able to analyze more data, more frequently, and with greater confidence. The airport extension is the industry standard and best practice for maintaining protected airspace and meeting safety and regulatory demands. Intelligent airports are turning to GIS to modernize how they create, analyze, and share protected airspace surfaces; unlocking faster workflows, gaining clearer insights, and stronger regulatory confidence. In this blog, I preset several business cases outlining why airports should use GIS and the Airports extension for obstacle analysis.
Case 1 – The Growing Need for Speed and Accuracy
Airport planners, engineers, and GIS teams are under constant pressure to respond quickly to change. Aircraft schedules shift, approach procedures are updated, and new development proposals for cellular towers, cranes, and buildings can emerge at any time. Each of these changes has implications for protected airspace and must be evaluated accurately and promptly. Traditional workflows often struggle to keep pace. Creating approach surfaces or conducting obstacle analysis manually can take days or longer, introducing delays and increasing the risk of errors. By contrast, GIS‑based workflows allow airports to ingest authoritative data, generate surfaces, and perform analysis in a fraction of the time, often within a single day. Equally important, GIS makes it easier to visualize and communicate results. Instead of static paper drawings, stakeholders can work from interactive maps, 3D views, tables, and reports that clearly show where issues exist and why they matter.
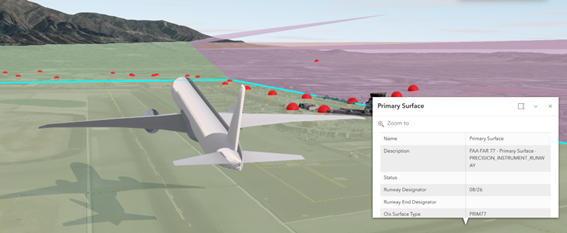
Case 2 – Built‑In Compliance, Not After‑the‑Fact Checking
Speed alone isn’t enough. Airport surface and obstacle analysis must align with strict regulatory requirements, including FAA standards such as Part 77 and other Obstacle Limitation Surfaces (OLS). One of the most significant advantages of modern GIS‑based airport tools is that compliance is built into the workflow. Rather than manually constructing surfaces and hoping they meet regulatory criteria, users can generate protected surfaces that are designed to follow established standards from the start. This dramatically reduces rework and gives planners and engineers greater confidence that their analyses will stand up to regulatory review.
Case 3 – Creating and Managing Surfaces More Efficiently
Historically, generating Part 77 or similar surfaces was a painstaking process especially when done repeatedly across multiple runways or airports. With the ArcGIS for Airports Extension tools, these surfaces can now be created in seconds, depending on extent and complexity. Efficiency becomes increasingly important as the number of runways or airports in the analysis rises. State DOTs, consultants, and airport authorities managing multiple facilities can standardize workflows, reduce manual errors, and ensure consistency across projects. In practice, this has allowed teams to move from ad‑hoc analysis toward repeatable, production‑ready workflows.
Case 4 – Smarter Data Models with Aviation‑Ready Schemas
Beyond surface creation, modern airport GIS workflows benefit from aviation‑specific data models. Updated airport schemas now include attribution that is aligned with FAA 18B requirements, giving users a ready‑to‑use structure for airside data including runways, centerlines, obstacles, and other features. This means users no longer need to design fields from scratch or guess what information regulators expect. While certain operational values still need to be populated, the underlying schema supports more consistent data exchange with the FAA and other authorities. Future improvements will simplify data exchange by optimizing the integration of aviation-standard CAD files into ArcGIS. The goal is simple: reduce manual data wrangling and make compliant data easier to work with.
Case 5 – Clear, Actionable Analytics
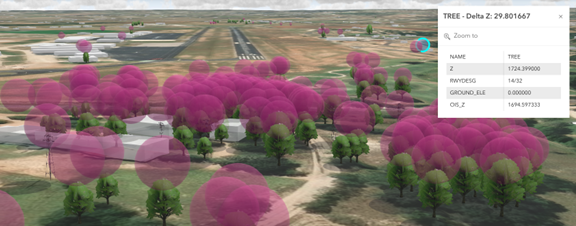
Once surfaces are created, the real value comes from analysis. GIS‑based obstacle analysis tools provide outputs that are both technically rigorous and easy to interpret. Results typically include:
- Identification of which protected surface is being penetrated
- Delta Z values showing how much an obstacle extends into a surface
- Obstacle Identification Surface (OIS) values at specific locations
- Tabular outputs paired with map‑based visualization
A positive Delta Z immediately flags a penetration, allowing teams to focus attention where it matters most. These outputs support both detailed engineering review and high‑level decision‑making, bridging the gap between technical analysis and operational insight.
Case 6 – For Planning and Capital Decisions
Obstacle and surface analysis isn’t just about identifying existing problems; it’s a critical input to long‑range planning. Airports routinely evaluate runway extensions, threshold shifts, and approach category changes as part of capital improvement programs. GIS allows planners to model these future scenarios and understand constraints before major investments are made. By seeing how proposed changes interact with terrain, structures, and other obstacles, decision‑makers can assess feasibility, and risks earlier in the planning process.
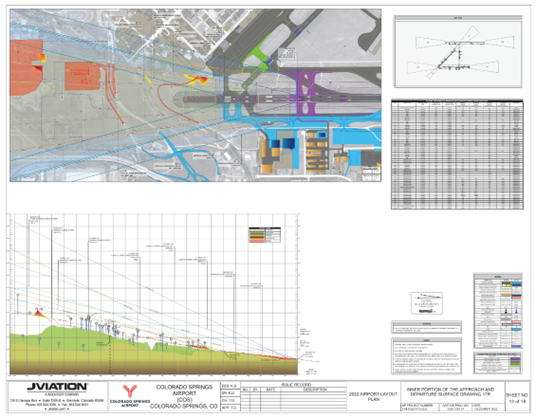
Case 7 – From Analysis to Action and Visualization to Communication
While mitigation decisions themselves remain user‑driven, GIS plays a key role in prioritization and communication. Dashboards, maps, and reports help teams focus on the most critical obstacles – those that violate or nearly violate protected surfaces, so mitigation efforts can be targeted effectively. GIS also supports a wide range of deliverables. Results can be shared internally through ArcGIS Enterprise portals or ArcGIS Online, while regulatory submissions often still require traditional PDF plan‑and‑profile outputs. The ArcGIS Airports extension tools support both, ensuring that digital workflows still meet real‑world reporting expectations.
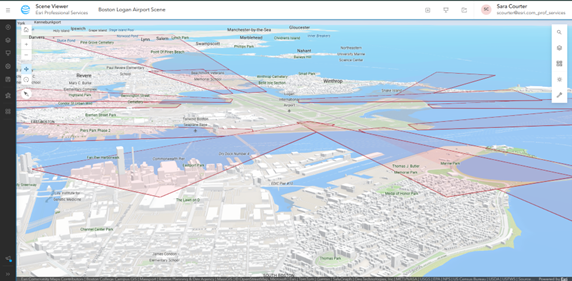
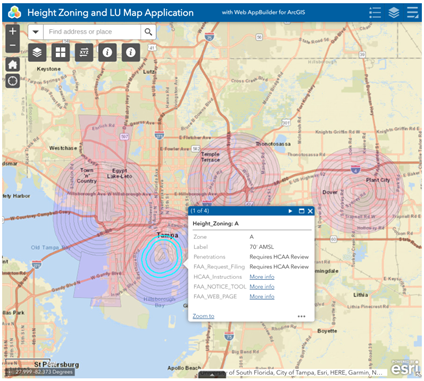
Use Case – Height Zoning and Permitting
The Hillsborough County Aviation Authority established height zoning regulations for all of Hillsborough County to ensure the safe operation of Tampa International Airport, Peter O. Knight Airport, Plant City Airport and Tampa Executive Airports, and to protect arriving and departing aircraft. These regulations apply to buildings, signs, and construction equipment, such as cranes, trees, and other objects.
Permits from the Aviation Authority are required for structures in any zone outlined on the current Height Zoning Map, and any construction or alteration on any public use airport in Hillsborough County. The Aviation Authority also enforces state regulations regarding the location of educational facilities, landfills, and residential development to protect airports.
Applicants use the FAA Notice Criteria Tool to determine if their proposed project and/or equipment requires filing a form with the FAA and to assist in determining if an Airport Height Zoning Permit will be required. Proposers whose projects exceed height zoning limitations may seek variances from the Aviation Authority’s Board of Adjustment.
The Map below is used to determine the height notification that would apply to submittals. All locations outside of the height zones require notification if the project is greater than 200′ above ground level or required by the FAA.
Case 8 – Evolving with Every Release
Airport environments, regulations, and technologies continue to evolve, and so do the ArcGIS Obstacle Analysis tools. Ongoing enhancements continue to focus on improving performance, expanding analytical capabilities, and simplifying workflows, particularly for airport authorities and AEC partners. The takeaway is clear: ArcGIS is no longer just a mapping tool for airports. It has become a foundational system for managing safety, compliance, planning, and communication in an increasingly complex aviation landscape.
Cleared for Takeoff
Now that I have outlined the need, the capabilities, and the business cases for why you should use the ArcGIS for Aviation Airports extension, what are you waiting for? Give it a test flight. Request a free trial of the Airports Extension. Then follow this set-by-step tutorial on using the Airports extension plus access to sample data you can download and try out for yourself.
Happy flying!