Everywhere you look companies are racing to lay more fiber, rolling out new wireless technologies, and expanding broadband services deeper into rural communities. With a variety of funding opportunities on the table there’s a lot more pressure from regulators and customers are pushing the limits of networks worldwide. Adding to these efforts there is a constant need to prove a return on investment and show growth in profitability while delivering excellent customer experience.
In the middle of all this work? Data, and there’s lots of it. What makes it a challenge for organizations is that it’s from dozens of systems spread throughout the organization and from third party systems as well. These systems are spread across teams, organizations, and countless places that don’t always speak the same language or see the full organizational picture. That’s the part that’s holding a lot of service providers back. It’s not individual pieces technology, and it’s not a lack of ambition, it’s just too many disconnected systems and not enough context tying it all together with an easy way to use it all.
That’s where GIS comes in.
What is a GIS? Geographic information systems aren’t just a digital map. It’s a purpose-built platform that leverages location to bring together your most important data, see how it all connects in the real world, and do something with it. Organizations throughout the telecom industry regularly reply on critical data for decision-making, all of which is location based. Because of this, the more teams rely on spatial data to make decisions, the more valuable GIS becomes.

In thinking about some of the recent conferences and publications I’ve been keeping up with, I’ve seen some hard numbers around location-based data that make this all even more real. For instance, network downtime can cost providers between $5,600 and $9,000 per minute, depending on the scale of the impact. That’s potentially over $500,000 per hour when you factor in enterprise customers and service-level agreements. Additionally, global estimates around outages are even more shocking, where some suggest internet downtime costs businesses up to $20 million every minute.
During planning, design, and construction, unforeseen costs associated with permitting or restoration work often add 10–20% to project costs. During market expansion efforts, inaccurate planning or forecasting often leads to poor take rates lead to wasted capital. These are the kinds of financial risks that can be managed, or avoided, when you have the right data, in the right format, at the right time.
Network Asset Data
What do we have available at that location? Do we have a circuit available and what’s the route? Is that site suitable?
Teams in organizations regularly field and answer location-based questions. Simply put, this is because everything you do in telecom is tied to location and your network assets are the foundation for everything you do. Fiber routes, splice points, poles, towers, handholes, cabinets, central offices, and all the equipment that makes your network run. It’s your digital infrastructure. Unfortunately, far too often this data is stuck in a variety of systems like CAD drawings, spreadsheets, or homegrown legacy tools. To add to the complexity, many times engineering has one version, construction has another, and the field team uses something totally different.
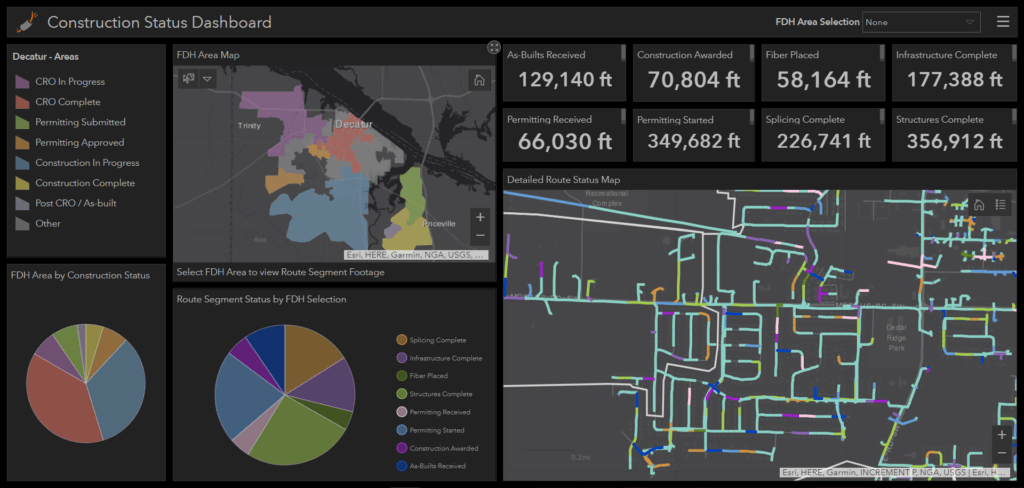
Example: Construction and Permitting dashboard
GIS can help fix this issue. It gives everyone a shared view of the network, tied to real-world geography, with the ability to trace connections, plan builds, and understand impact. You can zoom in on a single strand of fiber or zoom out and see how your whole network connects across counties or states. Quite often what took teams hours or days to compile and analyze, can be done in minutes.
Without good network asset data available in real-time, your entire operation is guesswork. This is not operationally sound or fiscally viable for the long term. With GIS, your network maps and data become a living digital twin that evolves with your network and is useful to the entire organization.
Customer and Demand Data
What is driving NPS? Where is demand growing? Where are we leaving revenue on the table?
You can’t plan your network without knowing who you’re serving and where the opportunities are. That includes current customers, pending installs, churn hotspots, service availability, and places where people are asking for service but can’t get it yet. The list goes on!
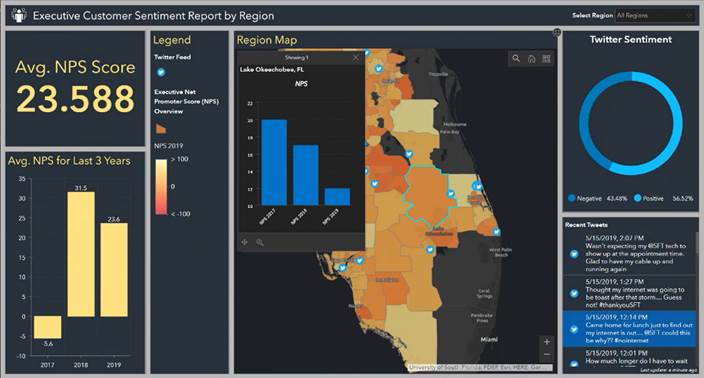
Example: NPS Customer Sentiment Reporting Dashboard
With GIS, you map this demand in a real, and actionable way. You can overlay housing development data, income levels, and business density. You can visualize take rates and figure out which areas are ready for expansion while also determining which ones need more outreach or better pricing.
Throughout the organizations, sales, marketing, engineering, and leadership can all use a single source of truth within the same system to make smarter decisions. Instead of everyone looking at a spreadsheet or dashboard with no context, they’re all seeing what’s happening in the real world in a way they all can gain insight from.
Permitting and Environmental Data
What permits are needed? What are the environmental impacts?
Throughout the world, permitting delays are one of the biggest headaches in telecom. Permitting isn’t always just identifying the attachments and easements needed. Today, it’s often about environmental needs along the intended route. Many organizations need to identify, account for, and mitigate risk and impacts to wetlands, historic zones, tribal lands, railroad crossings, and much more.
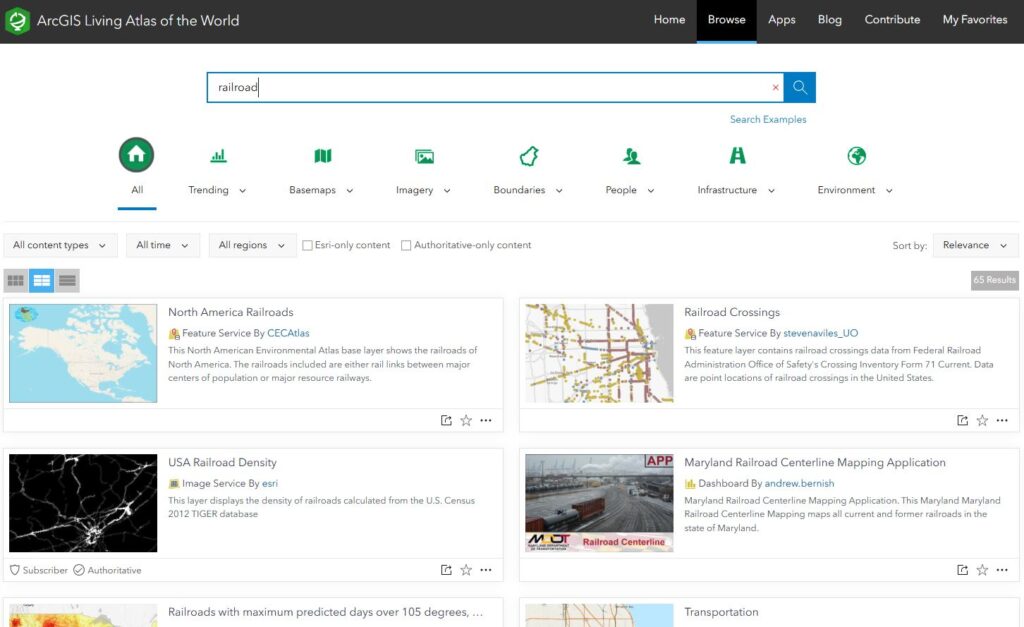
Example: Incorporate railroad data from the Living Atlas of the World easily
Not to mention, these permitting requirements and processes change depending on the city, county, or agency you’re dealing with. When you bring permitting data and environmental constraints into your GIS, you give planners and designers a head start and ability to adapt quickly to the changes they encounter. They can see what areas need special handling, which jurisdictions have long lead times, and how to route around known issues.
What I love about GIS is that it transforms the permitting process from a bottleneck into a much smoother workflow that’s an integral part of your overall plan. When permitting needs and statuses are visible on the same map as your network and customer data, you’re able to start working with fewer surprises along the way and more confidence in your construction timelines and expenses.
Network Performance and Fault Data
Where is the network struggling? What is the QoE and QoS of the give area? What is at that facility?
Most organizations already have good telemetry coming from their various OSS tools or NOC. They typically track alarms, outages, latency, and bandwidth usage. But how much of that data is tied to a map and can be used in decision-making throughout the organization?
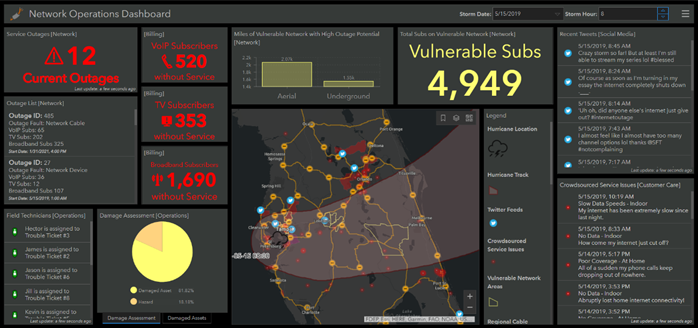
Example: Network Operations Dashboard
Seeing network performance contextualized on a GIS map tells a different story than a simple table, graph, or bar chart that leaves interpretation open to the viewer. Maps and dashboards easily show analyzed and visualized data that provides insight into patterns. GIS helps quickly highlight problem areas. It reveals trends tied to technology type, individual or team, or even weather. Maybe a node keeps going down every time it rains or a nearby failing transformer causes electrical interference. Maybe rural areas are underperforming because of backhaul congestion or the overall distance from the central office. Maybe your “healthy” network looks a lot less healthy when you add customer calls, NPS scores, outages, maintenance, and trouble tickets layers.
Within a telecom organization, GIS can help your operations teams connect the dots and quickly by providing context to complex situations surrounding network alerts, asset health, and actual customer impact. Today it’s not just monitoring a network, it’s understanding before taking action.
External Relative Data
What’s happening around us? What’s on the Horizon? What should we do next?
This one’s often overlooked, but it’s where some of the biggest insights come from. External data includes demographics, construction permits, zoning changes, traffic patterns, economic development zones, and even your competitors’ coverage.
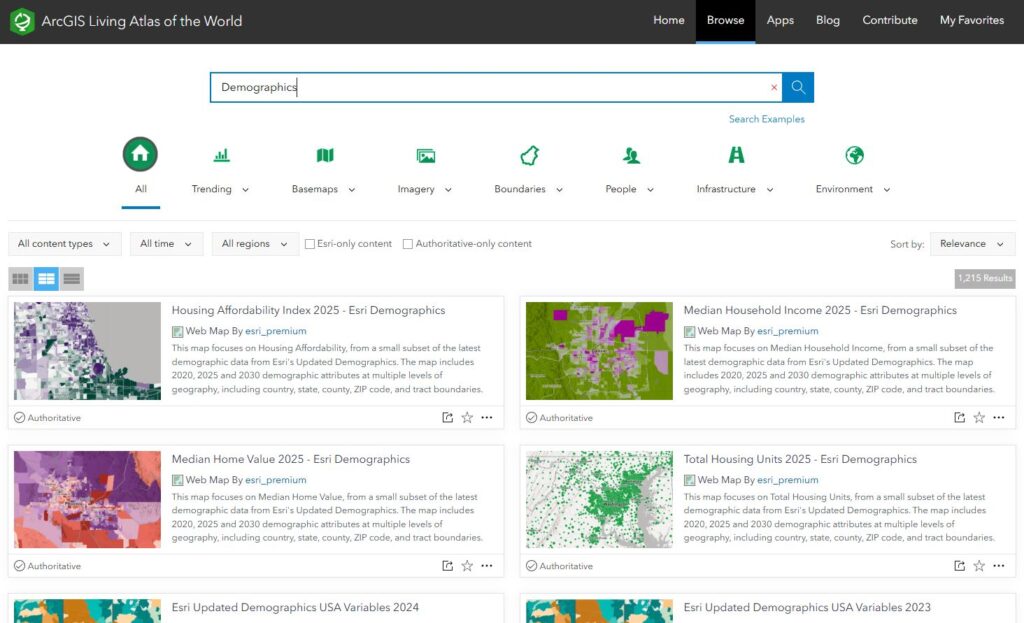
Esri Living Atlas of the World: Search Results for Demographics
Think of it this way, every decision you make happens based on your understanding of the real world around you. Throughout my career I’ve seen, and made, many decisions based on great information and gut feelings, but the context and big picture was missed. With GIS, teams can gain that much needed and desired context and make much more informed decisions with a greater outcome. It helps you plan where to build, how to market, and how to stay ahead of what’s coming.
Think about this, what if you could see that a new subdivision is going in soon before utilities notify your team, and there’s no decent broadband yet? How about that upcoming event in your footprint that thousands of commuters are passing through a corridor where your 5G coverage is weak or a venue that cannot adequately support the bandwidth? What if there’s a grant tied to serving low-income neighborhoods and you need to know if you can qualify? These are all things GIS was purpose build to help organizations answer.
Remember this, GIS isn’t just about your network assets shown on a digital map. It’s about delivering the insight and understanding surrounding the comprehensive environment your network operates in, so your team can stay competitive and connect consumers to what they need.
Why GIS Is the System That Ties It All Together
While all of these datasets are important, and there are many more I could list, they don’t do much if they stay locked away in silos. Much of the data organizations rely on exists locked away in engineering tools, CRM systems, permitting portals, NPS, logistics and supply chain systems, job management systems, and more. GIS is a purpose-built system designed to bring these incredible systems together so teams can leverage solutions supporting their daily activities.
When you use GIS to unify data throughout the organization, you gain a comprehensive view of your network, your customers, your performance, and your opportunities all tied to place. Furthermore, you’re not just managing data in a new location, you’re building a digital representation of the real world you’re operating in. You’re building a digital twin.
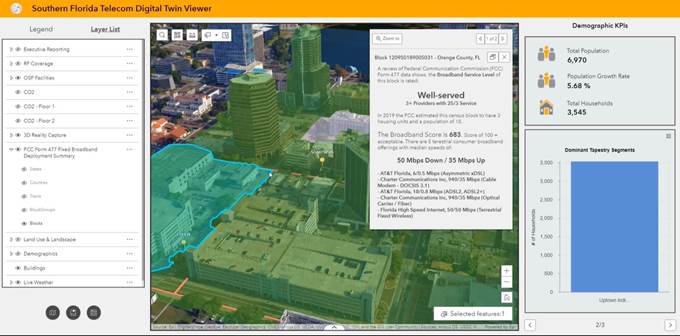
Example: Digital Twin Viewer Delivering Comprehensive Site Details
Now, a telecom digital twin isn’t just a model of your network. It’s a real-time, ever-evolving, interactive system that helps every team, from field crews to execs, work off the same source of truth. Keep in mind, it’s not something you have to build from scratch. ArcGIS already powers digital twins for hundreds of telecom providers around the world. It connects with your existing systems, it scales as you grow, and it provides a definitive source of truth your organization can rely on, in every aspect of your workflow. From tracing a fiber outage, understanding customer satisfaction, overseeing network health, to planning a multi-million-dollar expansion. Throughout the world GIS is delivering what telecom needs right now: insight and awareness, real-time collaboration, and data that’s not just accurate, it’s useful.
Final Thoughts
Telecom network management is more than just overseeing a bunch of cables and towers. It’s about serving people, staying competitive, and building infrastructure that supports the future and provides opportunity. But to do that well, you need more than raw data utilized from siloed OSS and BSS resources. You need data that your team knows where it is, how it connects to other data, and how to tell a story with it.
Because everything you do happens somewhere, GIS can help you see the big picture, make smarter decisions, and move faster. Once you understand that, you can start putting your data to work in a way that actually changes the game and provides competitive advantage to your organization.
If you’re ready to turn data into decisions, and decisions into results, start with the five datasets that matter most, and build on your digital twin from there.
Resources:
Learn more about Esri in Telecom
Learn more about Esri’s Living Atlas of the World