Coffee Challenges
Europe has long had a history of promoting sustainable agriculture through the use of a complex regulatory framework that rewards producers for utilizing environmentally friendly practices. The European Union (EU) Deforestation Regulation (EUDR) is the latest environmentally friendly legislative framework established by the European Union to prevent the import and sale of products associated with deforestation and forest degradation, rewarding producers with access to EU markets. Its scope extends beyond agriculture to encompass a wide range of commodities—such as wood, rubber, soy, palm oil, cocoa, and coffee—as well as derived products, including furniture, paper, and leather goods. The EUDR requires that these goods placed on or exported from the EU market are sourced from land that has not experienced deforestation or forest degradation after a specified cut-off date of December 31, 2020. By enforcing traceability and due diligence obligations across supply chains, the regulation aims to reduce the EU’s contribution to global deforestation, protect biodiversity, and promote sustainable land use and trade practices.
Coffee is a major driver for global deforestation and, therefore, provides an illustrative use case for the need for compliance and traceability in the supply chain from Africa to Europe, for example [1]. Specifically, given that 90% of deforestation of land is driven by agricultural expansion [2], the EU imports 33% of coffee produced globally resulting in 6% of the total EU-driven deforestation [3]. To comply with the EUDR, coffee must be sourced from land that has remained compliant since the cut-off date.
Companies are required to implement a robust due diligence system that gathers and assesses relevant information, identifies potential risks, and ensures these risks are reduced to negligible levels. This means that each coffee lot must be precisely geolocated, either with GPS coordinates or mapped polygons linked to the specific farm of origin. Additionally, compliance with all applicable local laws is essential, encompassing land tenure, labor rights, and environmental regulations. To ensure traceability around farm-to-export tracking, companies must submit due diligence statements to the EU prior to importing or exporting coffee products. All this must done in an environment where 60% of the coffee farmers in Africa are smallholders, who are farming land that are managed under largely unwritten customary land tenure systems. Given these challenges, ensuring program integrity to reduce fraud, inefficiencies and undo burdens on businesses is key for the EU to meet its program objectives. These challenges will require a sophisticated information system that can intelligently manage information as articulated by EU’s Environment Commissioner Jessika Roswell’s concern over disrupting businesses as she states “We need the time to combat the risk with the load of information in the IT System” [4].
A Geospatial Solution
One way to reduce the information system load is to choose a technology that best fits the challenges of ensuring compliance – one that considers the geography of the business as a natural starting place. For example, the EUDR introduces a critical need for robust geospatial verification of land use history, making Earth Observation (EO) and Geographic Information Systems (GIS) essential tools for ensuring regulatory compliance. Given the need for GIS, Esri announced in 2024 that it has renewed support for the Forest Stewardship Council through a software donation to help accelerate the land verification task. [5]. This blog article outlines potential applications of Esri’s GIS technology and platform.
Esri’s technology could aid the geospatial approach that focuses on an open solution to provide transparency around the benchmarking of countries. This involves the implementation of a country benchmarking methodology framework that categorizes countries into low, standard or high-risk categories for deforestation-free commodities such as coffee. In this way, transparency enables the opportunity for self-policing because every participant can see where they stand.
Transparency relies heavily on open data, where the geographical approach renders that transparency through maps encapsulating key data sets from Esri’s Living Atlas, Digital Earth Africa, Global Forest Watch, UNWCMC Protected Areas, etc. Esri offers a few of the key data sets, such as:
- Global Forest Watch Loss Year
- Protected Areas (WDPA)
- Digital Earth Africa’s Landsat 8 GeoMAD,
- Land Cover (ESA Global Cover, MODIS, Copernicus)
- Biodiversity and conservation layers
- Sentinel & Landsat Archive
- SAR data from Sentinel-1
Using these data sets, several techniques from the Esri suite can be leveraged to detect deforested areas using Esri’s ability to manage satellite data along with various band ratioing techniques (e.g., vegetation indices like NDVI, NDRE) as outlined in [6] and shown in fig. 1.
The challenge, of course, is around combining these data sets together to make key determinations around coffee production, which can range from shaded, polycropping to unshaded, monocropping systems. For shaded systems, tree canopies can make EO difficult when trying to create coffee production maps, which could appear like non-deforestation areas despite being defined by FAO as deforested land (i.e., agroforestry) [7]. For these reasons and other geolocation accuracy issues, capturing good ground truth potentially from the farmers themselves would ensure that the monitoring systems constantly improve, especially given the advances in machine learning techniques.
In [8], to automate detection of these difficult scenarios, numerous methods of classification for mapping coffee production systems can be used such as spectral pixel-based, spectral sub-pixel based, texture-based, data-fusion based, object-detection based, and hybrid. Each of the techniques offers a wide range of accuracy where advanced image processing techniques can be developed over time to produce more accurate maps. Serving as an environment for potentially detecting coffee fields and plants whether shaded or not, Esri’s image processing capabilities offer a comprehensive suite of tools designed to support advanced image processing and analytics described in [8] across a variety of EO data sources. Leveraging both traditional and cutting-edge techniques, Esri enables users to apply spectral indices (such as NDVI and NDRE), texture analysis, and data fusion to derive meaningful insights from satellite imagery. The platform also integrates deep learning methods, such as field boundary detection, allowing for the automated extraction of complex features like farm field perimeters from high-resolution imagery. These deep learning models can be trained to recognize subtle differences in crop cover, potentially supporting the distinction between shaded and unshaded cropping systems, and improving the accuracy of agricultural mapping even in challenging environments. Esri’s geoprocessing framework allows organizations to flexibly mix and match these methods in order to streamline workflows. As a result, this will minimize redevelopment time as analytical requirements evolve due to increasing accuracy requirements as compliance standards move from larger holders to smaller operations over time.
Efficient and Effective Workflows
To reduce the information load in the information system, we suggest starting with a simple workflow that uses a combination of mobile data capture, imagery analysis, and spatial analytics on a single geo-platform.
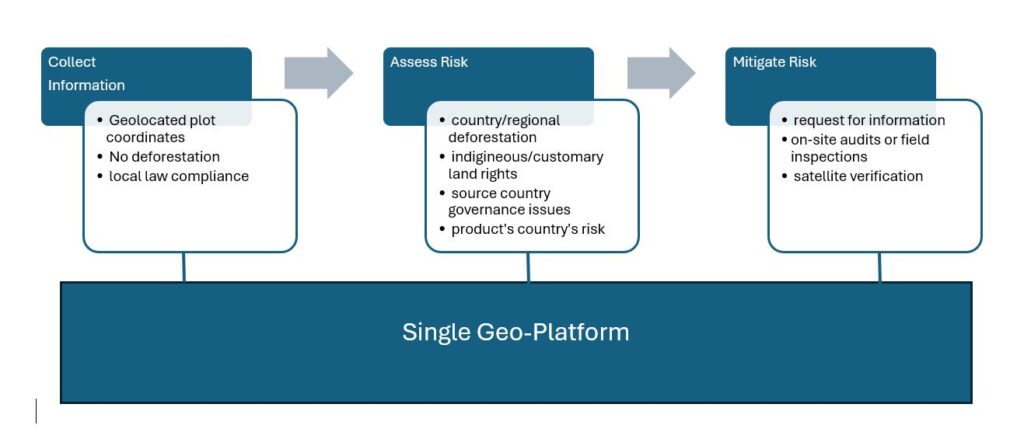
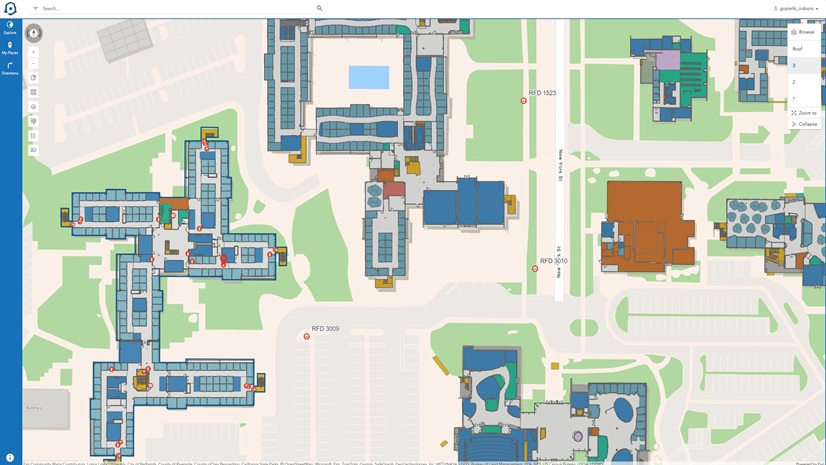
As shown in fig. 2, a practical workflow leverages open-access EO datasets and modern GIS technologies through a 3-step process: data collection, risk assessment, & risk mitigation.
Collect Information
The collection of data is necessary for compliance and involves providing geolocation data and legal documentation, where data collection will likely be form based. These forms could be entered by the farmer or, more likely, with help from local authorities or NGOs.
The geolocation requirements depend on the size of the coffee farm, which must provide a valid farm ID:
- one coordinate centered in the farm for farms less than 4 hectares,
- a full polygon defining the farm boundary based on at least 6-12 coordinates for farms greater than 4 hectares.
Such a requirement lends itself to solutions from Esri’s mobile suite of tools. ArcGIS Survey123, for example, can take geolocation data from either GPS devices or mobile phones and combine it with document attachments, form fields, and other data. Survey123 also has the capability that would allow a coffee farmer to walk around a field to automatically produce the full polygon requirement for farms larger than 4 hectares.
Assess Risk
To ensure compliance with the EUDR, several key factors must be carefully assessed. These include the prevalence of deforestation within the country or region, the proximity of farms to areas experiencing forest loss, protected areas, and biodiversity hotspots. Additionally, it is vital to consider the presence of indigenous or customary land rights and to evaluate the level of corruption or overall governance in the source country. Assessing these elements helps identify potential risks and supports the implementation of sustainable sourcing practices that align with the regulatory requirements, but this must be done efficiently in a cost-effective manner to avoid incentivizing producers to move to alternative markets where regulatory requirements are non-existent.
In order to reduce “red tape”, workflows for assessment must be done efficiently by governing organizations who look at the data captured in the data collection phase. These organizations are highly dependent on map accuracies, which can vary by geography, and the ability to apply spatial analytic tools from mature GIS systems like Esri.
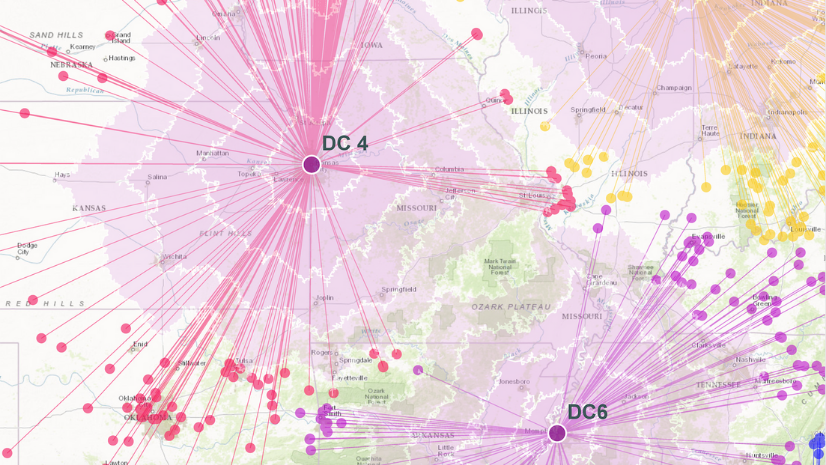
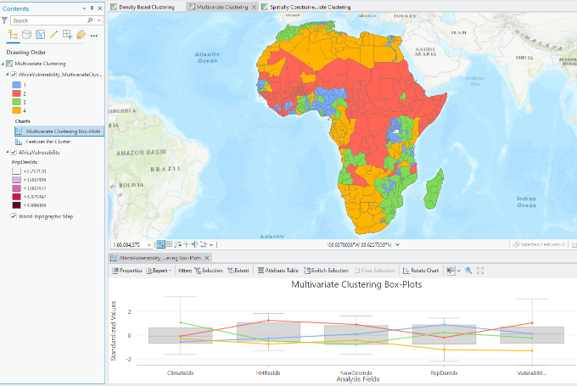
Spatial Analytics tools from Esri range from finding patterns to predicting values and forecasting conditions, except with a focus on space and time. Techniques like geospatial cluster analysis (e.g., Density-based Clustering, Multivariate Clustering, Spatially Constrained Multivariate Clustering) could be used in models that inform stakeholders of countries’ overall EUDR compliance risk at the country and potentially local level, as shown in fig. 3.
Mitigate Risk
To mitigate the risk of incorrectly assessing EUDR compliance, stakeholders should seek additional evidence or clarification directly from suppliers, conduct on-site audits or field inspections to validate reported practices, and leverage satellite imagery or other remote-sensing technologies to independently verify land-use claims. These combined approaches enhance the accuracy of compliance assessments by cross-checking information from multiple sources and ensuring that data provided aligns with actual conditions on the ground. This multi-faceted verification process helps reduce the likelihood of errors or misrepresentation, supporting more robust and credible compliance with EUDR requirements.
But perhaps the best way of mitigating risks for all models is to apply predictive analytics to anticipate where problems may occur, whether they are about predicting suppliers who may be at risk of non-compliance or potential future country or local level risk. For this, Esri provides a large suite of spatially-oriented models such as Forest-based Classification and Regression, Geographically Weighted Regression, EBK Regression Prediction, and Support Vector Machines. In addition to prediction, tools that do time series analysis and forecasting including Curve Fit Forecasting, Exponential Smoothing Forecast, Forest-based Forecast, Evaluate Forecasts By Location, Train Time Series Forecasting & Forecast Using Time Series, and Emerging Hot Spot Analysis.
Ugandan Plantation Example
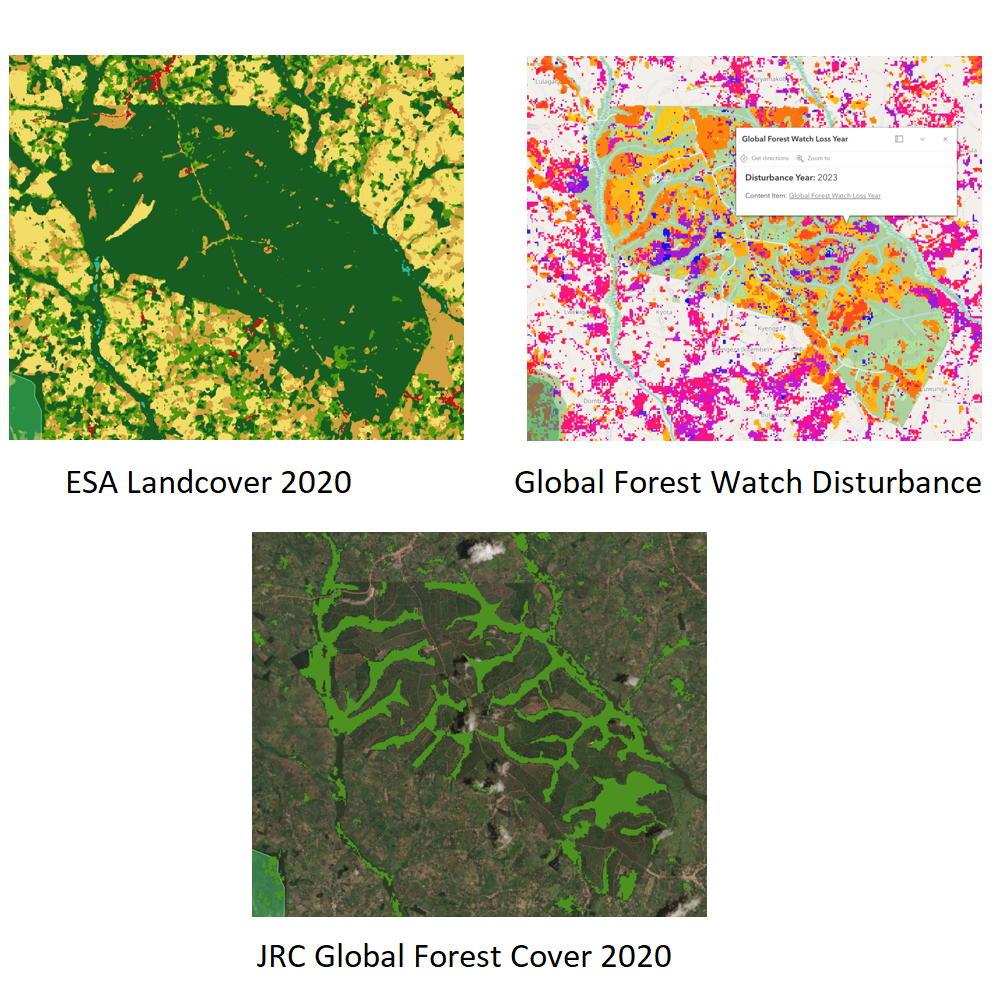
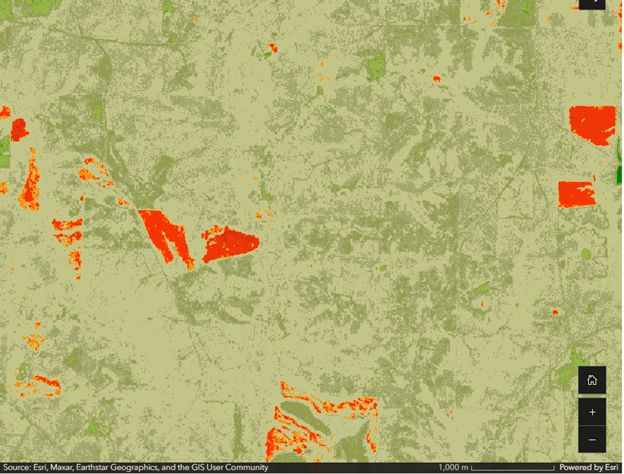
As a practical example, consider a coffee plantation in Uganda, which is located in a country currently classified as standard risk. Since the plantation is larger than 4 hectares, it is required to submit a full boundary polygon as part of compliance documentation. Referring to the ESA land use map from 2020, this region is categorized as forest, as shown in Figure 4.
The Global Forest Watch dataset reveals evidence of forest disturbance in both 2023 and 2024. However, when overlaying the EU forest cover map from 2020, it becomes clear that none of the recent disturbances occurred within areas that were classified as forest at that time, which means the plantation is compliant.
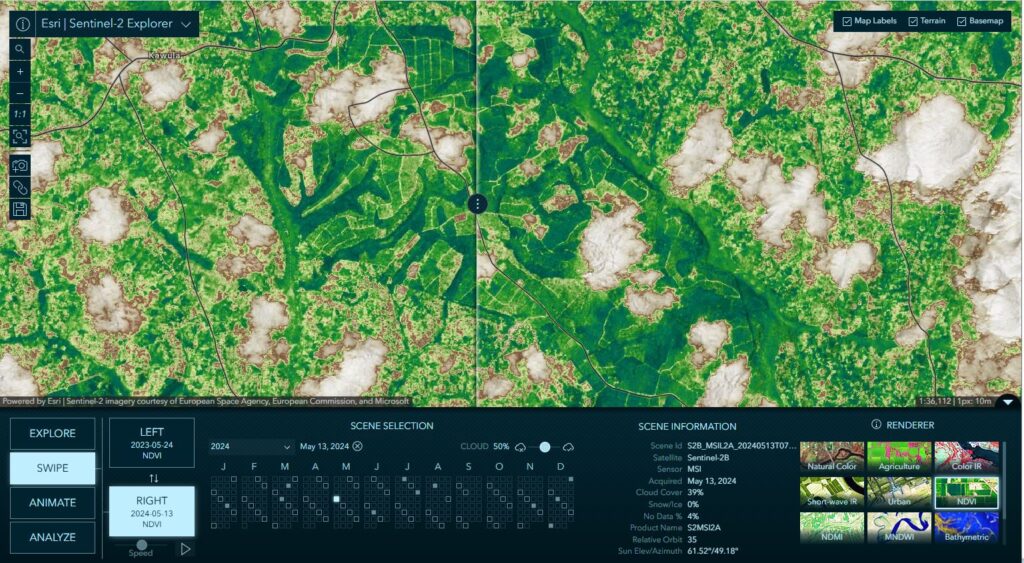
To strengthen compliance verification, stakeholders including the farmers can use tools like Esri’s Sentinel-2 Explorer to compare satellite images from the past five years, analyze NDVI data, and perform on-the-fly change detection. This could help the plantation when reporting this data to the exporter to enable their coffee to be placed on the EU market.
Agriculture Intelligence applied to the Coffee Supply-Chain
At the 2025 Esri User Conference [11], Esri rolled out the components of its geospatial Artificial Intelligence (AI) platform and the GIS Ag community suggested that AI should be reframed as Agriculture Intelligence by focusing on the critical attribute of “trust”. That trust must be built into systems where there is trusted data, trusted analytics and trusted knowledge. While this article has emphasized trusted data built on sound geoprocessing algorithms for spatial analytics, trusted knowledge is the key to providing agriculture intelligence to the coffee endeavor.
First, it’s key to understanding supply chain traceability to ensure that processors (e.g., roasters) do not taint the supply chain by mixing beans where one producer could be non-compliant. Through Esri’s ArcGIS Knowledge product, Knowledge Graph (KG) technology can easily show complex supplier relationships, that when coupled with geography and the aforementioned imagery solutions can facilitate the discovery of those tainted supply chains by visualizing the supply chain (see [12] for a tutorial on ArcGIS Knowledge for agriculture supply chains).
Second, when combined with a Large Language Model (LLM), KGs can be transformed from just a visualization tool to a source of knowledge for stakeholders around the supply chain or other knowledge sources, as discussed in [13]. By restricting answers to data in the KGs, these KGs can act as guard rails around the LLMs, reducing hallucinations and other errors. This controlled approach will be important for building trust in the system by minimizing incorrect information being disseminated to stakeholders.
Expected Outcomes
This approach demonstrates how EO and GIS workflows empower stakeholders to independently verify land use history, support sustainable sourcing practices, and meet EUDR requirements. The proliferation of open data and accessible geospatial tools democratizes agriculture intelligence, fostering transparency, climate resilience, and environmental stewardship across agricultural value chains. Transparency also serves as a deterrent to the fraudulent abuse of EUDR regulations, building trust in the system for EU companies and a fair playing field for honest producers.
By leveraging visual maps, stakeholders and even producers can quickly determine compliance by looking directly at the deforested areas. Automated checks against these maps during the Collect-Asses-Mitigate workflow can speed up the compliance process while reducing “red tape”. LLM/KG approaches will accelerate adoption of technology, will build trust, and will provide a platform for easily understanding the entire system. Finally, by combining trusted knowledge with trusted spatial analytics on a geospatial data platform, the EU will be in a better position to reduce the “risk with the load of information” that concerned EU’s environment commissioner.
Finally, by leveraging GIS, stakeholders, from smallholders to large exporters, can:
- Reduce compliance costs and complexity
- Accelerate adoption of digital tools
- Enhance transparency and trust across the supply chain
- Support climate resilience and sustainable land use
GIS is not just a tool for EUDR—it’s a foundation for scalable, cost-effective agricultural intelligence that can adapt to future regulations and market demands.