The Tepa Companies are small businesses 100% tribally owned by the Paskenta Band of Nomlaki Indians, a federally recognized tribe in California. A portion of Tepa, LLC’s revenue goes directly back to the Tribe and is reinvested in the local communities of Northern California. This mission-driven structure means that technical excellence in environmental science translates into lasting community impact. The Tepa Companies’ environmental division employs approximately 75 professionals, including a dedicated Conceptual Site Model (CSM) team of nine specialists, and their environmental operations are conducted through its 8(a)-certified subsidiary, Tehama ECS, LLC (Tehama ECS).
Challenge
Accurately characterizing contaminant behavior in the subsurface is one of the most analytically demanding challenges in environmental remediation. Tehama ECS’s CSM team was contracted to develop detailed basewide CSMs for 43 federal installations across the United States. A CSM is the foundational document for investigation and remediation efforts. CSMs describe sources and types of contamination; analyze subsurface lithology; identify migration pathways; and characterize potentially affected receptors such as drinking water wells, surface water bodies, and ecological resources. The more accurate and complete a CSM, the more effective and cost-efficient the resulting investigation design and/or remediation strategy can be.
At one site, the Tehama ECS team encountered a persistent and consequential problem: Contaminant plumes were not behaving as expected. Groundwater flow contours suggested the contamination should migrate in a broadly northwest direction. However, field data revealed plumes taking sharp, unexpected turns, funneling through narrow corridors, and spreading in patterns that defied straightforward interpretation. For example, one plume appeared to take a hard right turn rather than following the dominant flow direction. A plume at another source area showed contaminants concentrating and then dispersing in ways that standard lithofacies correlation methods could not explain.
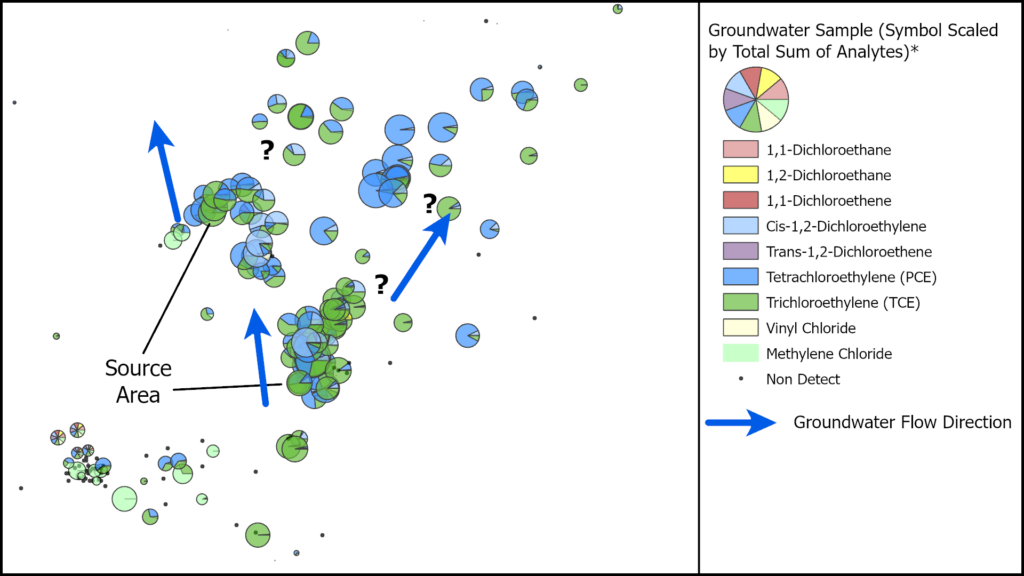
Traditional approaches to stratigraphic correlation typically “straight-line” connect similar sediment types to one another (e.g., sand to sand and clay to clay) without accounting for the depositional history that shaped those units and the associated impacts on groundwater flow. Historically, this traditional approach was applied and did not provide an explanation for the observed plume geometries seen at the site. Without understanding the true geologic controls driving contaminant migration, the federal client faced the possibility of incorrectly designing and locating remediation infrastructure, a costly outcome that could leave contaminants unchecked and prolong site cleanup timelines by years.
Solution
To move beyond the limitations of traditional stratigraphic correlation, the Tehama ECS team applied a depositional model framework grounded in Environmental Sequence Stratigraphy (ESS). ESS interprets the subsurface not simply by matching sediment types, but by reconstructing the sequence of depositional environments that created those sediments. This approach yields a richer and more geologically faithful representation of subsurface architecture, one that captures the erosional surfaces, coarse sediment packages, and confining features that ultimately govern how fluids and contaminants move underground.
For the project site, the Tehama ECS team integrated ESS interpretation with ArcGIS technology to build a spatially explicit model of the contact between two aquifer units. Using available lithologic logs, geophysical logs, and insights derived from the ESS evaluation, the team generated a continuous raster surface representing the elevation of this stratigraphic contact across the site. The processing workflow was developed in ArcGIS Pro and ArcPy, allowing the team to standardize data inputs, automate shapefile generation from the project database, and ensure consistency across the 40-plus sites in the contract. A custom ArcPy function developed early in the project parses large data deliverables, assigns proper datums, and generates site-specific geospatial products. This reusable tool has substantially accelerated site startup across the portfolio.
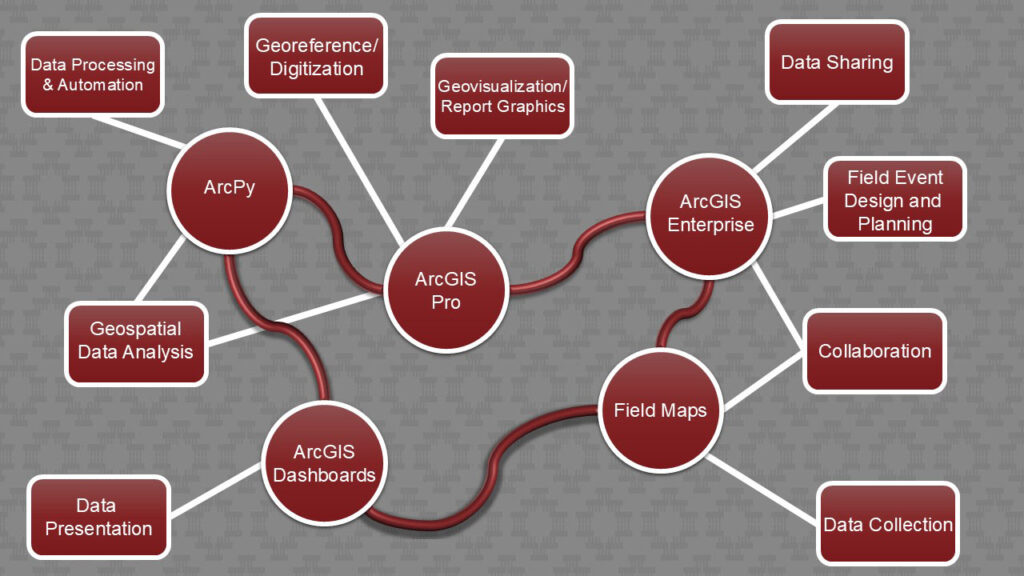
The team used ArcGIS Field Maps to standardize field data collection procedures; reduce human error; and integrate water level measurements, surface water elevations, and downhole geophysical data directly into ArcGIS Enterprise. This enterprise architecture enabled seamless data sharing with the client and provided a unified environment for analyzing all data types together: contaminant concentrations, subsurface lithology, groundwater flow information, and site infrastructure. ArcGIS Online dashboards were also developed to give the federal client a portfolio-level view of key site metrics across all active locations.
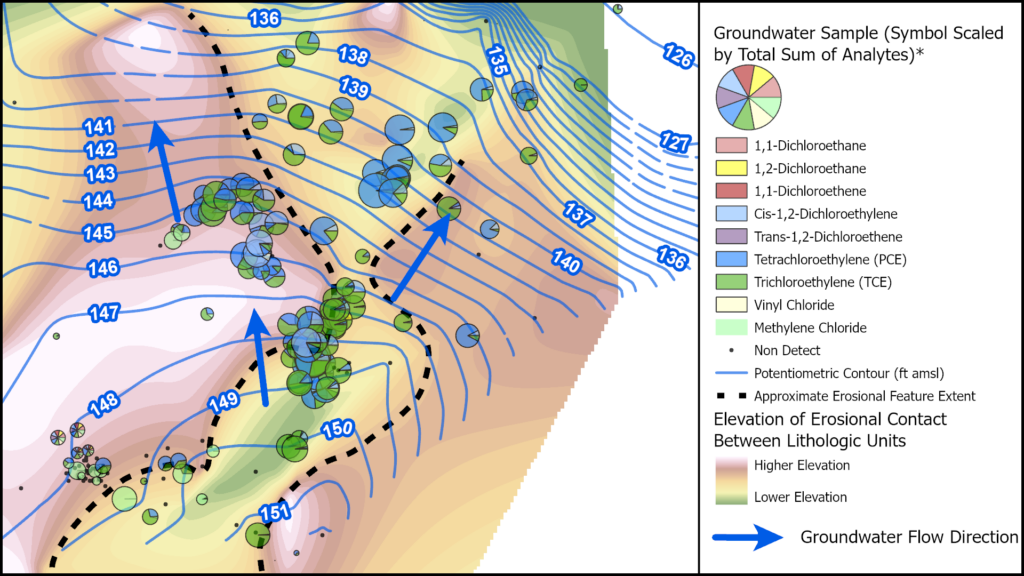
The erosional surface raster produced clear and consistent findings. The surface revealed clearly defined incised features that were determined to be buried channels, carved by ancient erosional processes, that were invisible using traditional stratigraphic analysis methods. When contaminant data was overlaid on these erosional features, a direct and consistent relationship emerged: The preferential pathways for contaminant migration coincided precisely with the incised portions of the surface. The plume that appeared to take an inexplicable hard right turn was, in fact, being controlled by a narrow subsurface channel that funneled contamination northeast before it opened into a broader zone of dispersion. By combining groundwater contours; contaminant concentration maps; flow direction data; and the new erosional surface into a single, coherent analytical picture, the Geographic Information System (GIS) environment made it possible to visualize all the relationships simultaneously.
The CSM findings were delivered to the client in a formal report supported by a comprehensive map package, which included all underlying data and graphics. The CSM report is applicable to both legacy contaminants and emerging contaminants such as per and polyfluoroalkyl (PFAS) substances, otherwise known as forever chemicals, and is intended to be a living document updated periodically by the federal client to ensure accuracy and relevancy. The map package is intended to be used by the client and shared with future contractors to eliminate duplication of effort, further refine the understanding of contaminant migration on a site-by-site basis (as needed), and aid in the design and optimization of current and future remediation systems.
Results
The application of ESS within an ArcGIS-driven workflow produced a fundamental shift in the client’s understanding of their site and in the precision with which remediation activities could be planned.
By identifying the incised erosional features that act as preferential migration pathways, the Tehama ECS team provided the federal client with a geologically defensible explanation for plume geometries that had previously resisted interpretation. This understanding will allow site managers to appropriately select, design, and position remediation infrastructure (e.g., pump-and-treat systems, permeable reactive barriers, or monitoring wells) based on the subsurface conditions governing contaminant movement rather than solely based on groundwater flow contours.
The reusable ArcPy workflow developed for the project enables the team to efficiently onboard each new site in the 43-installation contract, rather than rebuilding analytical pipelines from scratch. Instead, specialists apply an established process and adapt it to the unique geology of each location while carrying forward lessons learned from prior sites. This scalability is a direct product of early investment in GIS automation and enterprise data management.
This project demonstrates that a small business deploying the right combination of geologic reasoning and geospatial technology can deliver the kind of subsurface insight that meaningfully accelerates federal environmental remediation. The integration of ArcGIS Pro, ArcPy, ArcGIS Enterprise, ArcGIS Online, and ArcGIS Field Maps into a unified analytical and data management environment empowers the Tehama ECS team to process complex, multi-source datasets efficiently, visualize subsurface relationships that would otherwise remain hidden, and present findings in formats that support informed decision-making at every stage of investigation and remediation.
Learn more about location intelligence for AEC:
GIS for Architecture, Engineering, and Construction.
Stay Connected with Esri’s AEC Team:
Subscribe to the AEC industry newsletter “Esri News for AEC”.