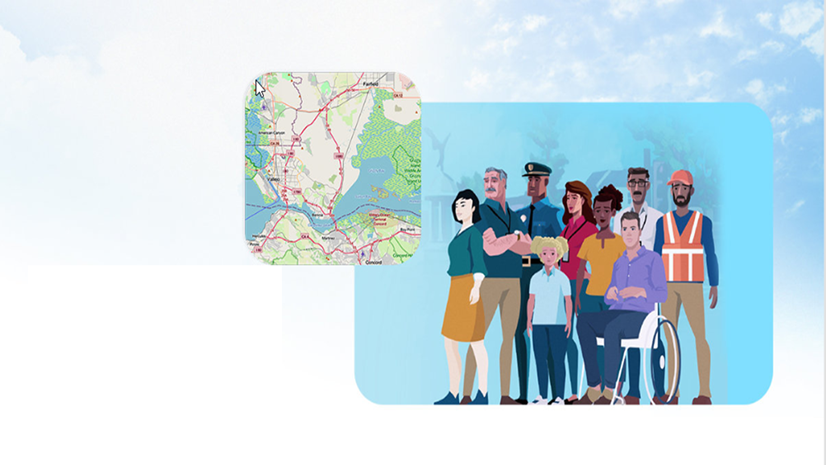
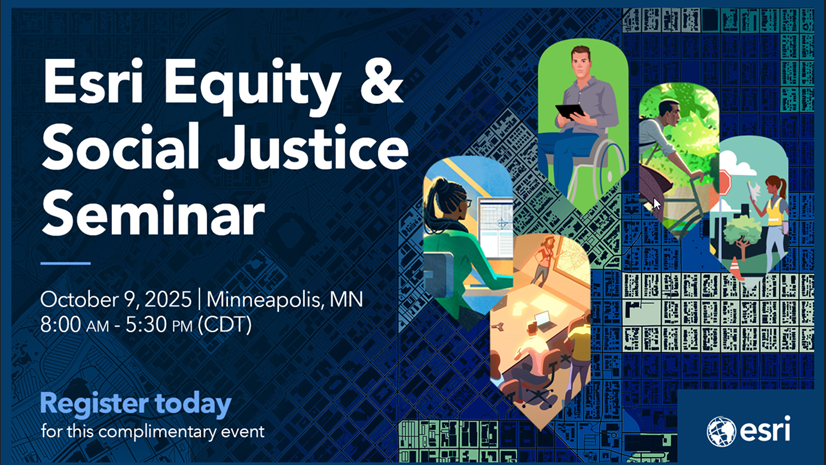
Esri hosted our second Equity and Social Justice Seminar in Minneapolis on October 9—a full-day, in-person event that offered a unique opportunity to share best practices, reflect on lessons learned, and explore the latest Esri tools and solutions.
The event convened leaders from state government, nonprofits, and advocacy organizations to explore how GIS can advance equity and economic mobility. Presenters shared practical applications—from affordable housing and tax credit outreach to park equity and youth training—demonstrating how spatial data empowers communities and drives inclusive policy. The seminar emphasized collaboration, community expertise, and the importance of accessible tools and language in equity work.
Through powerful presentations and real-world examples, five key themes emerged, highlighting the role of collaboration, lived experience, data depth, inclusive engagement, and practical tools in advancing equity and economic mobility.
1. Collaboration and Partnership Are Key
Every speaker emphasized the importance of cross-departmental collaboration and the power of public-private partnerships in advancing equity. Examples included:
- Esri Professional Services: Raynah Kamau, Geo Equity Lead, shared how her team has worked with over 40 organizations nationwide to develop equity strategies tailored to their missions.
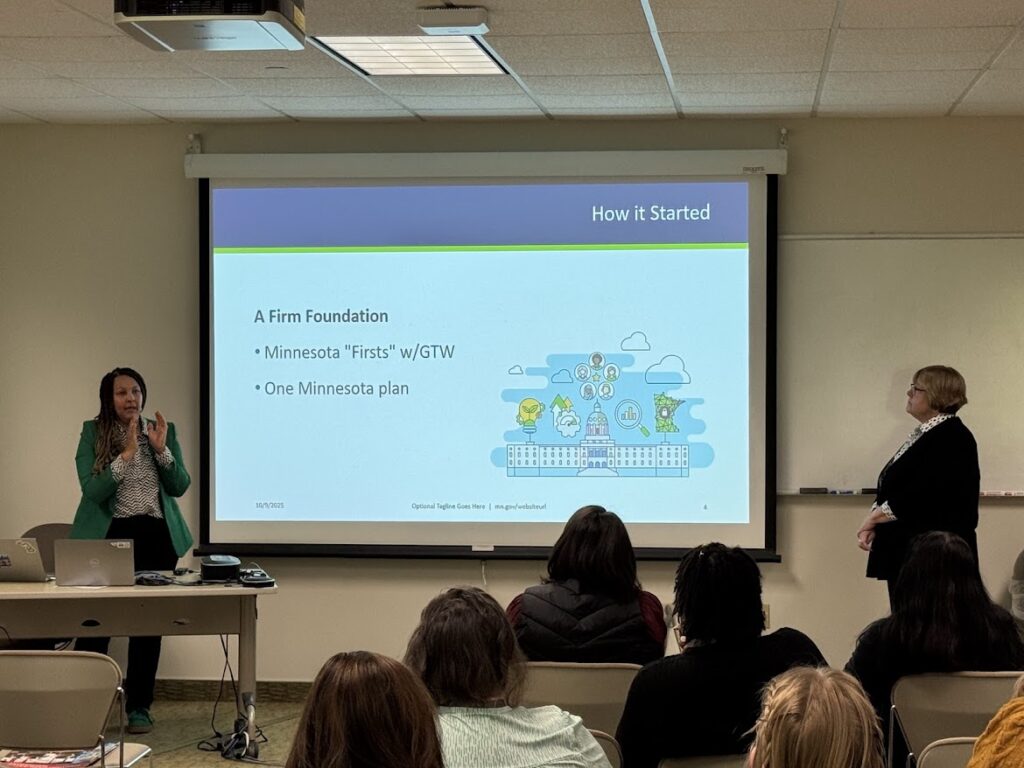
- The State of Minnesota’s Chief Equity Officer, Ashley Oolman, Geospatial Information Officer, Alison Slaats and GIS Supervisor, Sally Wakefield emphasized their work with community engagement practitioners.
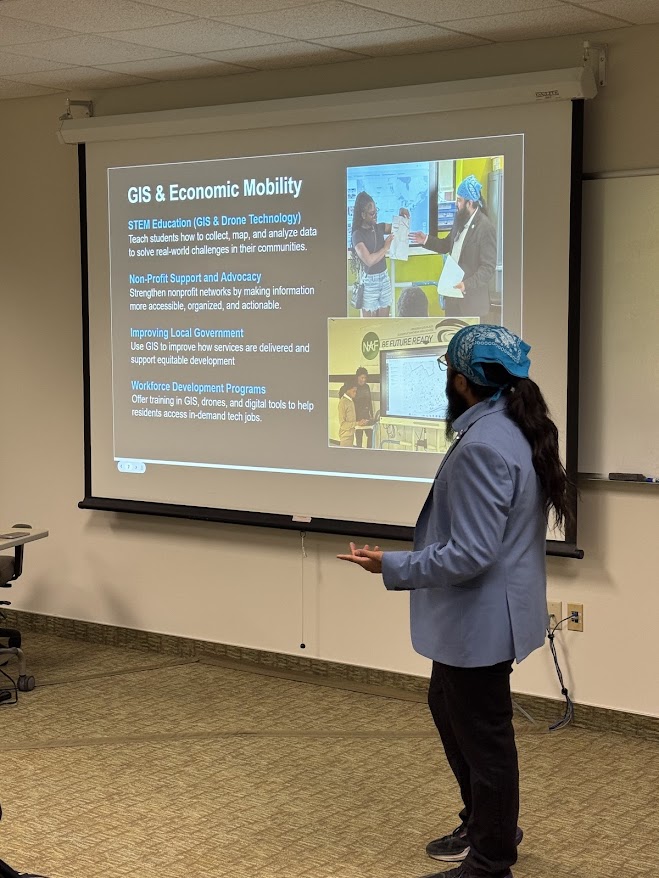
- Frank Romo, CEO of Romo GIS, and his collaborations with cities and schools.
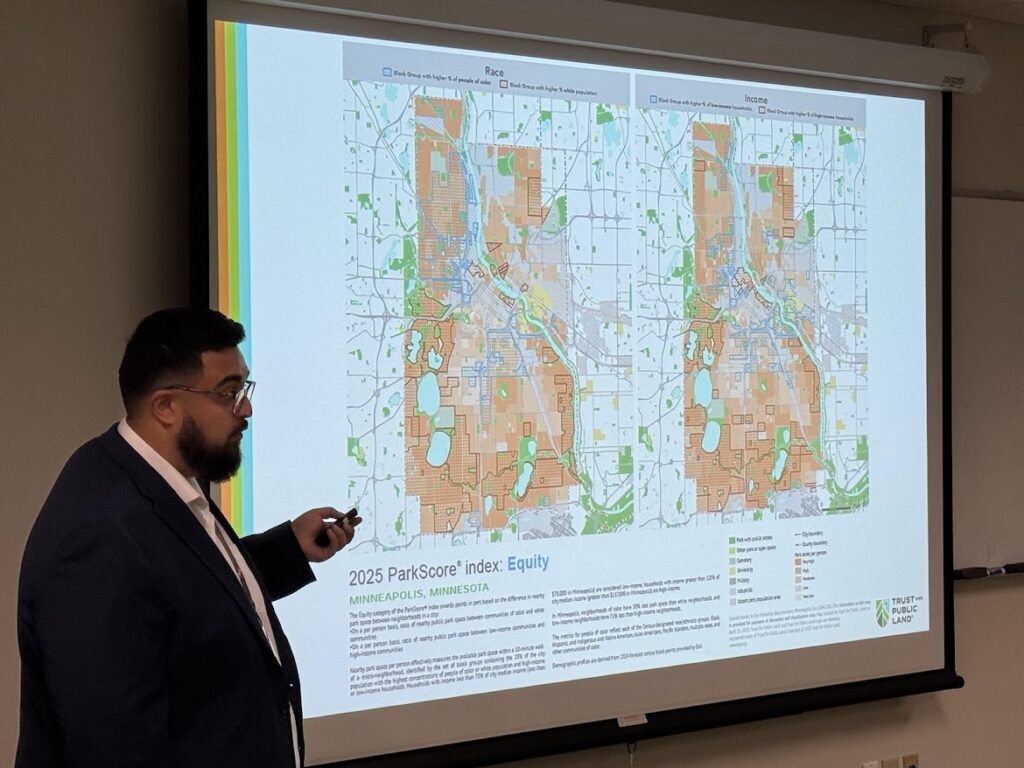
- Dale Watts, GIS Project Manager from the Trust for Public Land, who has helped gather data for over 100 cities across the country.
Equity work cannot happen in isolation—it thrives on shared effort.
2. A Shared Language for Complex Issues: Behind Every Data Point is a Lived Experience
GIS can serve as a common language for addressing multifaceted equity challenges. However, it’s essential to recognize that lived experiences reveal inequities every day.
Rather than centering conversations solely on emotion, Ashley Oolman encouraged a shift toward actionable facts—those we aim to change. She posed a critical question: How can we use lived experiences to understand inequities? These challenges aren’t abstract; they affect communities in every state.
Ashley illustrated this by connecting asthma to air quality. People with asthma, like myself, rely heavily on asthmas medication such as inhalers and nebulizer machines, often since childhood, and are sensitive to changes in temperature, most commonly though people with asthma react to poor air quality. While individuals experience the effects of air pollution on a personal level, states collect air quality data layers, like those in ArcGIS Living Atlas of the World, that can be leveraged to advocate for cleaner air and healthier communities.
Ashley emphasized that lived experiences deepen our understanding of inequity and economic mobility. For example, access to electricity and water at home are foundational indicators. Individuals lacking these basic needs may not have the capacity to seek out programs that could help them. When survival is the priority, engagement becomes difficult. This is where state and local governments can intervene—and GIS can help visualize these lived realities.
Beyond visualization, GIS is a powerful tool for advocacy, especially in addressing basic needs and the impacts of climate change on vulnerable communities. GIS offers a shared language that could be used in community engagement. GIS excites her because it offers practical tools to help communities move from historically disadvantaged conditions toward better outcomes. She underscored that public sector leaders have a responsibility to drive this change.
3. Single Metrics Can Mislead—Equity Demands a Deeper Dive
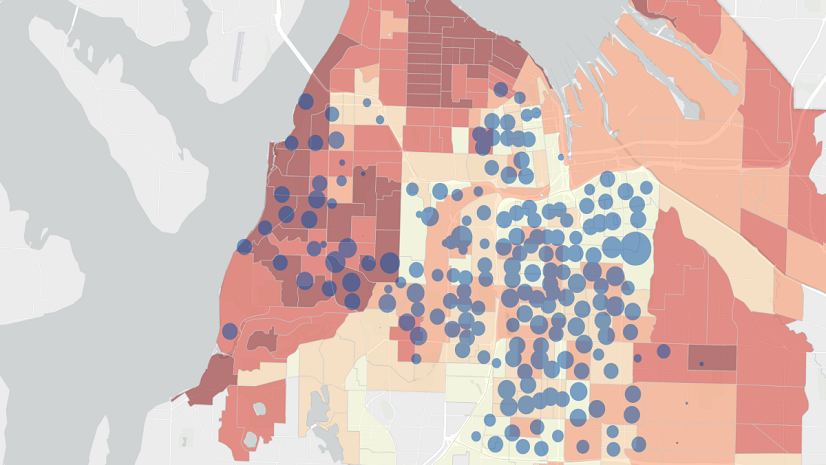
Alison Slaats and Sally Wakefield showcased the Minnesota’s Executive Briefing Tool—a curated map portfolio designed to better understand conditions affecting children, youth, families, climate, and workforce development across the state.
One example involved using GIS to address low uptake of the child tax credit. Although many residents were eligible, they weren’t applying—often because they didn’t know they qualified. GIS enabled a targeted community engagement campaign to raise awareness.
Similarly, Dale Watts from the Trust for Public Land pointed out that while Minneapolis residents may live within 10 minutes of a park, those parks might be unsafe, have limited hours, or lack accessibility. These examples underscore the need to enrich datasets when using GIS for policy decisions.
Presenters urged attendees to ask themselves what other questions can we ask about equity, accessibility, and economic mobility?
4. Empowering Non-GIS Ambassadors
Both Sally and Alison, along with Frank Romo, emphasized the importance of involving non-GIS professionals as ambassadors. The goal is to embed informed decision-making across entire organizations—not just within GIS departments.
Sally mentioned that Minnesota’s 2024 GIS Day featured speakers who were equity practitioners without GIS backgrounds. Romo also trains students and partners with organizations to promote broader GIS adoption.
Additionally, Esri’s Nonprofit Account Manager, Ariana Kim, shared details about the Esri Nonprofit Program, which allows certified 501(c)(3) organizations to join for just $100 per year.
5. Esri Provides the Tools You Need to Achieve Economic Mobility/review title
Esri offers a suite of tools designed to support equity initiatives. At the seminar, attendees explored Esri Professional Services for comprehensive geo-equity support, ArcGIS Living Atlas of the World layers, ArcGIS Business Analyst dashboards, and the Esri Social Equity Analysis solution for creating equity indexes.
Esri’s Economic Mobility framework, is anchored in four pillars:
- Quality of Life: Enables targeted interventions to enhance overall well-being for residents.
- Inclusive Infrastructure: Focuses on expanding access to public resources that create opportunities for advancement.
- Civic Inclusion: Prioritizes transparency and accountability to strengthen community engagement.
- Financial Stability: Highlights the importance of investing in the potential of disadvantaged populations to promote economic security.
Want to learn more about how others are achieving economic mobility with GIS? Download our latest Economic Mobility brochure and consider submitting your story to be included in our upcoming Esri Equity and Economic Mobility map booklet.
Looking ahead to 2026? We are planning to continue our seminar series next year, hopefully in a city near you. Stay updated by subscribing to our e-brief.