
Organize and enrich election results data by location
Use ArcGIS to enrich and organize election results so stakeholders can explore outcomes by location:
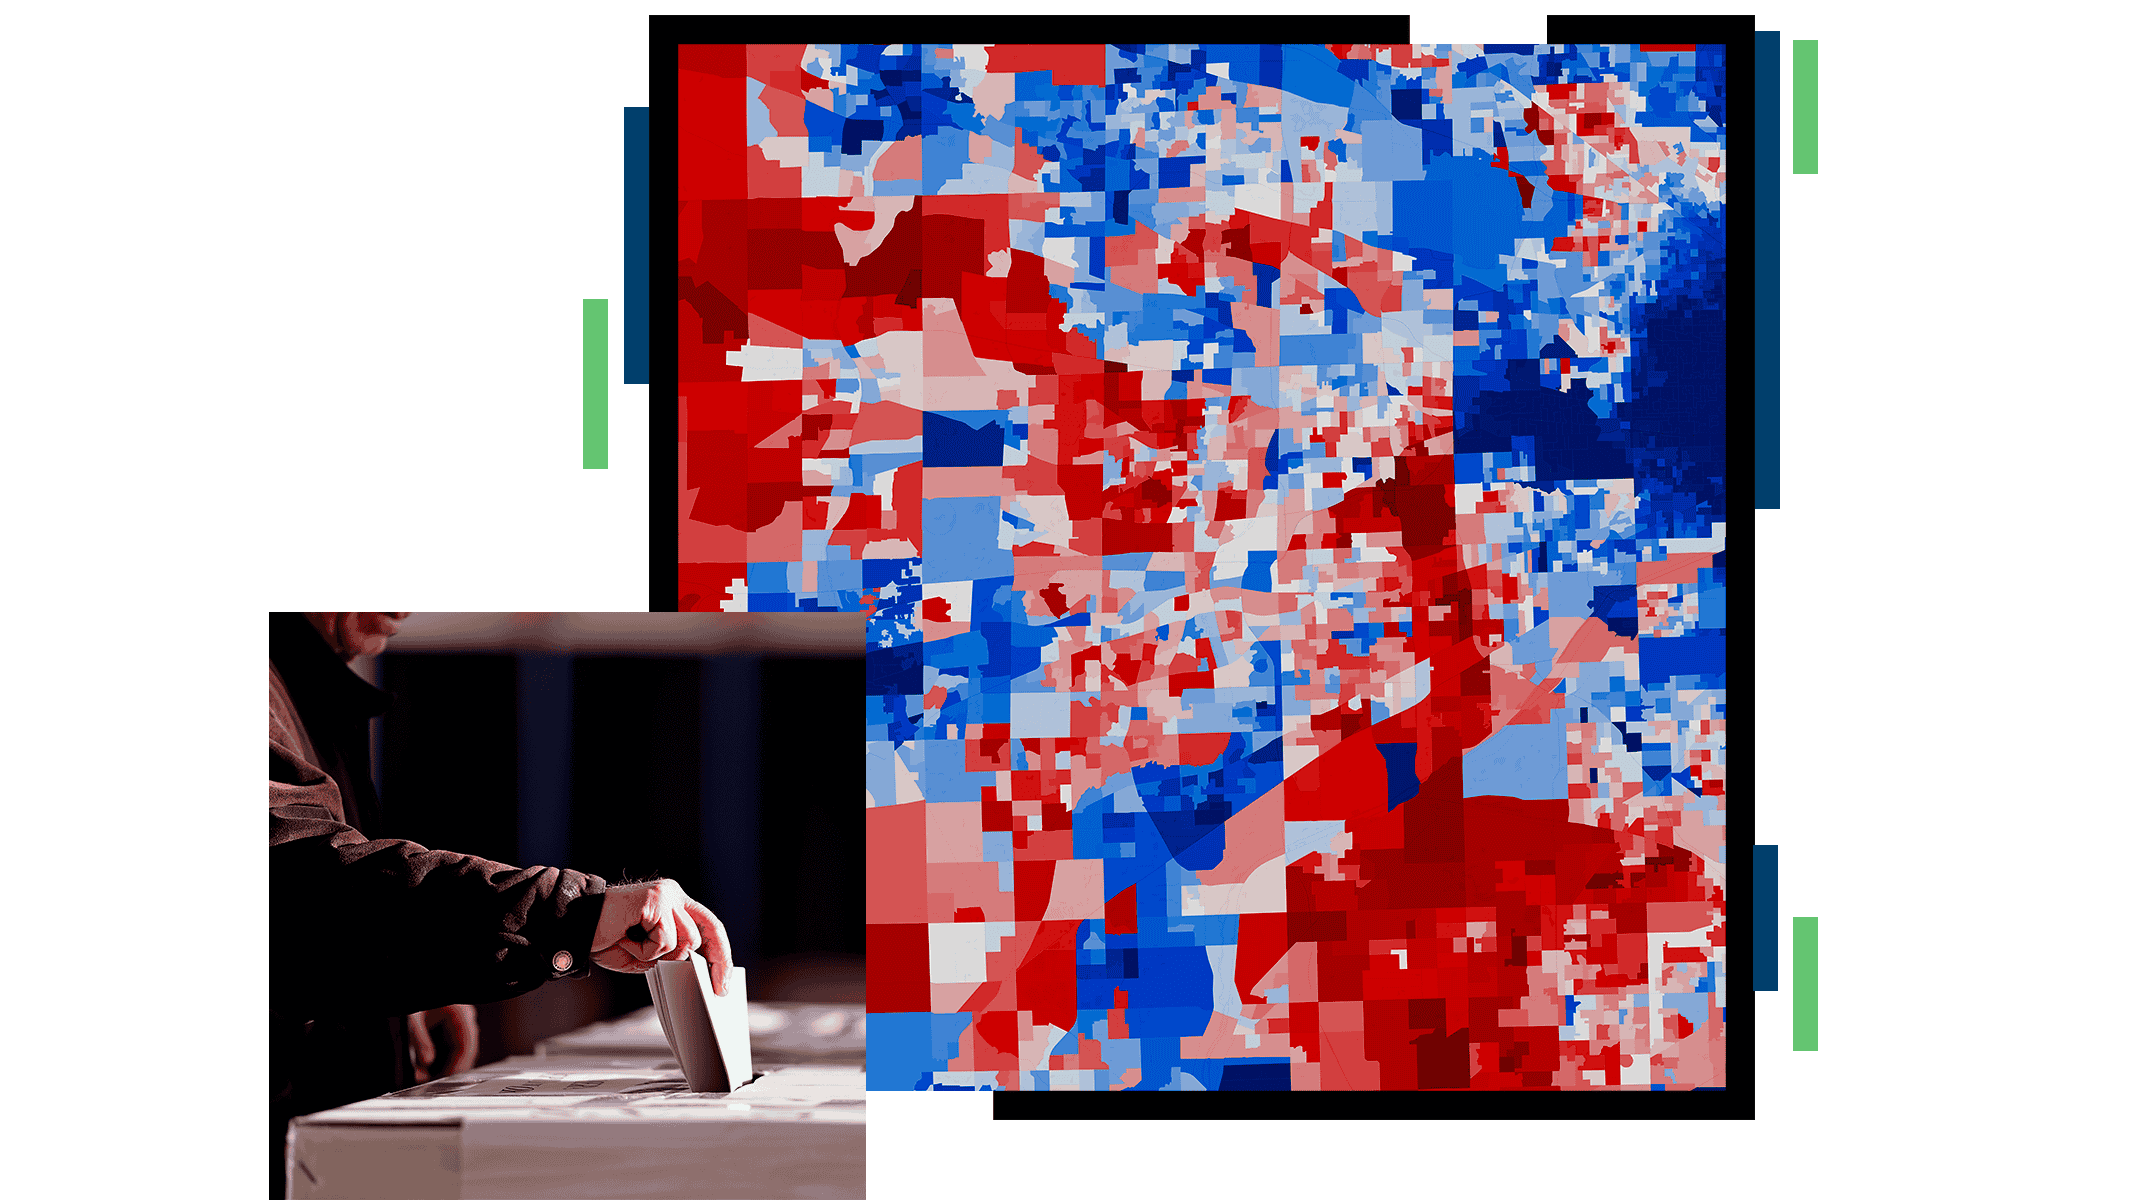
- Create interactive maps to feature election results by precinct, voting location, or district.
- Use dashboards to display voter participation rates, ballot measure outcomes, and comparisons across neighborhoods.
- Display vote totals and percentages.
- Filter results to see patterns at different geographic levels.
These can help the public and election administrators understand how specific areas voted and how results vary across a jurisdiction.


