
Election Operations

GIS-powered election operations software and election operations apps for comprehensive election management.

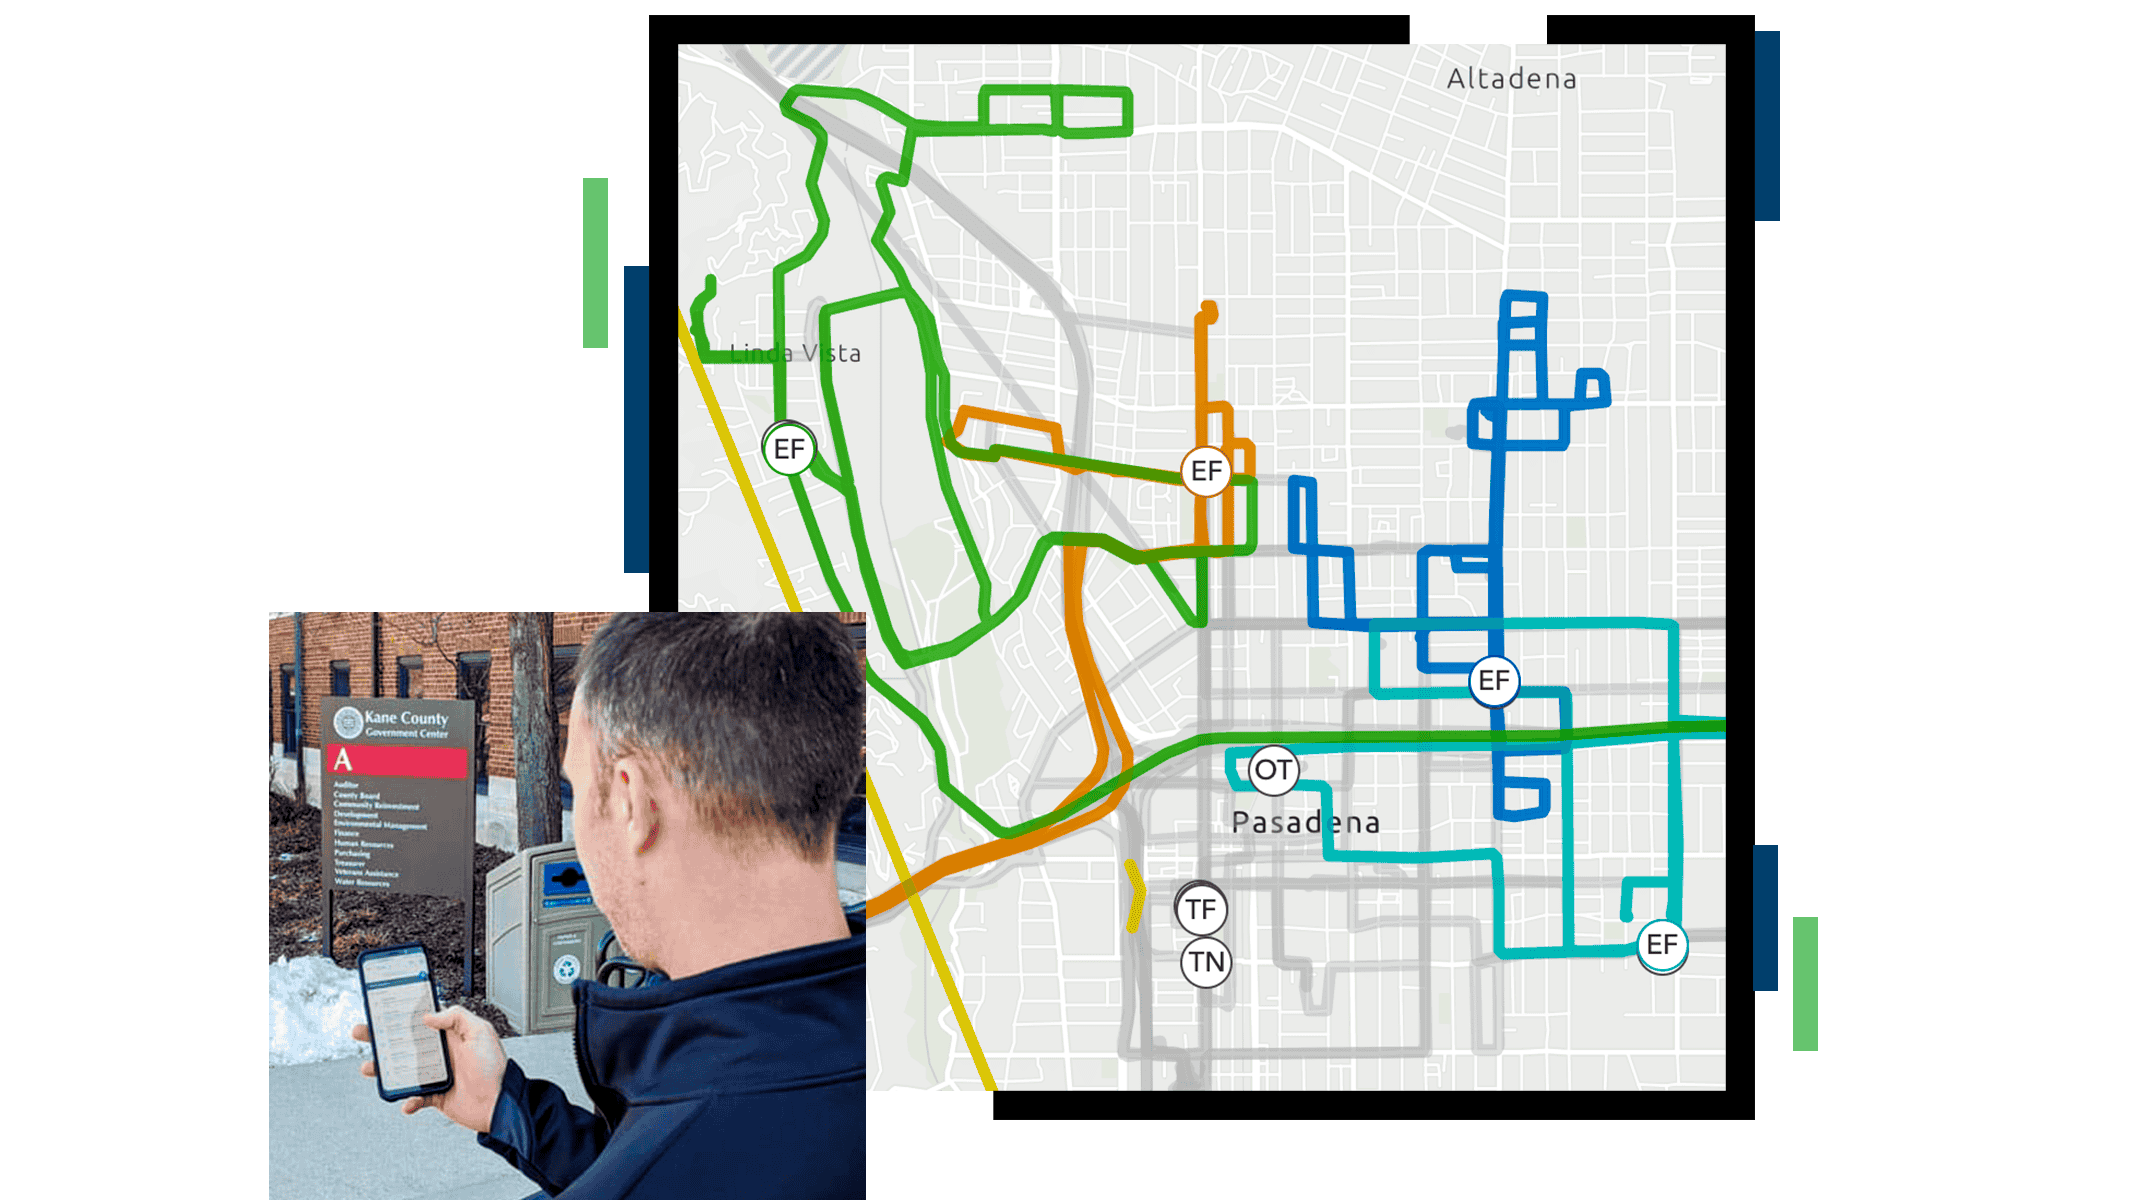
Person looking at a cell phone screen outside the Kane County Government Center and a map will poll iocation routes around Pasadena, California

Gain real time operational awareness across polling places

Use ArcGIS Dashboards and field tools to track voter wait times, elections equipment, ballot movement, and chain-of-custody status. Display the information on user-friendly maps and interactive dashboards for clear, real-time insight into conditions and resources.

Election officials can then respond quickly, keep operations running smoothly, and maintain voter confidence.

Manage election operations from a single system

ArcGIS brings election data, workflows, and real time updates into one connected election management system—giving teams shared visibility across polling location readiness and operations, asset movement, and issue response.

Use prebuilt apps to coordinate polling location updates and assistance

Help poll workers update wait times or request assistance with a simple, preconfigured mobile application.

Eliminate overloaded phone lines and manual data entry to reduce delays and improve response times across polling locations.

Integrate field data directly into your election management system with ArcGIS, so everything is captured clearly and consistently, in one place. 

Map of polling places on the Election Assistant app with buttons for reporting wait time and requesting assistance

Use live maps to track issues and coordinate response

Election Day demands fast, coordinated action. Create a live operational map in ArcGIS to capture issues in real time, immediately identify nearby resources, and send help where it’s needed most. Track issue resolution from start to finish to ensure nothing is missed.

Screenshot of Election Manager app with a list of issues on the left and a map with polling locations

Map and analyze voter feedback by location

Listening to constituents and addressing their concerns is a critical part of effective election administration. ArcGIS gives election officials the tools to capture and act on voter feedback.

  • Use mobile, web-based forms to collect voter sentiment and gauge satisfaction at specific locations.
  • Visualize feedback on a map to spot patterns and trends, then feed that data into your election management system to help officials decide where to allocate resources.

Election Peformance Dashboard with pop-ups of voter satisfaction survey responses

Track ballot movement and location with live maps

Use ArcGIS to track the location of ballot drop boxes and election equipment from deployment through return, so nothing is ever out of sight.

Live maps display where assets are, where they’ve been, and which locations need rover support maintaining a clear chain of custody and a quick response when issues arise.

Dashboard showing ballot box chain of custody tracking and a map

Share information with maps and dashboards

On Election Day, the media, the public, and internal teams rely on election officials for timely updates.
ArcGIS brings key metrics—such as wait times, voter feedback, equipment tracking, and issue reports—into a single web map dashboard.

This shared view gives teams real‑time situational awareness across polling places. Election offices can report status with confidence, respond to issues as they arise, and demonstrate transparency to internal and external stakeholders.

Elections Requests Dashboard showing request types, request status, and a map

Election Success Stories

Products and solutions for election operations

Manage election and polling place operations, identify sites, communicate wait times, and track elections equipment and ballot chain of custody with ArcGIS.

Previous
Next

Elections workflows

ArcGIS connects data, people, and processes across the election life cycle. Explore how geographic context helps election officials prepare, coordinate activities, and keep stakeholders informed with clear, trusted information.

Previous
Next

Frequently asked questions

Using ArcGIS election operations software, election offices can monitor polling location readiness, voter wait times, reported issues, ballot movement, and resource status.

Election operations dashboards provide a single operational view across early voting and Election Day, functioning as a poll-monitoring system.

When issues are identified and reported, ArcGIS shows where they are occurring and which resources are closest. Election operations apps support faster dispatch, helping election staff resolve issues quickly and reduce disruption at voting locations.

ArcGIS supports election equipment tracking by mapping the movement of ballots and elections equipment from deployment through return.

This resource management capability improves accountability and allows election offices to respond quickly when issues arise.

GIS dashboards give election leaders a real-time view of activity across all polling locations, helping them respond quickly during high-pressure periods.

With ArcGIS Dashboards, teams can:

  • Access maps, status updates, and key metrics on a single screen.
  • Track issues as they happen.
  • Monitor wait times, equipment status, and staff requests in real time.
  • Respond faster by spotting problems early and directing support where it’s needed.
  • Share the same information across teams. Dashboards are accessible across offices and polling locations, so everyone is working from the same up-to-date data.

Contact sales

Contact us

Outside the United States