|
|
|
Editor's Note: This article describes how to use sample 1:24,000-scale 7.5' digital elevation model (DEM) data files to
perform two-dimensional and three-dimensional modeling in ArcView GIS with the ArcView Spatial Analyst and ArcView
3D Analyst extensions.
Using ArcView Spatial Analyst, the author tells how to output a grid theme that can be used to
generate a thematic two-dimensional map,
What You Will Need
ArcView GIS 3.1
ArcView Spatial Analyst 1.1
ArcView 3D Analyst 1.0
60 MB of free hard drive space
Pentium-class PC with 64 MB RAM suggested.
|
compute an attractive hillshaded map, and create a contour line theme.
With the contour line theme, a triangulated irregular network (TIN) model can be built. Next, using ArcView 3D Analyst
he gives additional instructions on how to produce
a three-dimensional model by draping and modeling two-dimensional
data on a 3D Scene.
Steps for reducing the size of the area modeled by clipping the contour line theme are described in the accompanying article,
"Making Data More Manageable." This article explains how to create a custom theme that
can speed navigation and improve refresh rates. Even if the computer used for modeling is sufficiently robust to render a
large model, working with a smaller model while learning these techniques might be a good idea.
Visit the Terrain Modeling with ArcView GIS for additional resources for modeling with ArcView GIS.
Background and Sources for 7.5' DEM Data
USGS 7.5' DEM, a raster data set containing elevation information, has 10 x 10 meter data spacing.
After converting the data, it can be easily imported into ArcView GIS. Terrain models constructed
from elevation data can be used for a variety of purposes including line-of-sight forecasting, slope
and aspect determination, surface runoff pattern analysis, and drainage basin delineation. DEM data
at this scale is particularly useful because each data set provides the same large-scale coverage as a
standard USGS 1:24,000-scale quad map. Details regarding available coverages and procedures for
ordering DEM data sets can be obtained at the USGS Web site.
This project uses a DEM file downloaded from a source that provides converted 7.5' DEM coverages
of New York State at no cost. Another article in this issue of ArcUser magazine,
"Converting and Using SDTS Digital Elevation Model Data," describes
how to prepare DEM data downloaded from the USGS Web site using a free utility. Additional information
on converting and importing DEM files is available from the
ArcView GIS OnLine Discussion Forum at the Esri Web site .
Downloading and Converting DEM Data
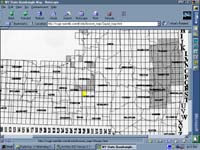
Locating and downloading the sample data set is the first step in this project.
- Create a new folder named DEMWORK to hold downloaded data files.
- Visit the Cornell University's Geospatial Information Repository (CUGIR)to download project data files.
Use the map's reference grid to locate and click on quad S 29 (Homer), the northwest quad in Cortland County. |
|
- This brings up a page showing the zipped USGS DEM files for this quad. Select and download 29elu.Z and S29hya.e00.Z to the DEMWORK folder. 29elu.Z is a UNIX-compressed USGS ASCII file that is 2,443 KB. S29hya.e00.Z is the hydrography file associated with this quad.
- After closing the browser, go to My Computer and open the DEMWORK folder. This folder should now contain both downloaded files. Because 29elu.Z is a UNIX-compressed file, use the WinZip decompression utility with the Classic option to extract the file. The decompressed file should be 9,225 KB. Rename it HOMER.dem.
- Unzip s29hya.e00.Z, the hydrography coverage, and rename it s29hya.e00. Use the IMPORT71 utility that comes with ArcView GIS to format the file so it can be used. IMPORT71 is a stand-alone program that converts an ArcInfo interchange file created on any other operating system into an ArcInfo Version 7.x coverage or grid. IMPORT71 appears as a program item in the ArcView GIS program group. If it is not in the program group, it should be found with the ArcView GIS programs in the bin32 subdirectory. To run IMPORT71, double click the IMPORT71 program item in the ArcView GIS program group to display the dialog box.
Create a Thematic Map in Two Dimensions
The downloaded and prepared data can now be used for two-dimensional modeling.
- Start ArcView GIS, load ArcView Spatial Analyst, create a new project, and open a view.
- Choose Import Data Source from the File menu. If Import Data Source is not available from the File menu, load the ArcView Spatial Analyst extension. Select USGS DEM as the file type and click on OK.
- HOMER.dem should appear in the list of Import USGS DEM files. Select it and click on OK.
- The Output Grid box appears with the default grid name imgrd1 (if this is the first output grid generated in this session). Rename the output grid HOMERS29. Allow the file to be placed in the Temp directory and click OK. Be patient while ArcView GIS calculates the new grid.
- When the Import Data Source HOMERS29 box appears, click Yes to add the new theme to the view. Now save the project with the name HOMERDEM by choosing File, then Save Project As.
Maximize the view and make the HOMERS29 theme active and visible. Use the Open Theme Table button to open and examine
the file structure. Select the column titled Value and click on the Sort Ascending button. The elevation values in this column
should range between 329 and 587 meters.
Make the HOMERS29 theme active and double click its legend to open the Legend Editor. Select Graduated Color as the
Legend Type and choose Value as the Classification Field. Click the Classify button, set the number of classes to 10,
and click OK. Type in the elevation ranges in the Value column of the Legend Editor, beginning with 320-350.
Each range should span 30 meters. The last range should be 590-620. There are several ways to enhance the HOMERS29 theme
to better visualize the data. A hillshade theme and a contour map can be created, and finally, the hydrography coverage
can be added to the view.
|
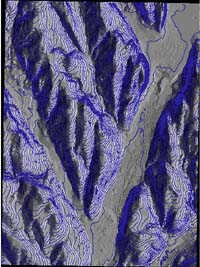
| The
grid theme can be used to create both hillshade and contours themes. Both themes are shown here. |
Creating a Hillshade
Choose Compute Hillshade from the Suface menu. In the Compute Hillshade dialog box, set the Azimuth at 95 and leave the Altitude
at the default value, click OK, and wait while the Hillshade of HOMERS29 theme is created. Make it the only active theme and display
it.
Generate a Contour Line Theme
The grid theme used to create the hillshade theme can also be used to create a contour line theme.
- Make HOMERS29 the active theme and choose Create Contours from the Surface menu.
- In the Contour Parameters dialog box, set the Contour Interval to 10, leave the Base Contour set to 0, and click OK. Display the Contours of HOMERS29 theme.
- Add the hydrography coverage, 29hya, as a theme in the view and display it. Save the project again.
Now examine the model. Note the rounded hills and partially filled valleys. This is a glacially sculptured landscape.
During the last Ice Age, valleys in this area were filled with glaciers more than 300 meters deep. At the end of this period,
outwash conditions created an abundance of sand and gravel deposits.
The quad northeast of the Homer quad, the Tully
quad, maps an area that includes the Tully terminal moraine. Drainage from the area mapped by the Homer quad flows to
the south, eventually joining the Susquehanna River. The Finger Lakes are located west of this area. The southern ends
of these lakes are blocked by substantial moraines, and drainage from these lakes flows northward to Lake Ontario.
Creating a Topography TIN
The Contours of HOMERS29 theme created in the previous procedure can now be used to build a TIN.
- Make the Contours of HOMERS29 theme active, choose Create TIN from Features from the Surface menu. Make sure ArcView 3D Analyst is loaded.
- In the Create New TIN dialog box, set Height Source to Contour, Input As to Mass Points, leave Value set to <none>, and click OK. Additional information on TIN creation options is available by clicking on the Help button in the dialog box.
- The Output TIN Name dialog box opens. Name the new theme HOMERTIN, allow it to be saved to the Temp directory, and click OK. The progress bar at the bottom of the view shows the rate of TIN creation. Be very patient. When the TIN is complete, its legend will appear in the view.
- Modify the appearance of the TIN by double clicking on the legend for the TIN theme to invoke the TIN Legend Editor.
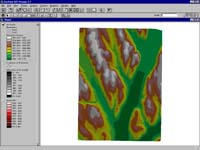
|
| Use Terrain Elevation #1 for the color ramp. Remember to click on Apply before closing each Legend Editor window.
|
- In the TIN Legend Editor, click the Edit button in the Faces section to edit the elevation range. Use the Classify button to change the number of classes to 10, and set the ranges at 30-meter intervals to match HOMERS29.
- Turn off the Contours of HOMERS29 theme. Make the HOMERTIN theme active and turn it on. Triangulated polygons will slowly build in the view.
Modeling Two-Dimensional Data in a 3D Scene
The TIN just constructed can be used in ArcView 3D Analyst to create a 3D Scene.
- Make sure ArcView 3D Analyst is loaded and make the project window active.
- Click on the 3D Scenes icon, located at the bottom of the project window below Scripts, then click the New button. Two windows open—the 3D Scene-Viewer window and the 3D Legend window. Neither window can be minimized, but both can be resized and moved. Size and position both windows so that the two-dimensional view with the TIN theme is accessible.
- From the 3D Scene menu choose Properties to open the 3D Scene Properties window. Set Map Units to meters, Vertical Exaggeration to 3, and the Background Color to light blue. Set Sun Azimuth to 95 and Sun Altitude to 45. Click on OK.
- Make the two-dimensional view active and make HOMERTIN the only active theme. Turn it off. Choose Edit, then Copy Themes. Make the 3D Scene-Viewer the active window, and choose Paste from the Edit menu.
- Use the same procedure to copy the hydrography theme to the 3D Scene-Viewer. To convert the hydrography theme to a 3D shapefile, make it active and select Convert to 3D Shapefile from the Theme menu. In the first dialog box select Surface for Get Z Values From, and in the second dialog box use HOMERTIN for Choose Theme to Use as Surface. Name the new theme s29hyd3D and add it to the view. Choose 3D Properties from the Theme menu to set the Offset Heights option to 5.
- Before starting the 3D rendering process, set the theme drawing priorities to a simpler hydrography scene when navigating. Make the hydrography theme active, choose Theme, then 3D Properties to invoke the 3D Properties dialog box. Click the Advanced button to bring up the Advanced 3D Properties dialog box. Uncheck the second box next to Draw Theme When Not Interacting. Exit both dialog boxes by clicking OK.
- Because the Homer 3D Scene is more detailed, use the opposite Advanced setting for it. Make Homer 3D the active theme, choose Theme, then 3D Properties, click on the Advanced button, check the Draw Theme When Not Interacting box, and uncheck the Draw Theme When Interacting box.
- Make both themes active and start the three-dimensional rendering process by turning on the hydrography theme. When it is displayed, turn on the HOMERTIN theme. The process will take several minutes. Be patient. After admiring this model, turn the 3D themes off and save the project.
Summary
These steps show how to produce very attractive
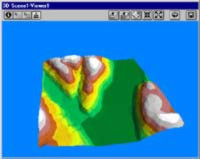
|
|
A portion of the model rendered in ArcView 3D Analyst |
and highly detailed three-dimensional terrain models with minimum effort.
The USGS 7.5' DEM data files used in this tutorial, available from the Cornell University Web site, provide a good start
working with DEM data for two- and three-dimensional modeling since they are free, do not have to be massaged with a
conversion utility, and can be loaded directly into ArcView GIS with ArcView Spatial Analyst or ArcView 3D Analyst.
For further information contact
Dr. David Miller
Geography Department GIS Lab
SUNY College at Cortland
P.O. Box 2000
Cortland, NY 13045
Tel.: 607-753-2996
E-mail: Millerd@snycorva.cortland.edu
|
| |