ArcWatch: GIS News, Views, and Insights
January 2013
Arnold Arboretum of Harvard University Goes Mobile
By Matthew DeMeritt
Esri Writer
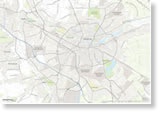
Whether you access Arnold Arboretum of Harvard University's new Mobile Interactive Map while standing in the arboretum's lush gardens or from an office 1,000 miles away, the new application makes learning about and researching plants interesting and easy.
The application, created using ArcGIS, lets people tap any one of about 15,000 dots—each representing a single tree, flower, shrub, vine, or other plant—on a basemap to obtain information about the plant. Available data includes condition, country of origin, provenance, and year of acquisition.
"Every individual plant in our collection has a special story," says Michael Dosmann, curator of Living Collections. Arboretum visitors can use the application to plan self-guided tours. The facility also serves as a rich resource for botanists around the world. Read the article.

Using the Mobile Interactive Map on your smartphone, you can explore Arnold Arboretum and learn more about the plant life you see around you.

Tip of the Month
Use PNGs in Picture Marker Symbols
PNGs in ArcGIS picture marker symbols offer fast drawing and a smooth appearance at any scale. Read this tip to learn how to create picture marker symbols using PNGs.
Connect with ArcWatch
ArcWatch is published monthly by Esri and contains GIS news, practical advice, and updates about the company's software and events. To submit article ideas, e-mail editor Carla Wheeler at arcwatch_editor@esri.com.
Join the Conversation
A Master's in Geodesign
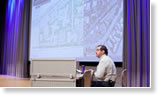
Philadelphia University will soon offer a master of science (MS) degree in geodesign, one of the first degrees of its kind in the nation. Geodesign combines technology such as GIS and building information modeling with design techniques. Geodesign fosters collaborative decision making and integrates design evaluation into the workflow. "Geodesign is smart design," says James Querry, a Philadelphia University adjunct faculty member. Read the article.
Geodesign Summit to Begin
The Geodesign Summit gets under way next week at Esri in Redlands, California. Oscar-nominated film visual effects designer Bran Ferren will be the keynote speaker for the event, which will focus on coupling geospatial technologies with design processes to create innovative and sustainable designs. Learn more and follow what's happening at the summit on Twitter by using the hashtag #GeodesignSummit.
See What's Possible in Washington, DC
The Esri Federal GIS Conference opens up opportunities for you to learn how geospatial technology can help your organization reach well-informed decisions and better serve citizens. More than 100 sessions will cover topics such as web mapping, cloud GIS, analyzing social media, and mapping in SharePoint and on a smartphone. Register today and join Esri February 25-27, 2013, at the Walter E. Washington Convention Center in Washington, DC.
Build Territories from Points
This video demonstration shows you how to build territories from point-based layers using Territory Design 10.1, which is part of Esri Business Analyst technology.
Building with Esri CityEngine
Xavier Opigez of IAU, the major urban planning agency in France, created this video and 3D rendering of La Défense business district in Paris and the planned Phare Tower using Esri CityEngine, Google SketchUp, and Lumion. "I used CityEngine for building the roads and surrounding cityscape," he said. He generated 24,000 buildings with CityEngine. Phare Tower will be a 984-foot-tall skyscraper and should be completed in 2017.
Mapping Where Parks Are Needed
The Trust for Public Land's ParkScore uses Esri technology to map where the need for parks is high in Washington, DC, and 39 other US cities. Which city ranked the highest in being park friendly? View ParkScore.
A Better View of the United States and Western Europe
More than 50 terabytes of new imagery from DigitalGlobe was recently added to the World Imagery Map, providing a more detailed view of parts of the United States and western Europe. Read the article.
Podcast: Using GIS to Manage Utility Assets
Kurt Towler, GIS coordinator for Sulphur Springs Valley Electric Cooperative in Arizona, explains how his utility uses ArcGIS to manage assets such as power lines all the way from the substation to the consumer's house. Listen to the podcast.
Be Data Wise
Do you need the latest and most accurate US demographic data? If you do, try Esri Updated Demographics for 2012/2017.
Mapping Cases of White-Nose Syndrome in Bats
This Esri story map shows you where deadly white-nose syndrome is devastating bat populations in the eastern United States. A timeline shows how the disease has spread from New York to Pennsylvania and beyond.
World Topo Map Redesign
Esri recently redesigned the world topographic map. This article explains some of the major changes to the map (such as having fewer point symbols and no more red roads) and why they were implemented.
ArcGIS Online Update: See What Esri Just Added
A New Version of ArcGIS API for Flex and ArcGIS Viewer for Flex Released
Here's Looking at You, GIS
You are GIS! So meet and connect with like-minded people who share your enthusiasm for geospatial technology at the 2013 Esri International User Conference. Want to start planning your week? Scroll through the list of preconference seminars and see what GIS topics interest you and suit the type of work you do.
Python Book Published
Python is the programming language Esri recommends for working with and automating tasks in ArcGIS. Python Scripting for ArcGIS, new from Esri Press, will help experienced ArcGIS users develop skills for working with spatial data and create specialized Python tasks, functions, and classes. No previous programming experience is required. An accompanying DVD includes exercises. You also will get access to a 180-day license for ArcGIS 10.1 for Desktop. Buy the book.

Newsroom


Developing with ArcGIS
"By and for Developers" is the motto of the Esri International Developer Summit, and Esri staff takes that to heart when planning sessions for you. The goal is to answer your questions and give you everything you need to get started building great applications using Esri ArcGIS. "If I had to pick one conference to attend each year, this would be it," says Diane Williams from the US Bureau of Land Reclamation. "Having access to the backroom folks is invaluable." Register today.
Debug Python Toolboxes in Three Simple Steps
You can troubleshoot and debug a Python toolbox to fix errors. Here's how.
What's Next for ArcGIS Runtime SDK for Android
The 10.1.1 update to ArcGIS Runtime SDK for Android, coming this year, will provide expanded capabilities for routing, new layer types such as OpenStreetMap, and software development kit enhancements. Read the blog.
Designing Maps with ArcGIS
This two-day, instructor-led course will teach you how to create attractive and interesting maps that are easy to interpret and properly designed for the intended audience.
New Version of Esri Maps for IBM Cognos Released
Read this blog detailing what you will find in the new release and watch this video that demonstrates how to add maps to reports.
ArcGIS: The Year in Review
Esri technical evangelist Bern Szukalski rings in 2013 with a look back at the most significant technology news at Esri in 2012. What's coming next? Read his blog.
From the Applications Prototype Lab at Esri
See the results of experimenting with texture mapping in the lab late one night.
Shrink Your File Geodatabase
New Course: Transforming Data Using Extract, Transform, and Load Processes
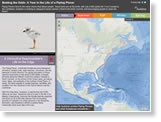
Beating the Odds: A Year in the Life of a Piping Plover
Find out what threats face piping plovers as these endangered but plucky shorebirds make their annual migratory trek from points north such as Prince Edward Island, Canada, south to the Caribbean. View the story map from Audubon and Esri.
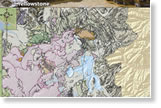
A Geologic Wonder
Wyoming State Geological Survey used Esri's ArcGIS for a project that included creating the Yellowstone Geologic Database. Besides providing the local GIS data center, an online mapping application lets you explore the area's geology and past seismic and volcanic activity. Read the article.
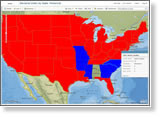
Election Results over Time
Esri education manager Joseph Kerski explains in this blog how election results can be studied using data that's mapped in ArcGIS Online. He created this map, which uses a dataset of state-by-state electoral votes for US presidential elections dating back to the Dwight Eisenhower-Adlai Stevenson race in 1956.
Be a Smart City: Get a Checkup with Community Analyst
Esri will offer free community health checkups using Esri Community Analyst software at the 12th Annual New Partners for Smart Growth Conference in Kansas City, Missouri, February 7–9, 2013. Visit the Esri booth and sign up to see how your community is doing. Does it have equitable access to parks, grocery stores, and mass transit?
Join a User Group
Consult this map to find other Esri technology users near you who want to share experiences, data, and software tips.
Watch Two Live Training Seminars
Tune in to see these free live training seminars: Put Your Community on the Map, on January 24, 2013, and Beyond Where: Using Regression Analysis to Explore Why, on February 7, 2013. You can ask the presenters questions via e-mail after the seminar. Learn more and subscribe to receive reminders.
The New Geographers
Read these stories about interesting people who put GIS to good use and make a difference in the world.
A Location Analytics Primer
New White Paper: Reveal More Value in Your Data with Location Analytics
Get Your ArcGIS for Local Government Applications at GitHub
Hardware Offers
Technical Talk

Web Resources and More
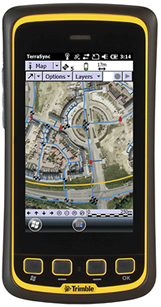
Esri offers US customers the Trimble Juno 5D Rugged IP65 smartphone-inspired handheld GPS receiver for use with ArcGIS for Windows Mobile. Combining the convenience of a smartphone with ruggedness, the functionality customers need, and professional software, the Trimble Juno 5 series is a flexible, real-world asset management and GIS update tool. Learn more about all Esri and Trimble offers.
Visit the Esri Store to find more software and extensions, upgrades, data, books, and hardware bundles.