ArcGIS API for JavaScript at version 4.24 adds a reference-Scale property to the HeatmapRenderer. (The HeatmapRenderer renders point features in FeatureLayers, CSVLayers, GeoJSONLayers, and OGCFeatureLayers as a raster surface.) The referenceScale property allows you to fix the configuration settings for a heat map at a specific scale level, making the density appear consistent at all scales.

HeatmapRenderer dynamically updates surface density as the user zooms in and out, which makes it hypersensitive to scale. The way you configure a heat map at one scale may result in a misleading visualization at other scales.
By default, heat maps appear denser as they are zoomed out, which sharply contrasts with the density at the original scale. This is jarring and may confuse the viewer. Conversely, heat maps appear to disappear as they are zoomed in, which may cause the viewer to ask where the data went.
While the effect can be confusing for the end user, it makes sense when you consider that points generally appear more dispersed at large scales and dense at small scales. Let’s take a look at a few ways for configuring a heat map to work well at various scales starting with the new referenceScale property.
The referenceScale Property
This property allows you to lock the visualization to a specific scale. This makes the heat map static, so the density surface remains consistent as the map is zoomed in and out.
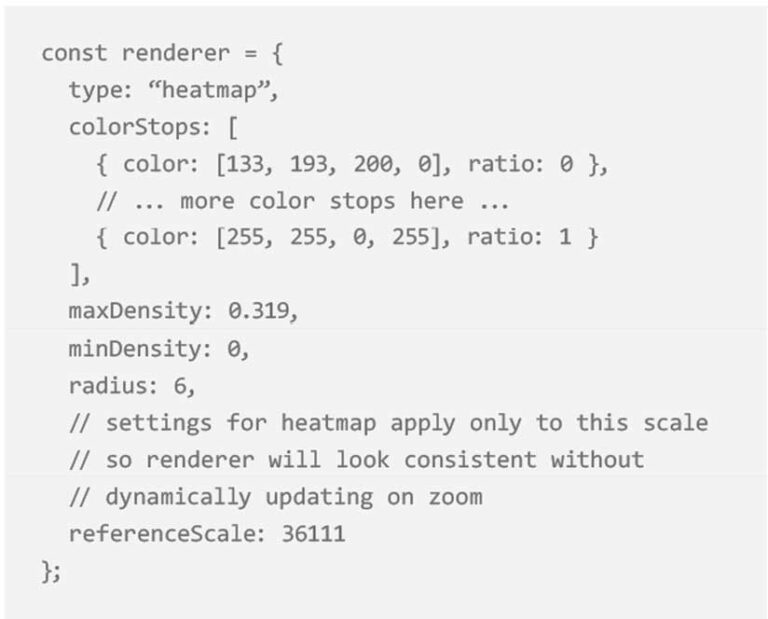
Table 1 shows the differences in a map configured with and without a reference scale when zoomed in and out. To enable this behavior, simply set the referenceScale property to the view scale at which the heat map is authored, as shown in Listing 1.
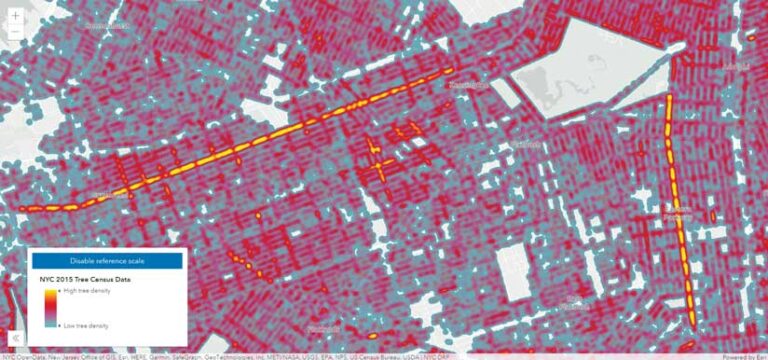
The sample heat map in Figure 1 showing New York City tree census data demonstrates how the same heat map looks with and without a reference scale. The reference scale can be toggled off and on. Zooming in and out will demonstrate how the density remains constant in the initial view. View the code for this app.
Setting a reference scale works great when the user is naturally inclined to zoom out from hot spots to see more context. It is not as useful if the user attempts to zoom to large scales at which heat map patterns are no longer visible. For that reason, it is best to always set the referenceScale property in combination with one of these techniques:
- Navigation constraints
- Visible scale range
- Scale-dependent renders
Navigation Constraints
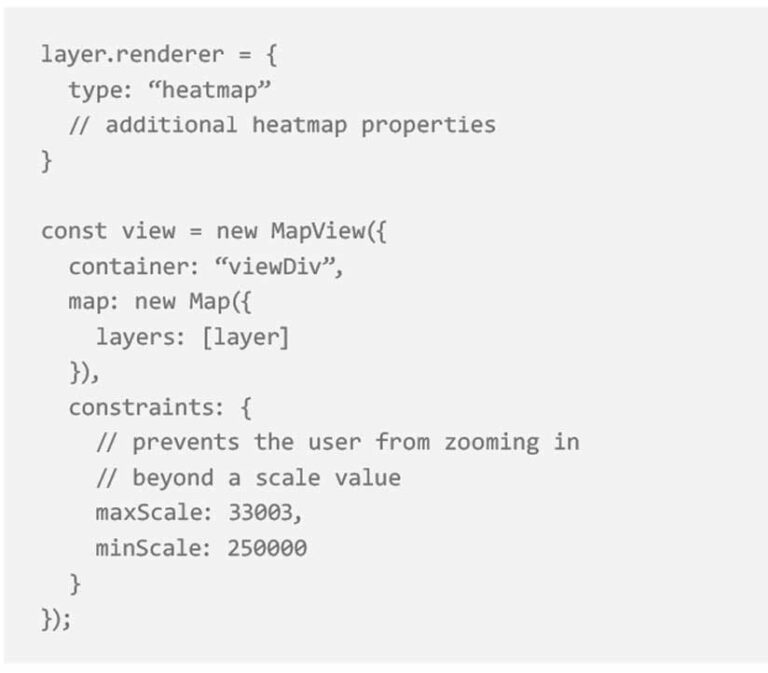
Constraining the maxScale value of the view prevents the user from zooming in past a specific scale level as shown in Listing 2.
The app in Figure 2 shows data on motor vehicle crashes in New York City for 2020. Adding view constraints ensures that the user will never zoom to the point at which the heat map appears either too cold or too hot. On the app, click the Toggle view max scale button in order to see how constraining view navigation affects the user experience when zooming in and out. View the code.
Keep in mind that setting a view constraint applies globally to the view and only works well when there is no other data to view at larger scales. If the user is required to view other datasets at other scale ranges beyond the constraints, you should set a visible scale range or use scale-dependent renderers.

Visible Scale Range
Setting a maxScale value on the layer itself will cause the layer’s visibility to toggle off when the user zooms beyond a specific scale value. Listing 3 provides an example of how it is set.
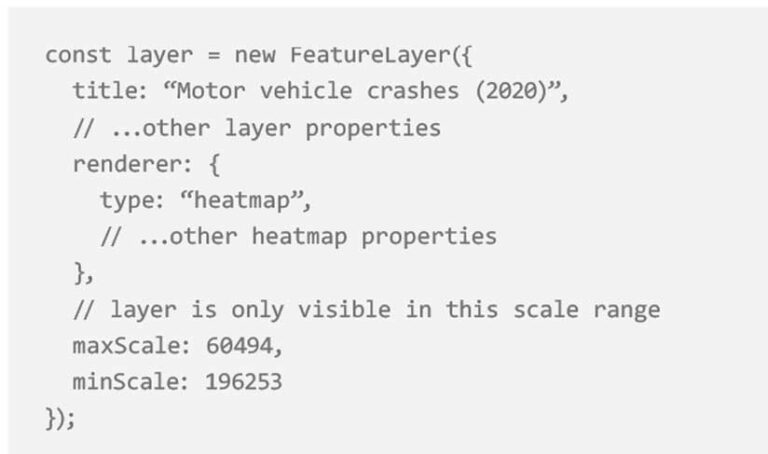
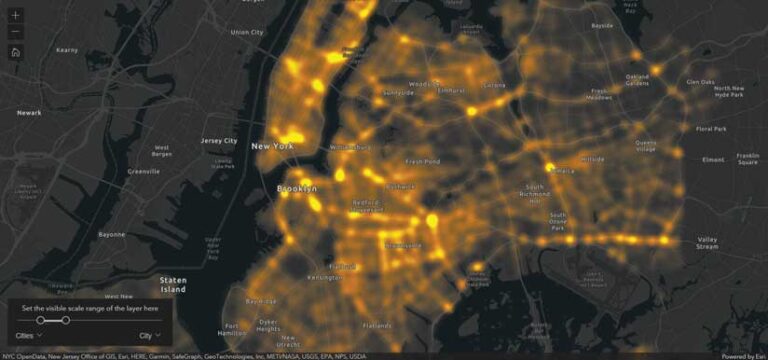
The app in Figure 3 shows motor vehicle crashes in New York City for 2020 and includes a visible scale range, set using the ScaleRangeSlider widget. Zooming in and out demonstrates how setting the visible scale range affects the user experience. View the code.
This technique works well if the data becomes irrelevant at larger scale levels. If the end user also needs to see data from the heat map at large scales, consider toggling from a HeatmapRenderer to a renderer showing discrete points.
Scale-Dependent Renderers
When the user zooms in so far that points largely appear dispersed, then it may make sense to switch the layer renderer to one that shows discrete locations for each point such as SimpleRenderer, UniqueValueRenderer, ClassBreaksRenderer, or any renderer that also uses visual variables to visualize the data.
To implement this behavior, set a watch on the view’s scale property and toggle between the renderers when the threshold is crossed in either direction, as shown in Listing 4.
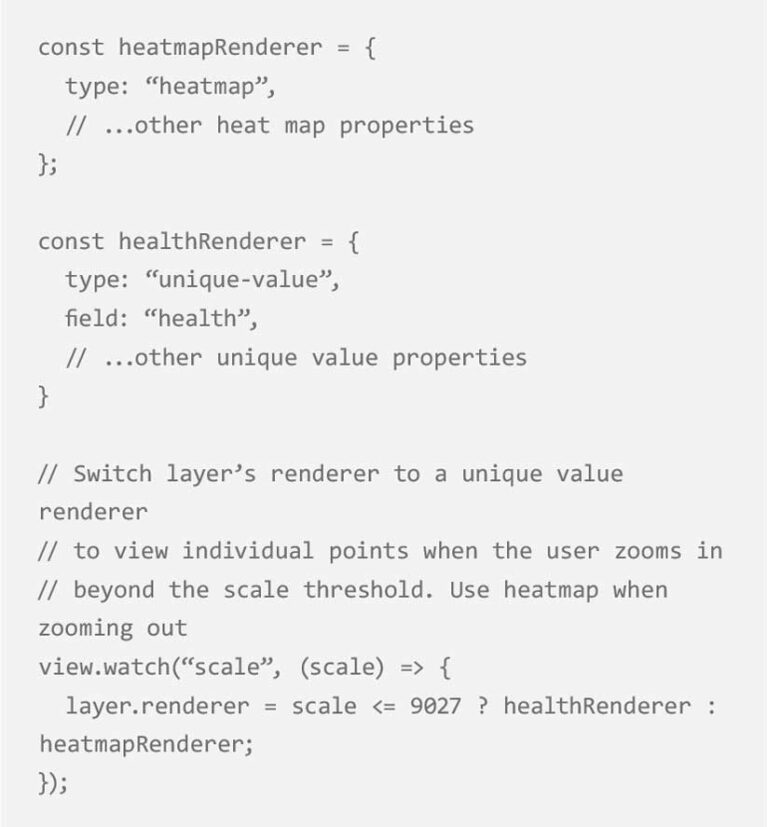
When zoomed in, the app in Figure 4 changes the renderer and instead of showing a heat map of streets, it shows individual tree locations. View the code.
Conclusion
Because HeatmapRenderer is so sensitive to scale, always ask the following questions:
- At which scale range should the heat map render?
- How should the heat map behave on zoom? Should it be locked to a reference scale?
- What should be the behavior as the map is zoomed to large scales? Should navigation be constrained? Should layer visibility toggle off?
- Should individual points be rendered?
The new reference scale gives you one more tool that allows you to improve how a heat map appears at various scales. I recommend applying all the techniques described in this article.
About the author