Move from reactive to proactive when managing ArcGIS Enterprise with a tool that provides insight through reporting, visualization, and alerts.
ArcGIS Enterprise is the foundational software system for GIS, powering mapping and visualization, analytics, and data management. It enables organizations to deploy an enterprise GIS in their own infrastructure on physical machines, virtual machines, or cloud environments.
Administrating and maintaining an enterprise GIS can sometimes be challenging, especially if an organization lacks IT expertise or as enterprise GIS capabilities scale and grow over time.
ArcGIS Monitor, a tool for holistic monitoring of ArcGIS Enterprise and its underlying infrastructure, collects data and information on an enterprise GIS deployment and provides managers and administrators with effective alerting and reporting.
Distinct from other third-party system monitoring solutions, Monitor was designed specifically for ArcGIS. It was developed based on the experiences of Esri Professional Services staff members who help organizations deploy and manage enterprise GIS implementations. Before it became an official Esri product, Monitor was used for several years in successful Esri consulting services projects. This article lists the top five reasons you should implement ArcGIS Monitor in your organization.
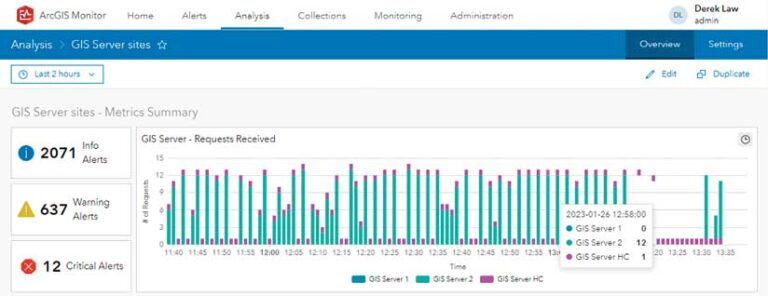
1. Optimize Enterprise GIS and Monitor Its Health
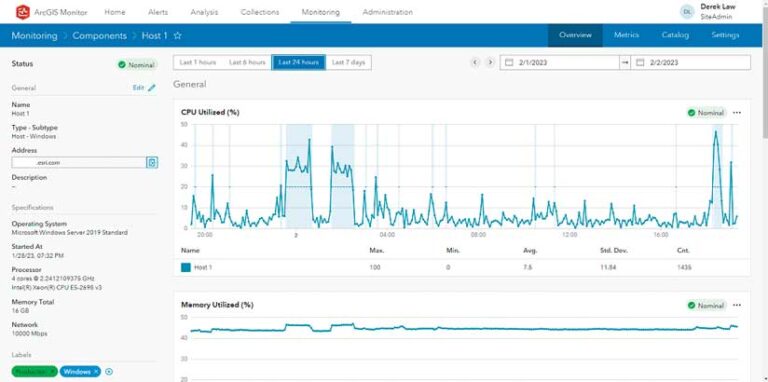
Enterprise GIS components—such as GIS servers, enterprise portals, databases, and host machines—can be registered with Monitor. Once registered, Monitor collects data metrics about different attributes for each component.
Over several weeks or a month, system activity trends and patterns can emerge that can guide managers and administrators with rightsizing the system. This information ensures enough system resources, such as computer processing units (CPU) and memory, are allocated to each component of the enterprise GIS and its infrastructure so that it will run efficiently. By collecting data metrics about various enterprise GIS components, Monitor provides a holistic view of the entire system and its framework.
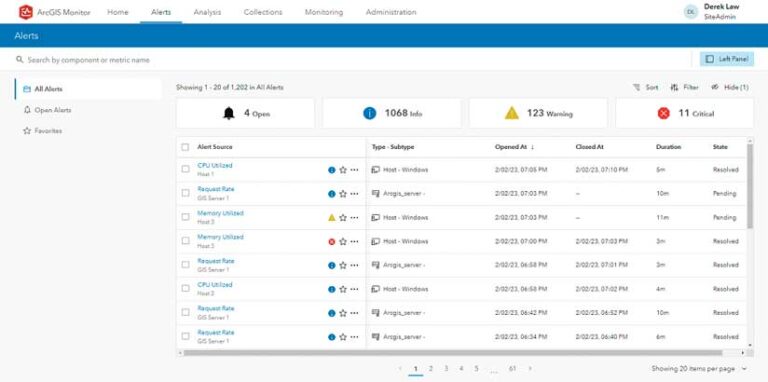
Monitor also provides the ability to configure alerts and notifications on enterprise GIS components to check for system health. For example, an alert could be configured on a GIS server when its instance saturation percent is high, indicating that more instances (i.e., system resources) are needed to handle the incoming service requests. It could be further refined to trigger only when the 90 percent threshold is reached multiple times in the same week.
When triggered, an email or text message can be sent to a manager or administrator when components reach or exceed defined threshold values for system health so they can be proactively managed. Alerts also assist with resolution efforts—in this example, it would mean adding more instances to the GIS server.
System health threshold values vary for different components and depend on the organization’s enterprise GIS business and IT requirements. Other examples of monitoring system health include when a web service has a high response time (i.e., the system is slow), when a host machine has frequent high CPU usage, or when a component does not return data metrics when queried because it is unavailable or offline. Monitor supports multiple alerts and notifications for different enterprise GIS components and their attributes. Alerts and notifications can be configured to meet the specific size and needs of an organization.
2. Troubleshoot Performance and System Issues
One of the challenges with IT systems is downtime. When a system outage occurs, it affects productivity and—potentially—revenue. According to Cost of Data Center, a report published by the Ponemon Institute in January 2016, the average cost of downtime to an organization is $9,000 per minute. It is therefore important to resolve and minimize system issues as much as possible.
An enterprise GIS deployment varies depending on an organization’s size, business needs, and IT requirements. Some organizations might have a single GIS server while others may have a multi-machine GIS server deployment across multiple locations. A GIS server could also utilize multiple data sources (i.e., databases and geodatabases) powering its web services.
When performance and system issues occur, it can be challenging to determine and isolate the causes, especially for larger deployments. Monitor helps managers and administrators troubleshoot performance and system issues within a single application. It can be used to investigate common performance issues such as system overload due to high traffic volume and network bottlenecks and to check the availability of resources. While Monitor does not automatically resolve these problems, it provides diagnostic tools that help you track down the possible sources of the issue.
For example, a web editing application might have a performance issue due to slow response time, which can cause frustration for end users when the app is not working properly because of the delay. Monitor can help determine where the performance issue is occurring. Is it at the application tier, the feature service tier, or the database tier? Managers and administrators can examine the data metrics of the components that support the web editing application and check for indicators in the components’ activity history for possible reasons for the slow response time. By identifying potential performance and system issues early—before they become critical—Monitor can prevent or minimize system downtime.
3. Generate and Collect Quantitative Data Metrics and History
Monitor collects data metrics from registered enterprise GIS components. It stores this information in an internal database that provides enterprise GIS managers and administrators with an archive of enterprise GIS activity.
This archive is beneficial because it provides a history of system activity, usage, and performance. This data can be examined to address questions related to trends and patterns of use such as:
- Which enterprise GIS components have the most activity?
- Which web services are the most active?
- Are web services more active during specific time periods?
- Are some web services mostly inactive? (Perhaps they should be changed or retired.)
- Which Enterprise portal items are the most active?
This data can be used for justifying additional system and IT resources and anticipating high traffic events such as emergency weather response or government elections. It also helps planning for enterprise GIS growth and predicting system resource needs when new components and GIS capabilities are added.
In addition to preconfigured data metric charts for enterprise GIS components, Monitor offers an option to configure custom data visualizations. This allows managers and administrators to define the data metrics they are interested in and how they are visualized.
Data metrics, collected and used within Monitor, can also be accessed outside of Monitor as feature services. These feature services can be registered with Enterprise portal and accessed by ArcGIS client apps. This means that collected data metrics can be viewed in apps such as ArcGIS Dashboards and ArcGIS Experience Builder so they can be shared with management and other enterprise GIS stakeholders.
4. Improves Communication between GIS, IT, and Stakeholders
In many organizations, typically the GIS department manages enterprise GIS, while the IT department manages the rest of the systems and services. Monitor is a great tool that enables GIS staff members who might not have IT expertise to better communicate with their organization’s IT personnel.
Because it collects data on common system properties of enterprise GIS components and provides quantified data metrics (as discussed previously), Monitor uses terms and concepts that are familiar to the IT staff. This authoritative information about performance, health, and usage of enterprise GIS provides operational awareness of enterprise GIS to IT and management in a language that they can easily understand.
Since Monitor collects and records data metrics over time, it can be particularly helpful in determining if appropriate system resources have been allocated to support enterprise GIS needs. If they have not, GIS staff will have the empirical evidence needed to validate system resource requests to IT, management, and other enterprise GIS stakeholders.
No issues reported by end-users is a good thing.
5. Promote Enterprise GIS End User Satisfaction
A key responsibility of enterprise GIS managers and administrators is to ensure that the system is working efficiently and meets the needs of the organization. The quote above succinctly summarizes this objective. This responsibility applies to an enterprise GIS of any size in any industry. When enterprise GIS efficiently addresses demands, end users are satisfied. By leveraging Monitor to address issues before they become critical, managers and administrators can proactively manage the system to meet their goals and keep end users happy.
Conclusion
Monitor complements and strengthens your enterprise GIS deployment by providing a holistic view of the entire system and its infrastructure.
About the author