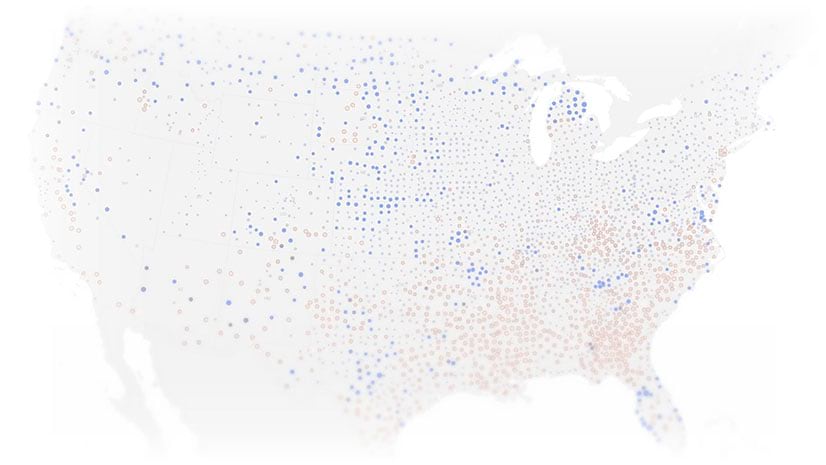
Although the coronavirus disease 2019 (COVID-19) pandemic, by definition, was a global event, like all disasters, it was experienced locally by millions of individuals who lost their loved ones, their incomes, and their sense of normalcy.
As the COVID-19 outbreak grew to an epidemic and fears of its metamorphosing into a pandemic began to be considered seriously, Johns Hopkins University (JHU) launched its COVID-19 dashboard. A team led by Lauren Gardner, an epidemiologist and codirector of the Center for Systems Science and Engineering at JHU, created the dashboard using Esri technology. It immediately went viral, with the number of visitors skyrocketing as it became the global reference for the pandemic, while Esri continued providing support to JHU.
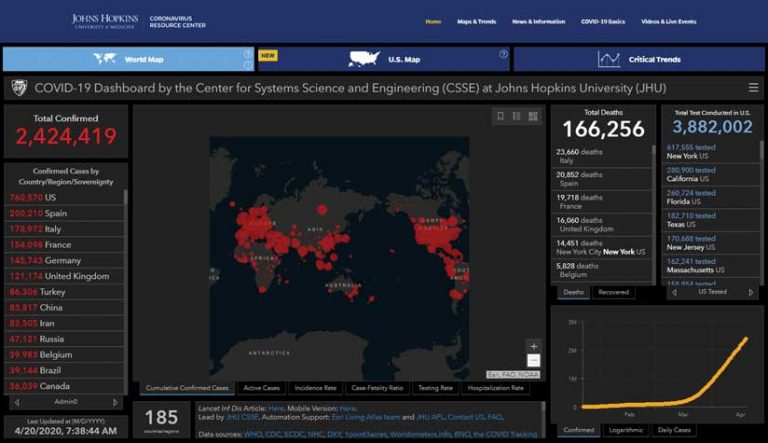
“When disease can travel so quickly, information has to move even faster. The intense response generated by the Johns Hopkins dashboard shows how eager people around the world are to track health threats,” explained Dr. Este Geraghty. She is the chief medical officer and health solutions director at Esri. “The dashboard presents targeted, up-to-date information needed to understand the progress of a disease and makes it available in a public, easy-to-digest format.”
Applying Geographic Technology
Organizations have been using mapping for hundreds of years—and GIS in recent decades—to understand the spread and impacts of epidemics. In this century, GIS has played important roles in tracking and helping to contain two other human coronaviruses, SARS-CoV and MERS-CoV. During the Ebola outbreak in 2013, government officials used GIS to site emergency treatment centers, manage bed capacity, and coordinate response efforts. However, GIS use for COVID-19 has been the most comprehensive and effective one to date.
The organizations that applied the geographic technology of GIS to COVID-19 ranged from local to international. The widespread use of GIS for COVID-19 response has demonstrated the power of geospatial thinking and the scalability, speed, and insight provided by GIS. More than simply mapping phenomena, GIS uses geography to furnish context for events in a common reference system. Applying spatial analysis tools, GIS brings out the relationships, patterns, and associations that are often hidden by the complexity of data.
The pandemic has also highlighted the importance of a geospatial infrastructure for effective and informed action in disasters. Johns Hopkins University’s dashboard could deliver the information on COVID-19 that everyone urgently sought because it tapped into the enterprise system for pandemic response provided by the ArcGIS platform and delivered by the Esri Geospatial Cloud. Its speed and scalability have been demonstrated by thousands of organizations around the world that stood up ArcGIS Dashboards and ArcGIS Hubs, and implemented ArcGIS Solutions for responding to the pandemic and ensuring business continuity.
A Common Mission
To help address the pandemic, Esri made all its software, virtual training, and on-call technical assistance freely available not only to all its users but also to any organization anywhere in the world that was battling the pandemic. “Addressing the pandemic can be seen as part of Esri’s common mission of bringing geographic science, GIS technology, and geographic thinking to every organization on the planet—all governments, private companies, academic institutions, and NGOs,” said Jack Dangermond, Esri founder and president, in an announcement in March 2020.
With Esri software, training, and support services came access to the vast trove of authoritative and accurate foundational data from the ArcGIS Living Atlas of the World and business, lifestyle, and other datasets. Combined with the ability of the ArcGIS platform to rapidly ingest, integrate, analyze, and visualize data from sensor, telemetry, and other real-time data sources, organizations could accurately capture the constantly changing picture of the unfolding crisis.
Thousands of organizations across the United States and in numerous countries around the world that were not already using ArcGIS adopted GIS. Esri, through its Professional Services team, has been supporting the outstanding work of local, state, federal, and international organizations as they stand up GIS systems for reacting to the pandemic. To help these organizations work as effectively as possible, Esri has been creating and releasing training materials and white papers that are specific to using GIS for COVID-19.
Esri’s Disaster Response Program (DRP) has also helped thousands of organizations. For more than 25 years, it has provided data, software, configurable applications, and technical support to help communities during large-scale emergencies and natural disasters. Read the accompanying article, “Esri’s DRP Lends Support to Worldwide Efforts Against Pandemic,” to learn more about the DRP.
Esri international distributors in the Middle East, Europe, Asia, and South and Central America have also supported efforts combating COVID-19 in the countries in which they work by providing technical support and training materials to help set up ArcGIS Hub sites and use ArcGIS StoryMaps.
Esri partners around the world are also playing a critical role in helping with this global disaster by contributing discounted or no-cost COVID-19 focused offerings and location-enabled software solutions, content, and implementation services.
Two new initiatives have accelerated the use of GIS to understand and halt the spread of COVID-19. Esri partnered with the World Health Organization (WHO) to provide Esri software and solutions to all international health ministries and their global affiliates, particularly those in developing countries.
A partnership with the Federal Emergency Management Agency (FEMA) has made the Esri platform available to all FEMA partners, which includes nearly all governments and nongovernmental organizations (NGOs) responding to the crisis in the United States.
To ramp up its capacity to support many more users of the Esri Geospatial Cloud, Esri has been optimizing the scalability of ArcGIS Online to handle the creation of billions of map views per day and support the load generated from ArcGIS Dashboards.
In collaboration with its partners and user community, Esri launched the COVID-19 GIS Hub, an ArcGIS Hub site that provides a collection of datasets, applications, and other useful content for planning and response. Because Hub is a software-as-a-service (SaaS) solution that is hosted in the Esri Geospatial Cloud, it doesn’t require hardware or software and greatly reduces deployment and maintenance time. Localized versions of ArcGIS Hub are available in 38 languages.
Two ArcGIS Solutions were created specifically to help organizations with COVID-19 problems. Coronavirus Response is an ArcGIS Solution that supplies a collection of apps and data designed to help users understand and manage the impacts of the pandemic on a community. The Coronavirus Business Continuity Solution is a collection of apps and data for coordinating and reporting information about employees and facilities to get organizations, whether private or public, back to normal.
As the pandemic has unfolded, Esri has developed tools that incorporate mathematical models used by epidemiologists such as the COVID-19 Hospital Impact Model for Epidemics (CHIME) model. At the outset of the pandemic, Esri developed an implementation of CHIME for use in ArcGIS Pro that leverages Susceptible, Infected, Recovered (SIR) modeling and can be used to forecast the curve of the epidemic in terms of its impact on hospitals and visualize those impacts spatially.
Existing GIS Implementations Speed Efforts
One of the hallmarks of the COVID-19 pandemic has been the need for speed. Its rapid spread requires not the perfect plan but an immediate one. That means actionable information, not a flood of data. GIS has been critical to the ability of state and local governments to react to the pandemic. Those that had robust, existing GIS implementations have been well positioned to pull the best data together, analyze it, and rapidly respond.
The State of Maryland rolled out its ArcGIS Hub site, Coronavirus Disease 2019 (COVID-19) Outbreak site, in just four hours on March 14, 2020, and didn’t incur any additional cost because Maryland already used ArcGIS as a statewide enterprise system and its GIS staff members already possessed the necessary skills.
“We were able to step up and use the technology when it really mattered,” said Julia Fischer, the State of Maryland’s geographic information officer. The good working relationship between the state’s information technology department, emergency management agency, and health department helped GIS staff deliver the right data, right away.

“GIS in disaster response is 100 percent necessary.”
The State of Montana benefited from the existing statewide datasets it has maintained and made available for years. Having the right tools, processes, and foundational data layers are critical to optimizing GIS use in an emergency. Erin Fashoway, the state GIS coordinator said, “It’s a no-brainer to use GIS for emergencies. Montana has lots of them.” She sees the key to using GIS for emergencies is not to start using GIS in the middle of an emergency.
By using Survey123 for ArcGIS, Montana gathered data on local conditions throughout the state and in tribal areas that was immediately shared at the Montana Emergency Coordination Center. The information created using the state’s GIS was used by the governor’s task force to drive its decisions.
“There is no doubt in my mind that GIS should be used as a tool to plan for, mitigate, and recover from disasters,” said Fashoway. She believes that “GIS in disaster response is 100 percent necessary.”
Local government, which is the face of government for most people, had to cope with social and economic impacts that originated far away but had close-to-home impacts.
Statewide shelter-in-place orders caused millions of people to lose their jobs and incomes. At the same time, school closures interrupted the free breakfast and lunch programs many families rely on. Food supply chains were disrupted as restaurants closed or adopted limited services and hours at the same time the demand for groceries increased substantially. This dislocation for suppliers and increased demand by grocery stores was exacerbated because they have come to rely on constant shipments and rapid restocking of goods. Widespread panic buying and hoarding compounded these logistics problems, leading to empty store shelves.
The result was food insecurity that was felt early and pervasively. While it was a widespread problem, it required local action to solve. ArcGIS Hub sites and apps supplied residents with current information on local conditions and helped local governments deal with this problem.
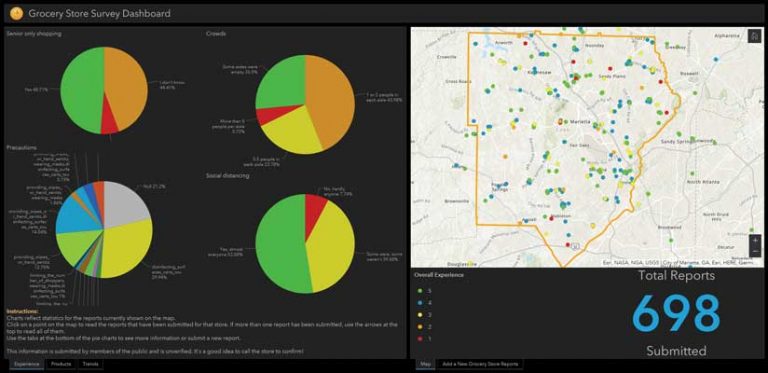
For example, Cobb County, Georgia, a longtime, innovative user of GIS, added a web app to its ArcGIS Hub site dedicated to COVID-19 resources. It supplied up-to-date information on grocery inventories of essential items, special hours for at risk people, how crowded stores were, and how well social distancing practices were being followed for area stores. Current data was fed into the app by crowdsourcing data from residents who used Survey123 for ArcGIS to fill out surveys on stores. A story map on the site contained information on area food pantries and government assistance.
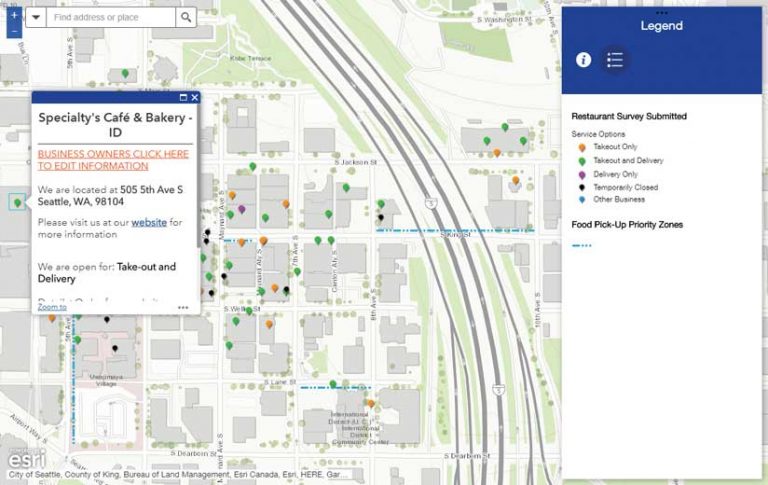
Restaurants—a source of food and local employment—have been supported by local governments using GIS. The IT department for the City of Seattle, Washington, created the GIS-based #SupportSeattleSmallBiz app to support local restaurants. Business owners used a simple survey form to populate a web app with information on their status. A public-facing app let residents find restaurants near them and provided phone numbers, website links, and directions. The app made information on more than a thousand businesses quickly available, helping those businesses stay open, keep staff employed, and retain customers.
Recovery Needs a Geographic Context
While the COVID-19 pandemic was initially perceived as a public health crisis, its effects are rippling through society and will be long-lived. COVID-19 is precipitating an economic emergency that has effects both pervasive and growing. This secondary emergency is enmeshed with other social challenges, notably widespread homelessness.
The interrelated nature of these two issues makes GIS the best framework for holistically arriving at policies. ArcGIS tools and data can determine impacts on businesses and the economic well-being of individuals. With a better idea of these conditions, different levels of government can work together and coordinate efforts.
Regional economic recovery is going to be a collaborative process because the effects of COVID-19 don’t neatly stop at city or county boundaries. Placing data in a geographic context helps visualize relationships and perhaps new solutions. Collecting data will allow predictive modeling and shape recovery. This crisis is an opportunity for collaboration and building cooperation that could continue, limiting data hoarding and promoting reciprocal data sharing.
A Framework for Understanding and Responding
GIS professionals across the world have applied GIS in responding swiftly and decisively to the COVID-19 pandemic and demonstrated just how valuable geospatial thinking is. They showed that using a geographic framework for informing decisions is not just applying technology but helping lead organizations to a better way of dealing not only with emergencies but with day-to-day challenges.
Thousands of organizations that had not used GIS much or at all before the pandemic have successfully stood up systems in response to COVID-19 and realized concrete benefits. Geraghty sees the pandemic as an opportunity for organizations to appreciate how valuable a geospatial framework can be to them. She hopes that people will realize the value of looking at their data geospatially not only to be better prepared for the next public health emergency but to develop better methods for handling other problems.
“Taking a geospatial perspective is different. It’s a different way of thinking. It’s more than looking at a map. It’s making spatial decisions and doing spatial analysis which is different in its overall perspective from traditional analysis and statistics. Once you start to think this way, you easily see the value of it and how you can apply it to the challenges that we have at hand,” she said.

About the author