Humanitarian organizations are using ArcGIS to analyze conflicts, natural disasters, and deprivation to preemptively mitigate their effects on people in high-risk areas of the world such as the Republic of the Sudan.
Since its independence in 1956, Sudan has suffered from numerous armed conflicts, including two civil wars. In addition to combat deaths, the famine and disease that followed claimed many more lives. According to a 2022 report by the humanitarian information service ReliefWeb, the war-related deaths is estimated at nearly two million, and the number of internally displaced persons was estimated at more than four million.
“The lack of geospatial data in conflict-affected areas hinders the planning and implementation of humanitarian aid, such as forecast-based actions (FbA) in the Sudan,” said Cornelia Scholz, consultant at the Red Cross Red Crescent Climate Centre.
FbA is an innovative approach to providing humanitarian aid by using risk and threat analysis to anticipate need and facilitate the preparation of emergency service elements before a disaster strikes. This approach is faster and less expensive than traditional relief and reduces losses and suffering.
Because up-to-date maps of Sudan are often unavailable, it is difficult to identify populations in the country that are at high risk from armed conflicts, disasters, and threatening factors such as poor nutrition and contagious disease. This data would allow the implementation of FbA as well as support long-term climate adaptation efforts and emergency response.
“For several years, we have been working on various mapping projects with Missing Maps to improve the quality and availability of open mapping data in data scarce areas,” said Scholz.
Missing Maps, led by a collective of organizations, provides free mapping services for humanitarian organizations throughout the world. It was founded in 2014 by the American Red Cross, British Red Cross, Humanitarian OpenStreetMap Team, and Médecins Sans Frontières.
Analyzing Climate and Conflict Together
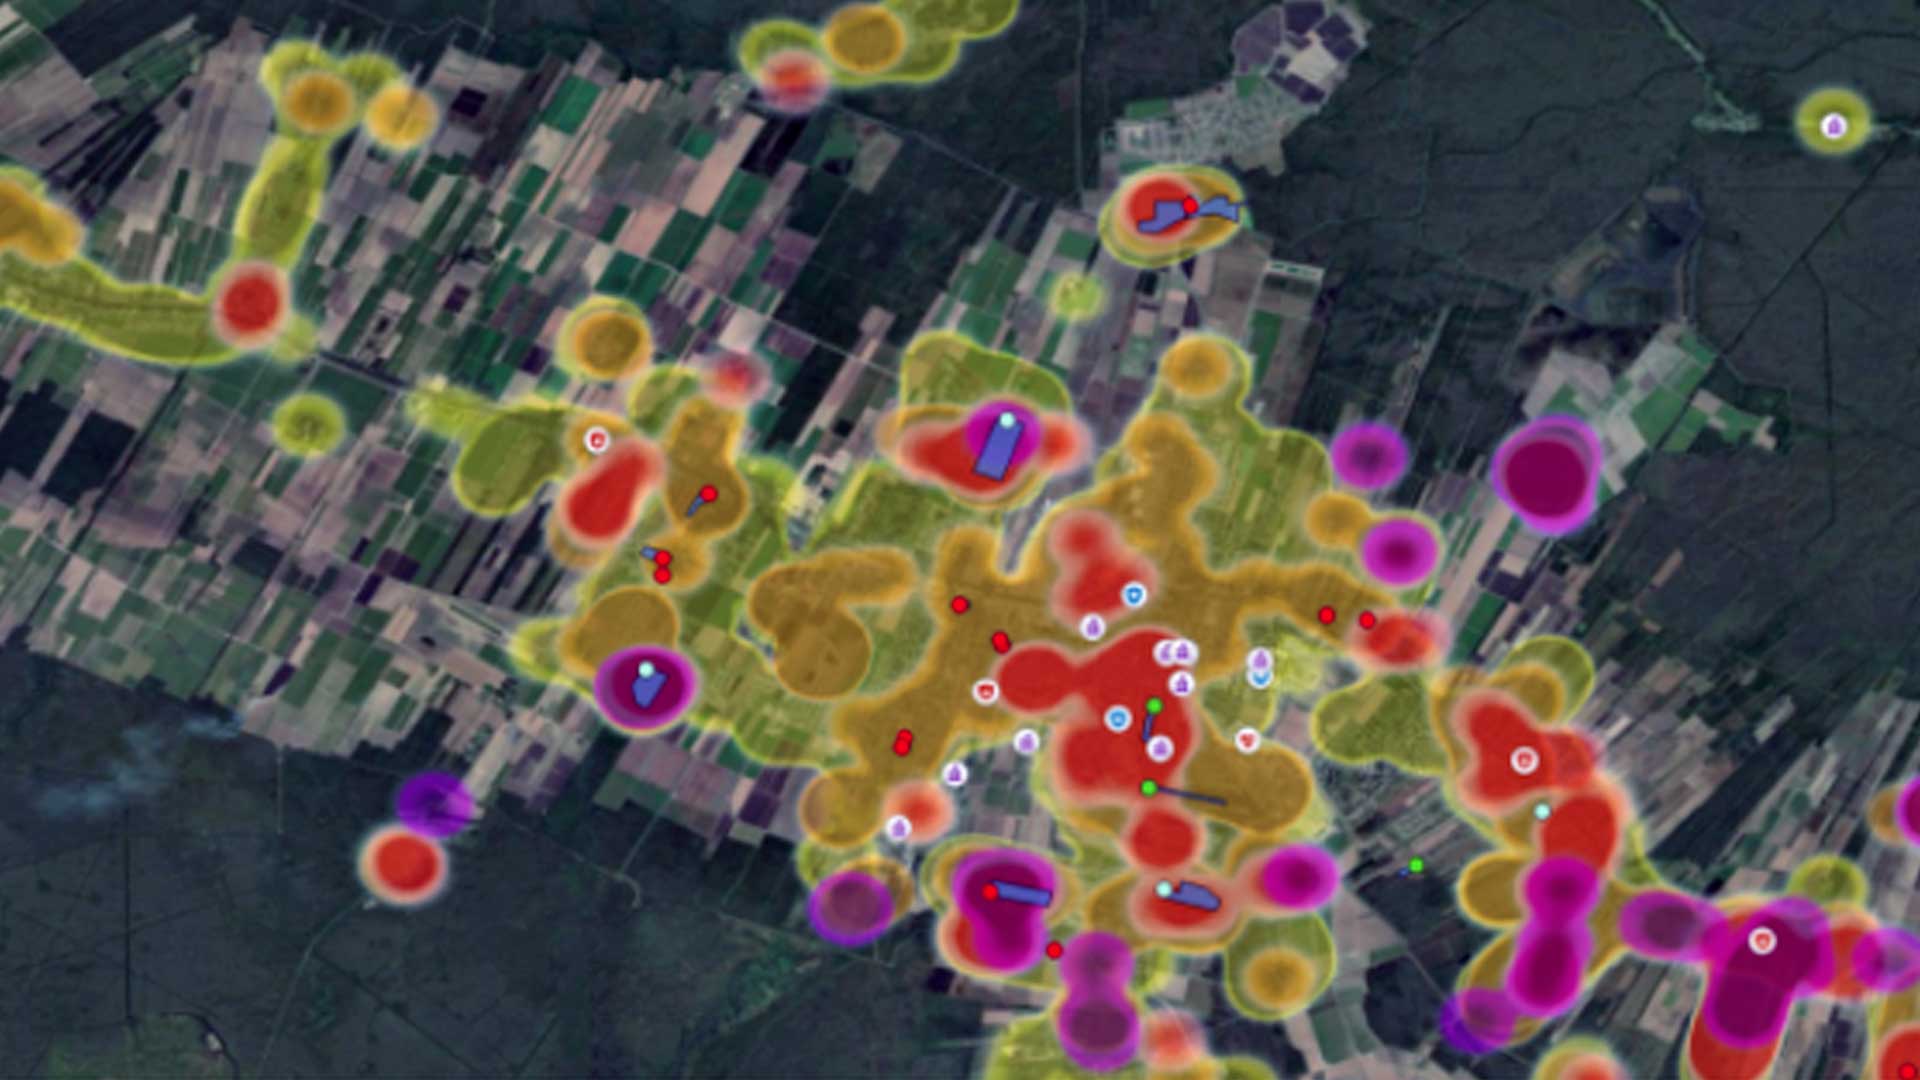
“Throughout the past year we have been working on developing a compound risk analysis of climate and conflict,” said Scholz. “Basically, the analysis examines the interconnection between the various impacts affecting the Sudanese population and their cascading and cumulative effects. With the development of up-to-date mapping data for hot spot mapping of yet undetermined and unmapped high-risk areas, we can enable the planning of early actions to help mitigate the severe consequences from those impacts.”
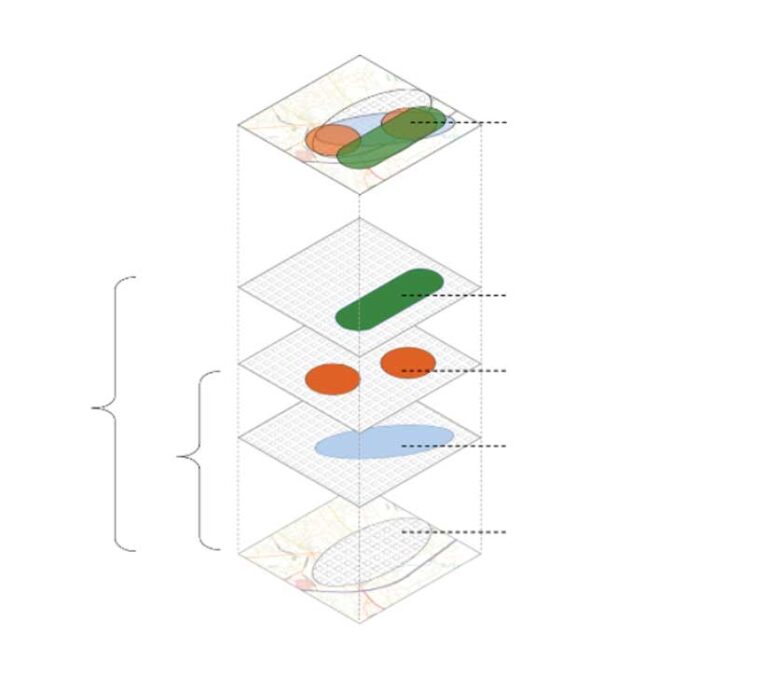
Risk factors, such as a history of conflict, exposure to natural hazards, and other vulnerabilities, are mapped on separate layers for analysis. The conflict layer includes data on reoccurring combat and hot spots that took place between 2000 and 2021 and highlights those areas that have suffered from the greatest impact from war. The natural hazard layer includes datasets on flood and drought. The layer for vulnerability includes datasets on food security, medical care, education, and the locations of internally displaced people and refugees. The satellite imagery used for the project was captured in late August of 2021 by the European Space Agency.
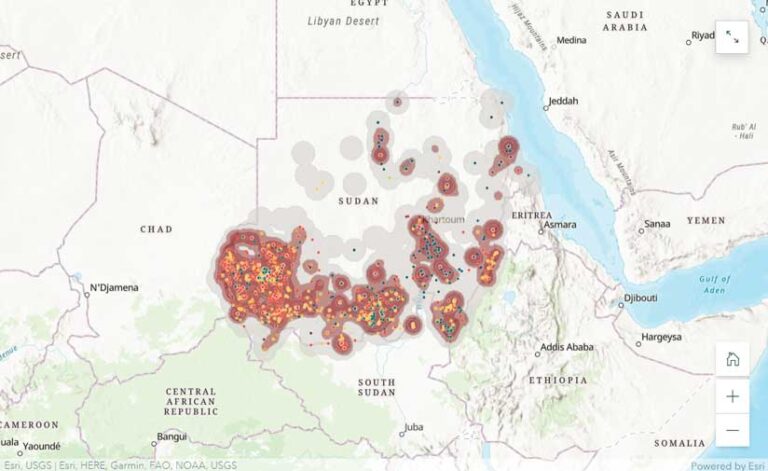
“The analysis to identify mapping data gaps of high-risk or hot spot areas was performed with ArcGIS.” said Scholz. Using open-source mapping with Esri’s OpenStreetMap feature layers, the datasets for flood exposure, drought exposure, food insecurity, the location of internally displaced people, and conflict hot spots were analyzed using weighted overlay. For each layer, weights were assigned by experts so that multihazard hot spot maps could be created.
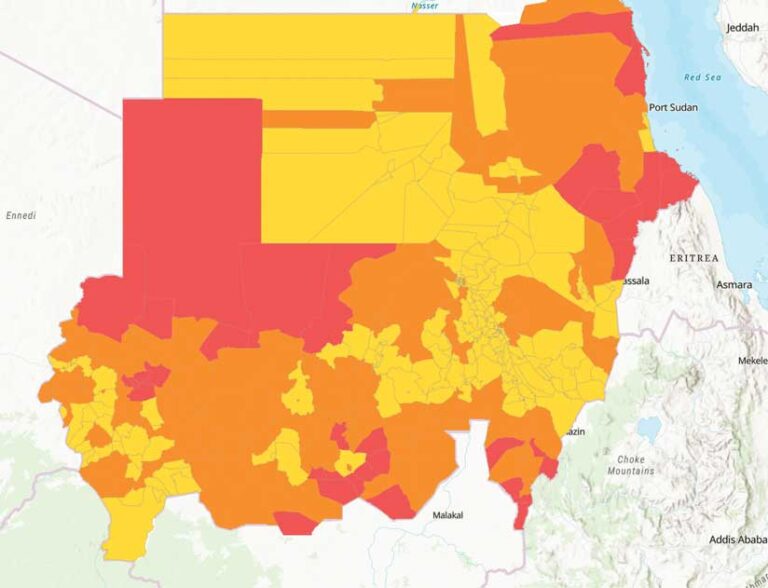
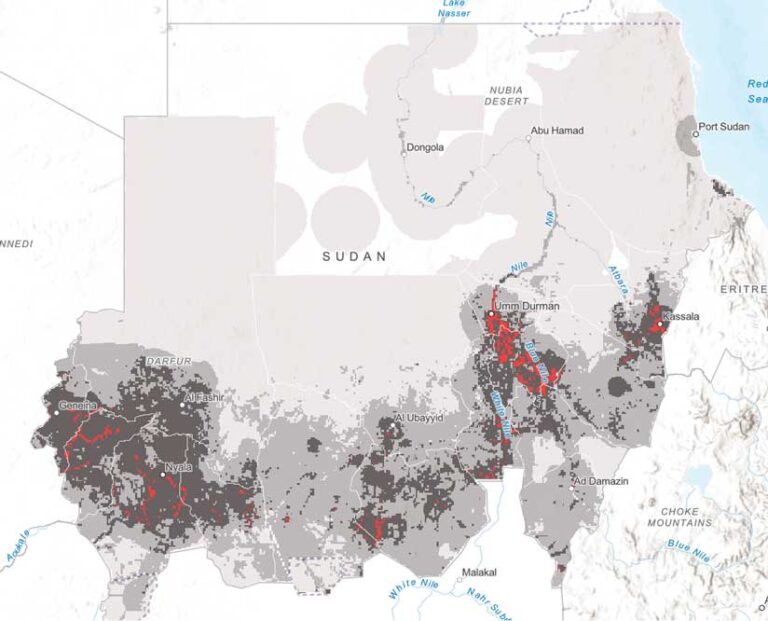
This allowed the identification of geographic areas with compounding hazards. A weighted overlay of the areas was conducted, which allowed the extraction of insights from quantitative, georeferenced indexes, with weights assigned according to expert opinion to create multihazard hot spot maps.
Areas determined to have poor quality mapping data that was incomplete, outdated, or inaccurate were then prioritized for mapping, based on the open-source, georeferenced data layers. An OpenStreetMap (OSM) mapping task was developed in the HOT Tasking Manager. [HOT Tasking Manager divides large mapping projects into smaller tasks so they can be completed more rapidly through the collective efforts of many people.] This work was supported by Médecins Sans Frontières and led by the Netherlands Missing Maps team, with the help of a group of volunteering professional mappers, who mapped and validated the data.
Expanding the Use of the Database and Its Methodology
Information from this project has been included in the Red Cross Red Crescent Anticipation Hub to fill in missing Sudanese geospatial data for subsequent relief efforts and other initiatives.
The Anticipation Hub is a platform that promotes action and advocacy for humanitarian relief efforts. It is hosted by the German Red Cross in cooperation with the International Federation of Red Cross and Red Crescent Societies and the Red Cross Red Crescent Climate Centre, with funding support from Germany’s Federal Foreign Office.
“The methodology we developed for this project provides a means of mapping uncharted territories, not only for emergency response but also anticipatory action and long-term disaster risk reduction and emergency planning,” concluded Scholz. “It provides complete, accurate, and reliable geospatial data for first responders and humanitarian and development actors, as well as the country’s decision-makers and residents.”
About the author