Maps We Love: The Volcanic Island of Iturup
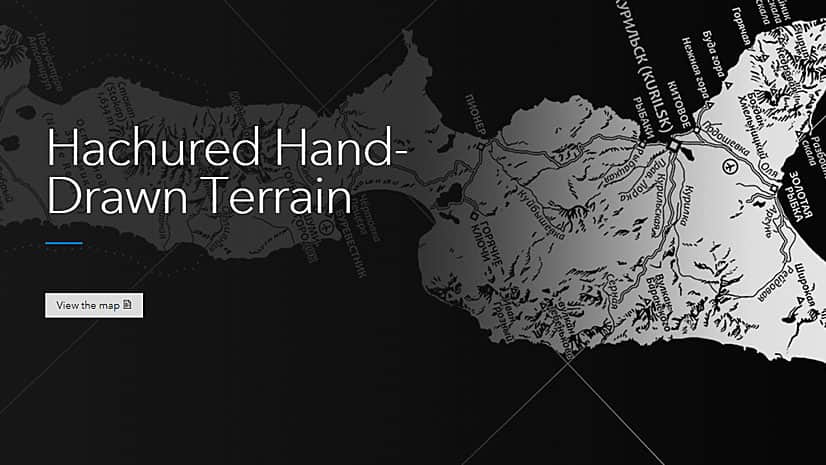
This black and white map of the island of Iturup, created with ArcGIS Pro, gives off a cool vibe with its hand-drawn, hachured mountains.
This black and white map of the island of Iturup, created with ArcGIS Pro, gives off a cool vibe with its hand-drawn, hachured mountains.
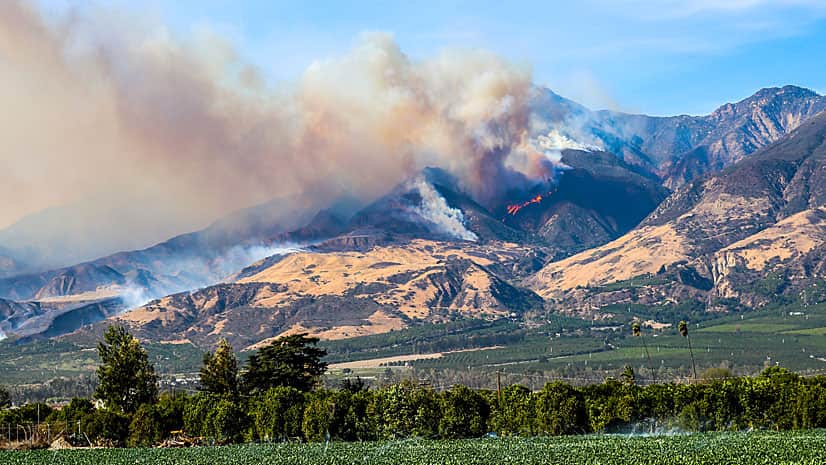
The Ventura County Fire Department in California used GIS to create maps of the Thomas Fire, providing valuable situational awareness.
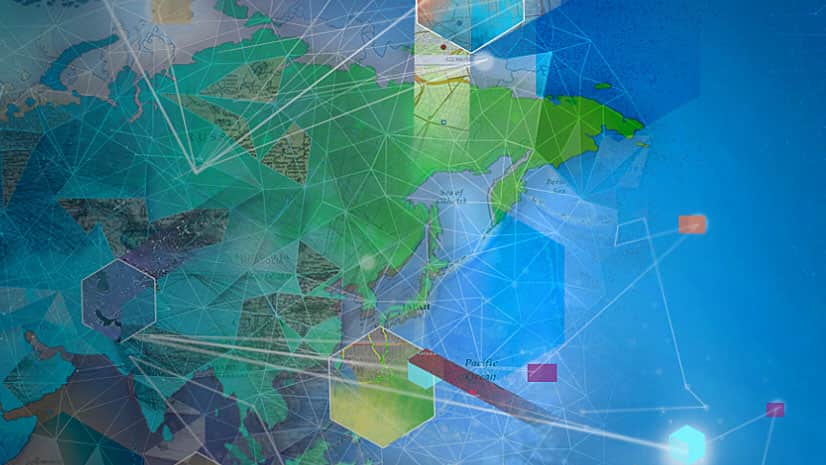
Learn how artificial intelligence (AI), machine learning, and location intelligence can be used together for predictive analysis.
Felicia Alingu from Cobb County in Georgia used Insights for ArcGIS to study data on what drives visits to senior centers,
Data Appliance 7.0 for ArcGIS plugs into an internal, secure network, delivering preloaded imagery, basemaps, and reference layers.
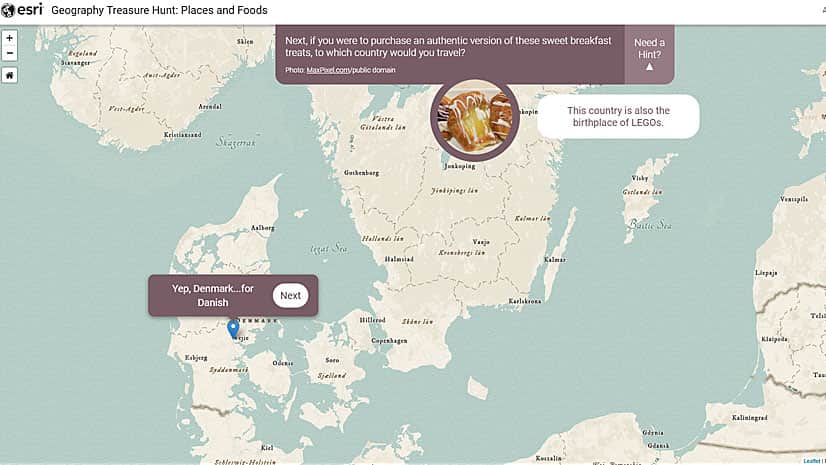
Go on the Geography Treasure Hunts and test your geographic knowledge about beaches, cuisine, mountains, cities, and world heritage sites.
Going forward, people in your organization can be assigned one of five user types: viewer, creator, editor, field worker, or GIS professional.
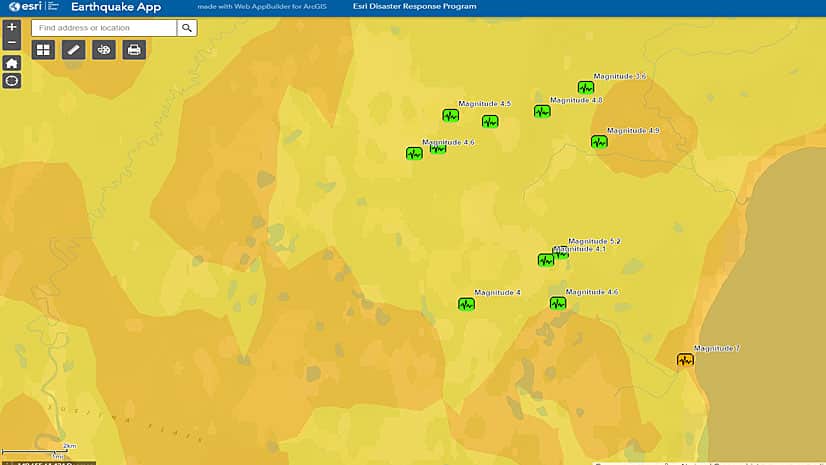
Visualize the recent earthquakes in Alaska with an app built with Web AppBuilder for ArcGIS.
Learn how to work with the Terrain layer, a versatile raster elevation layer that's available from the ArcGIS Living Atlas of the World.
Esri ArcGIS powers the maps on the Smithsonian WILD website, where you will find more than 200,000 images of animals...
In the new frontier of real-time GIS, Esri's ArcGIS GeoEvent Processor for Server ingests data streaming in from sources such as...
Your map seems perfect. Then you realize the names of features such as oceans, mountain ranges, and neighboring states are missing.