
November 17, 2020 |
Steve Snow | Mapping
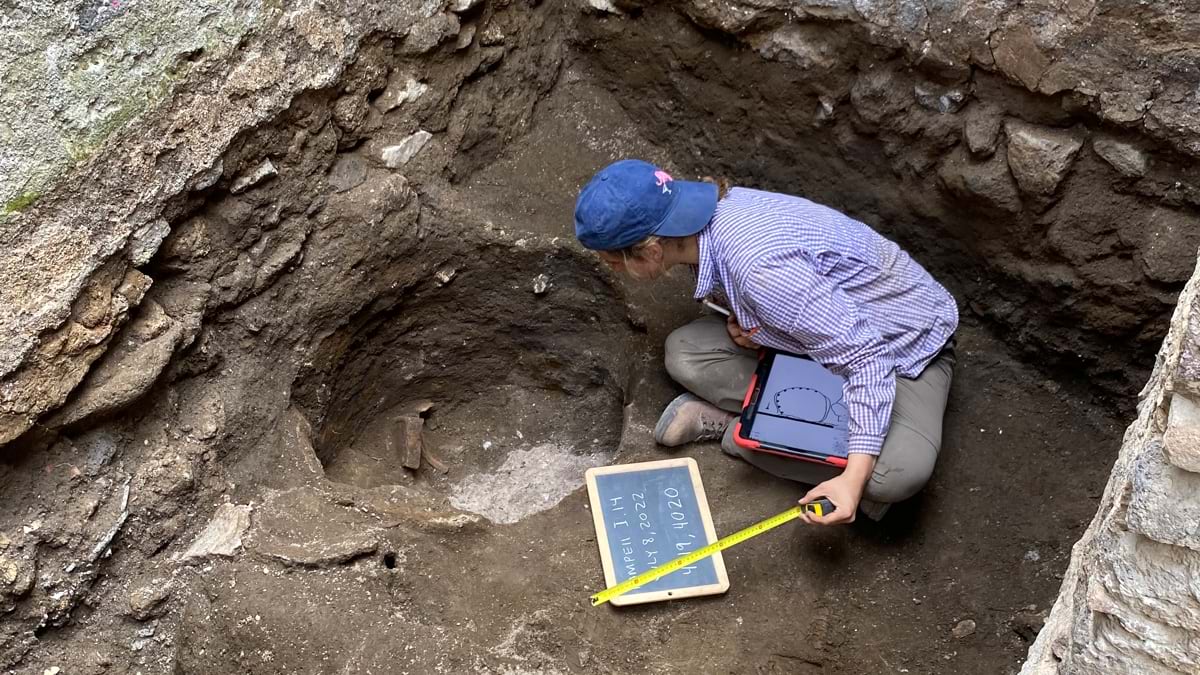
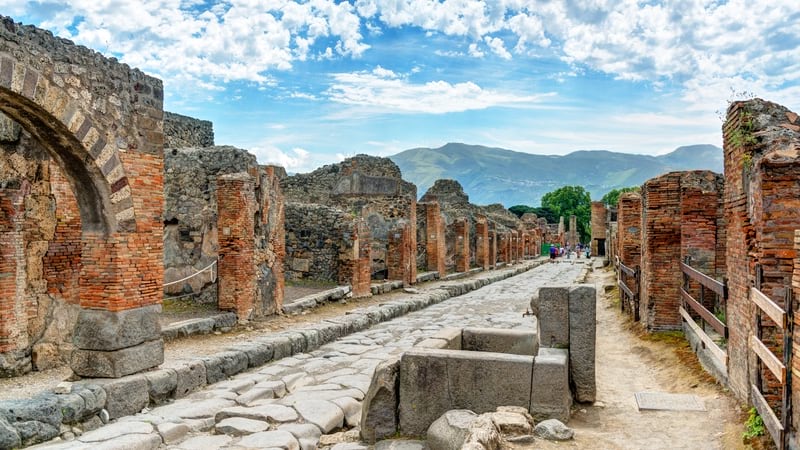
At the edge of Pompeii, along a city gate known as the Porta Nocera, professor Allison Emmerson of Tulane University directs a team of archaeologists. The famous Roman city, frozen in time when Mount Vesuvius erupted and covered it with ash, continues to reveal new insights to archaeologists nearly 275 years after the site was first discovered.
Within a building long believed to be a home around 2,000 years ago (circa 79 CE), the team unearthed a different story—one about economics, urban design, and social life among the elite and lower classes. Their findings reveal a way of life and level of sophistication not evident in many modern cities. To tell the story best, Emmerson and her team have created a location-aware digital twin of the excavation site, incorporating 2D maps, smart maps, and 3D models and sharing data as it is captured using a fully digital workflow using iPad Pro with Apple Pencil.
Comprehensive documentation is critical to this project and to archaeology at large. In the not-so-distant past, this was done through handwritten notes and drawings of structures and artifacts. Today’s technology has put unexpected capabilities into the hands of archaeologists. Using the latest geographic information system (GIS) technology, Emmerson’s team is digitizing everything they can at Porta Nocera, Region I Insula (city block) 14 (the Pompeii I.14 Project).
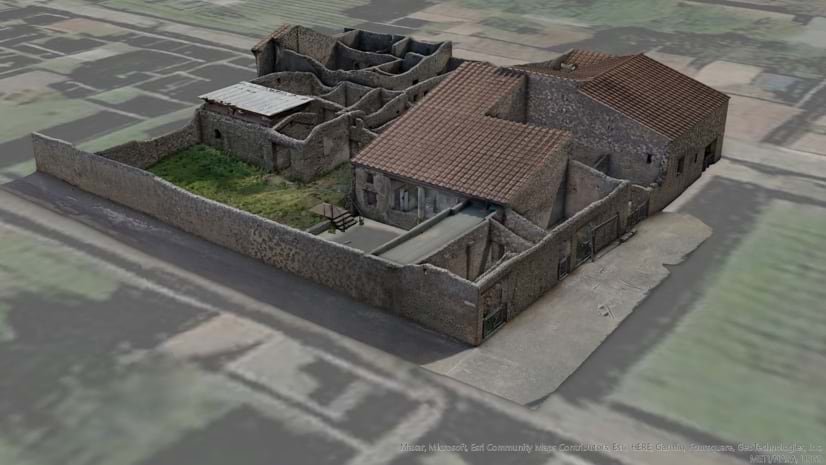
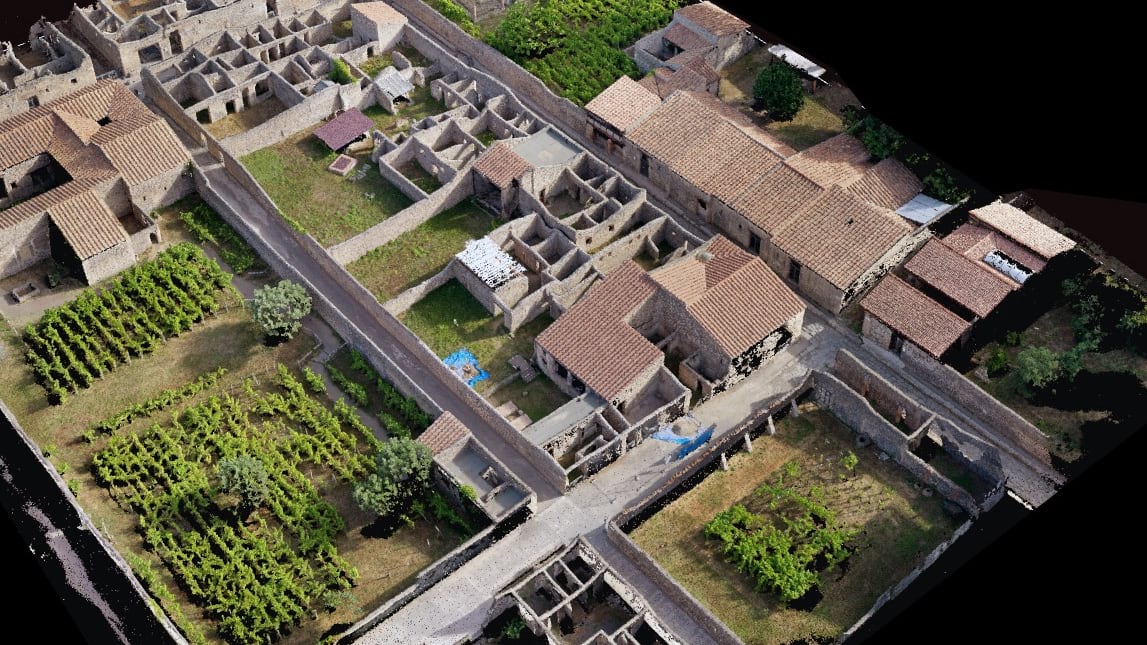
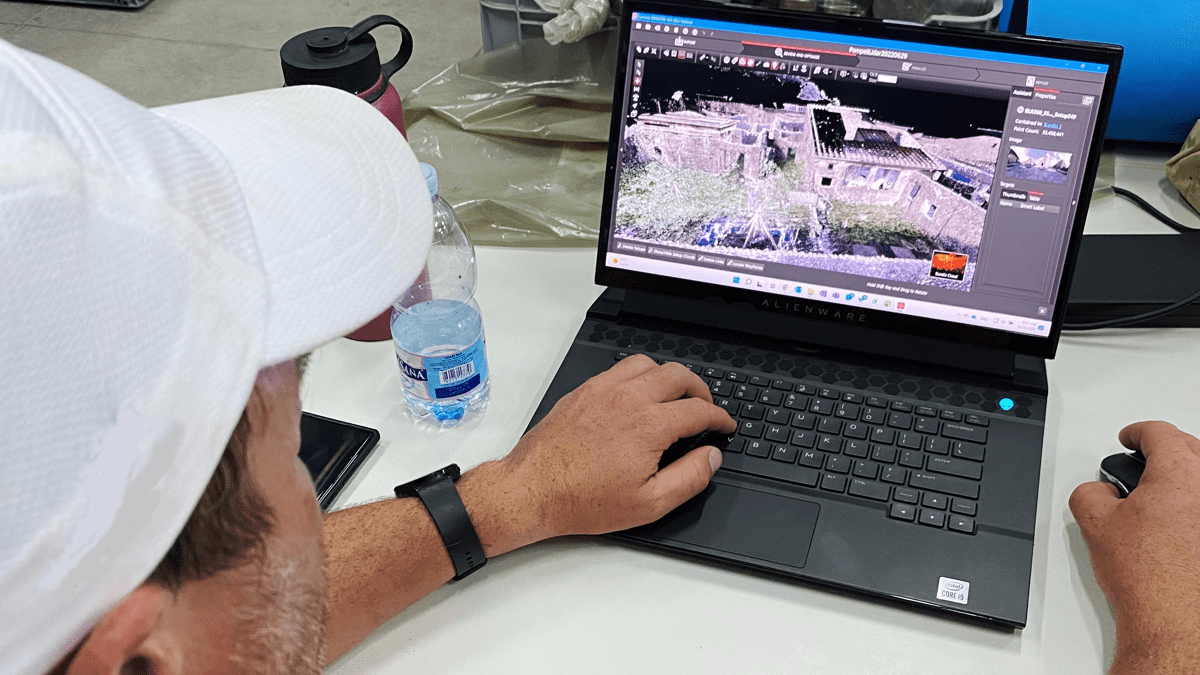
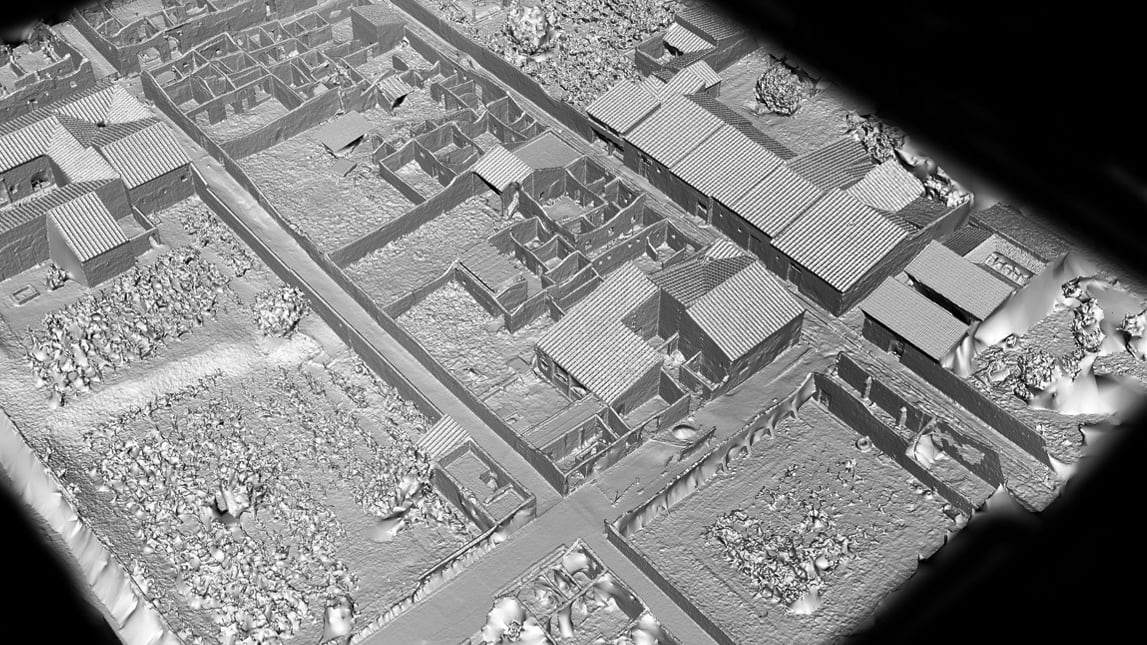
The I.14 team first use drone imagery, terrestrial photography, and a technique called structure-from-motion photogrammetry to create a basemap and a 3D base model of the site. And then, as they work, they use tablets loaded with GIS apps to layer data over that 3D basemodel, everything from soil characteristics to structure measurements. “The tech we’ve introduced makes our work so much better,” Emmerson said. “It allows us to contextualize what we’re finding in ways I just couldn’t imagine 10 years ago.”
View this drone flight to gain further context of the Pompeii I.14 site.
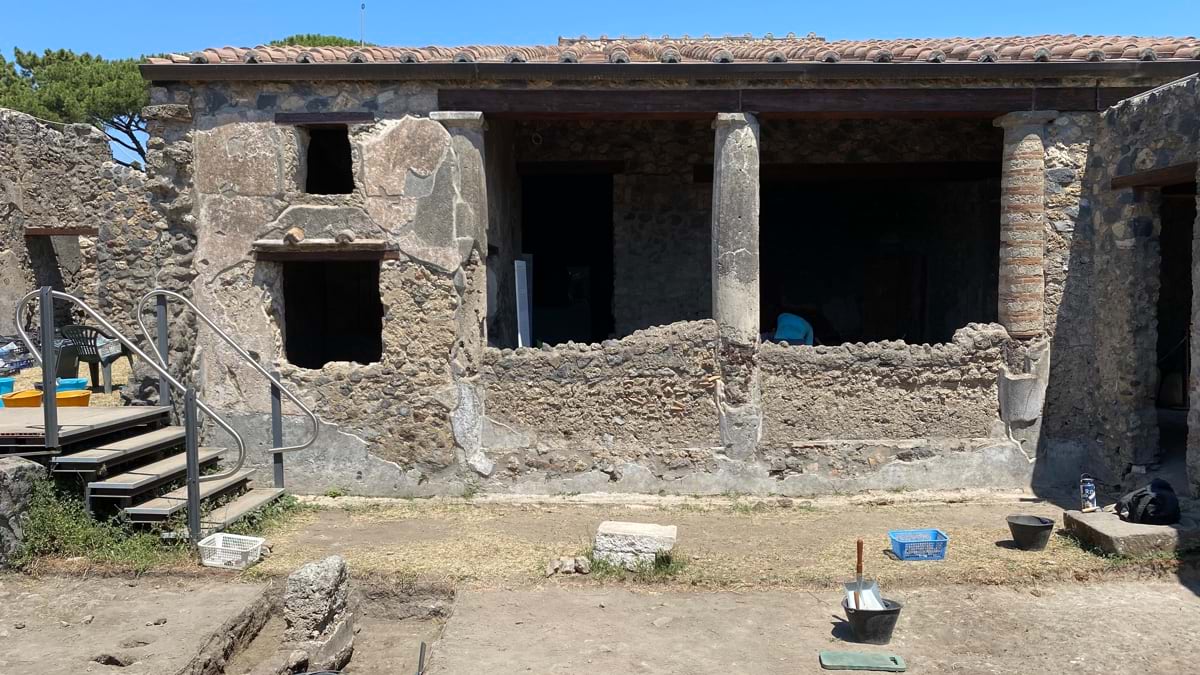
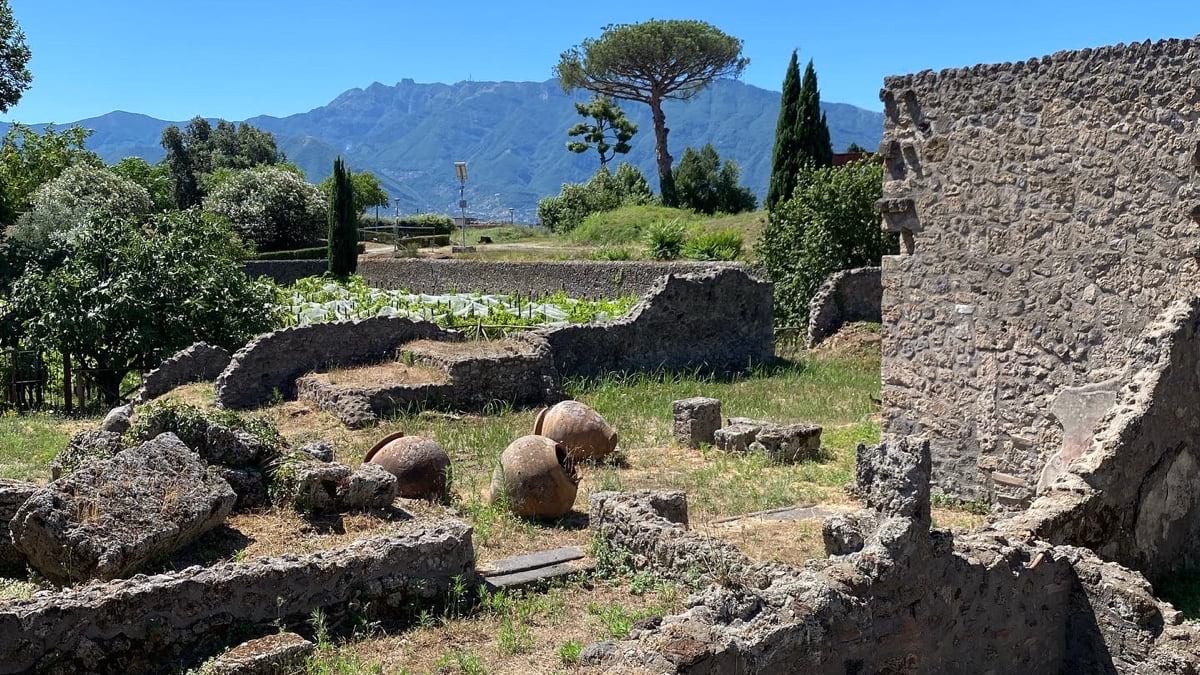
Emmerson was particularly interested in the specific structure within the block for a couple of reasons. First, it’s among few buildings that have had less interference from digging or tourism—it was not fully cleared of volcanic material until the 1990s and has hardly been explored since. Second, the building is very similar to others that once stood in a neighboring city but were lost to construction and poor documentation. Emmerson expects the findings from the Pompeii I.14 Project to answer questions regarding the economy, ports, and infrastructure in 79 CE.
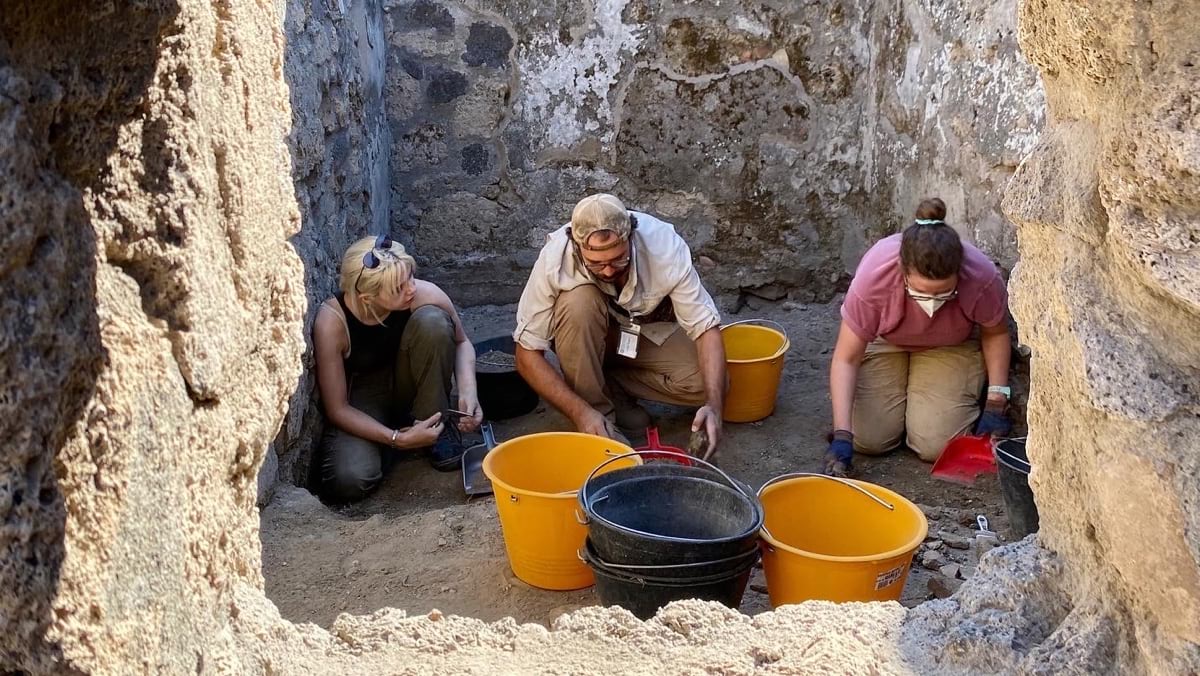
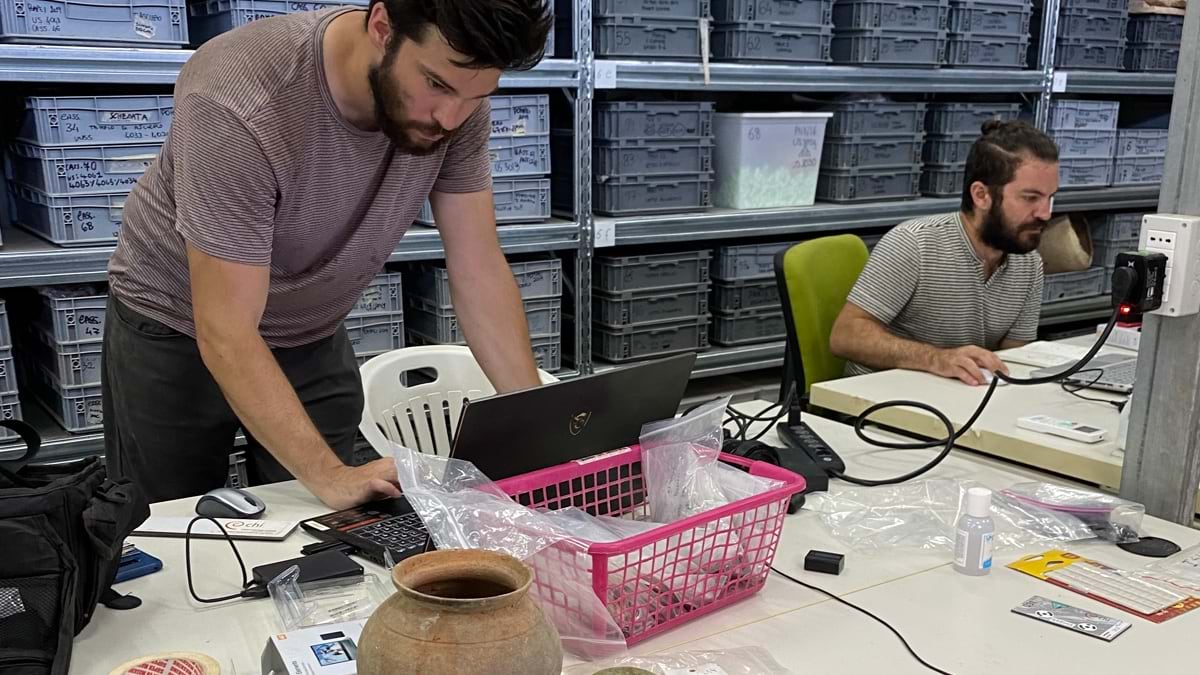
Leading the GIS data collection workflow is professor Alex Elvis Badillo, cohead of the project’s digital data initiatives team. Badillo said, “Archaeology is interesting in that when you’re excavating, you’re kind of killing your informant at the same time because you’re digging and destroying.”
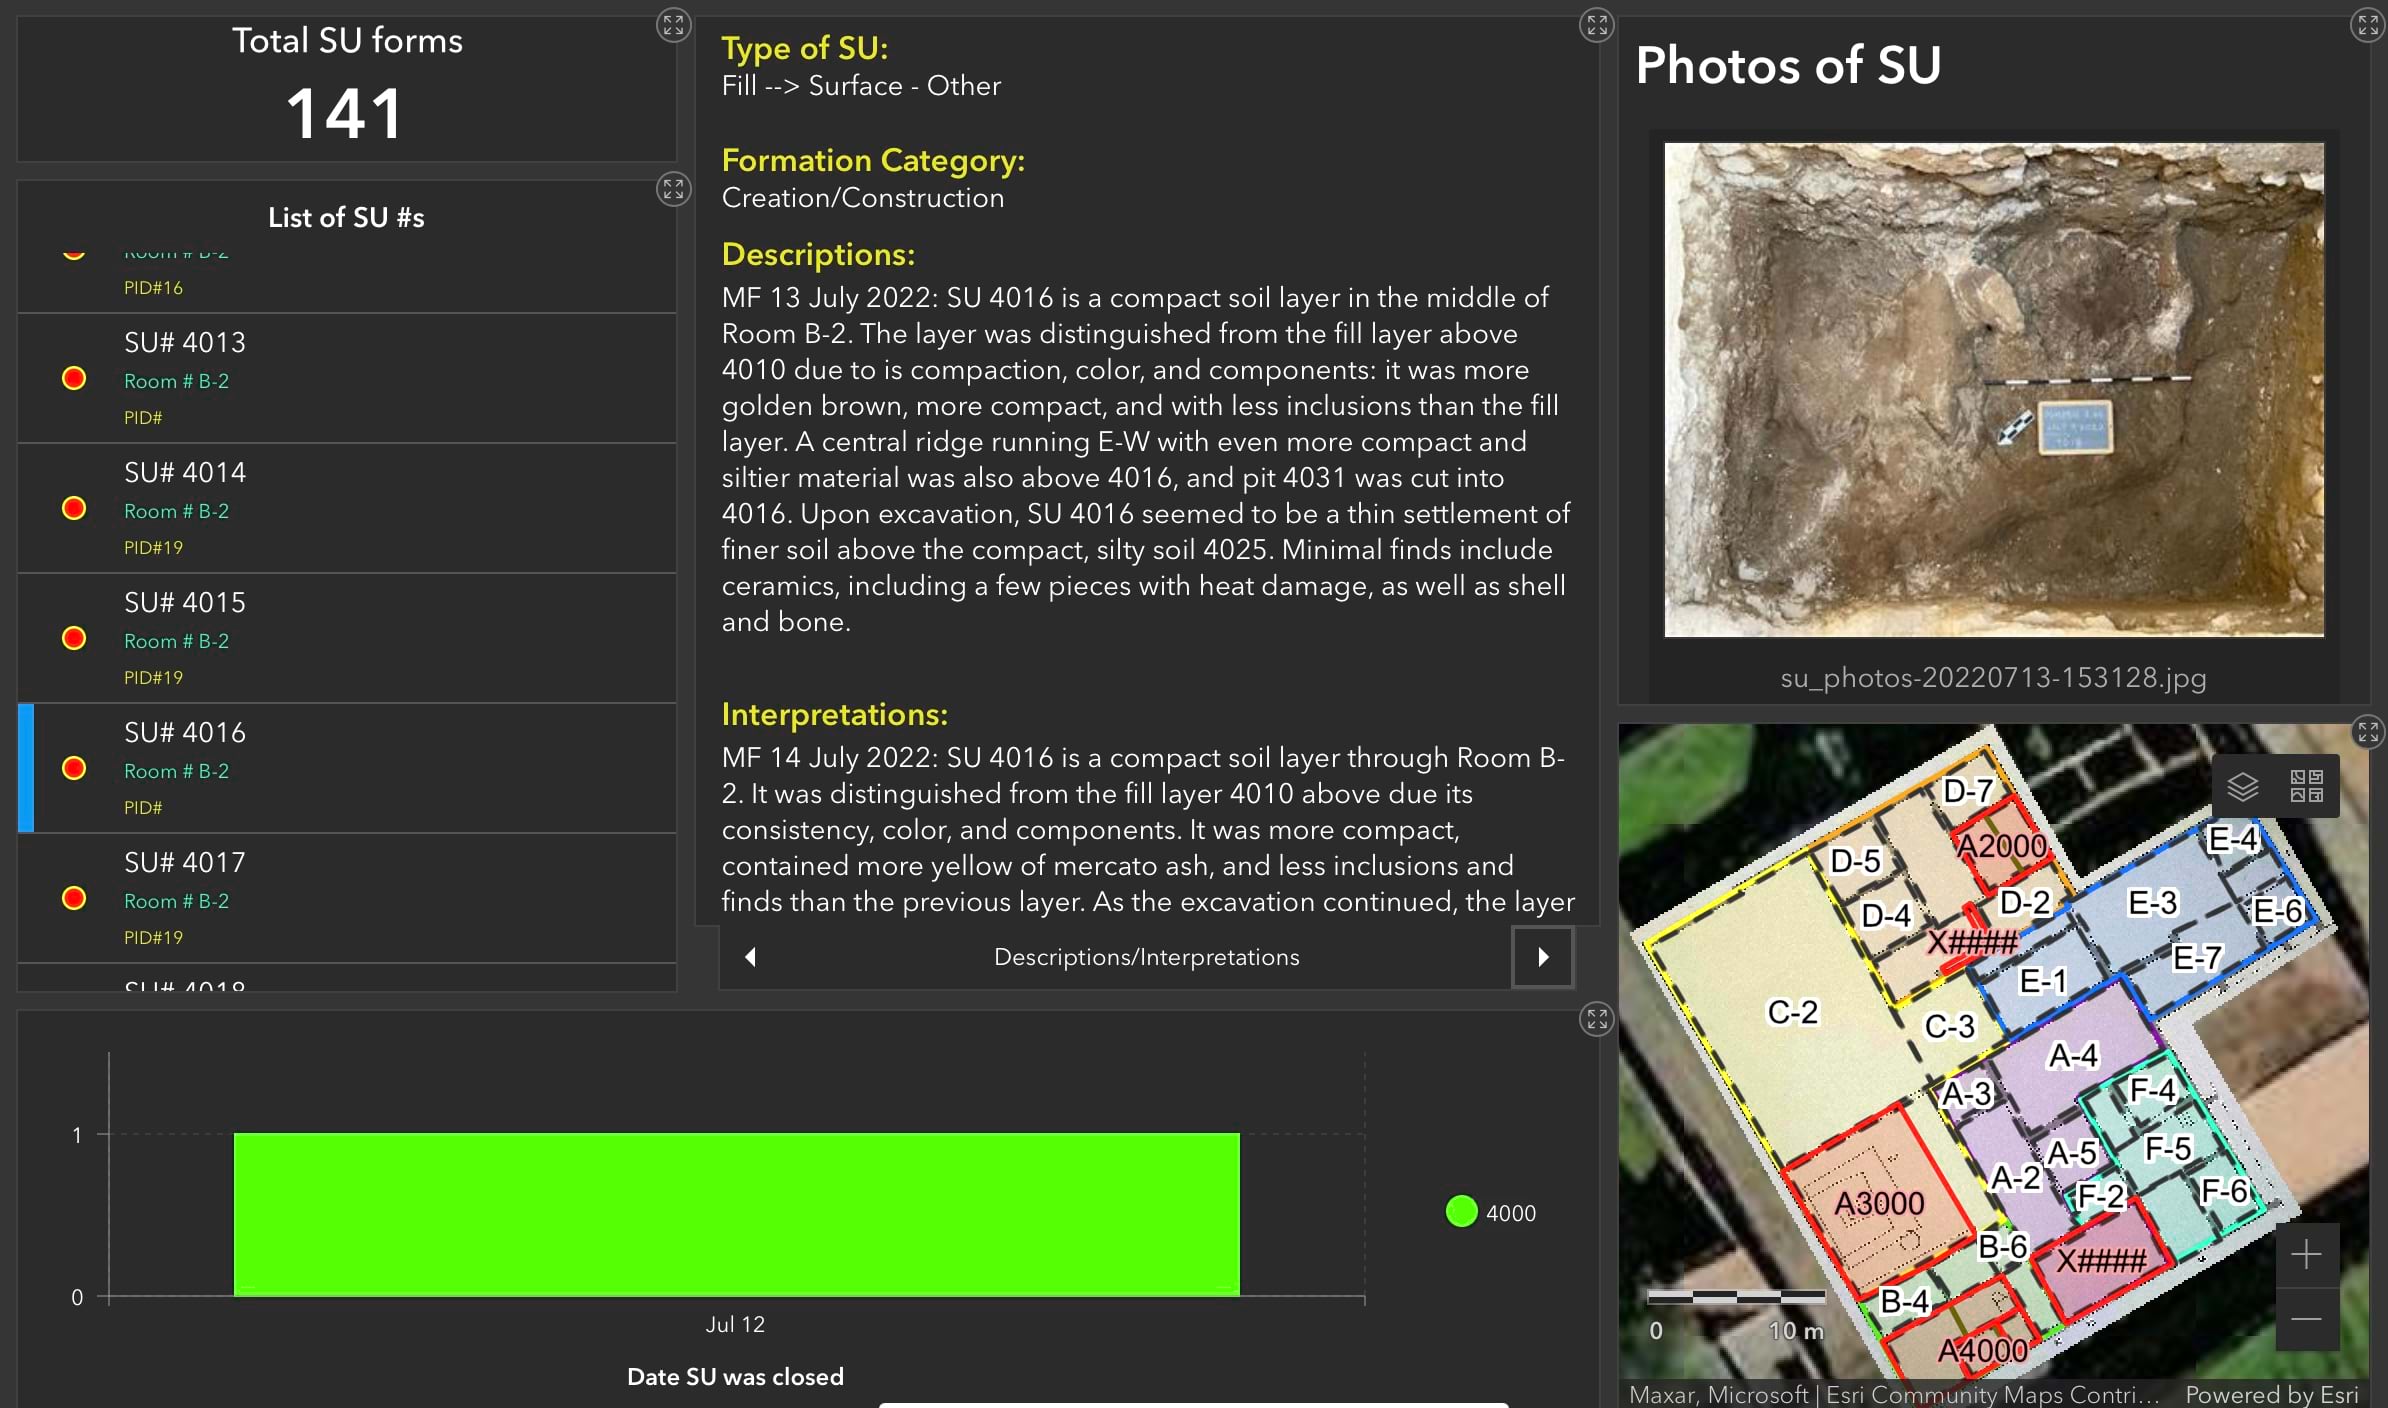
As they dig deeper, information from above is gone. But thanks to the documentation capabilities of GIS on the iPad Pro and the ability to record and explore data in layers, the team avoids information destruction.
GIS enables them to capture substantial details in the moment, integrate with other source data, and generate a reliable web scene they can explore remotely. The data comes together in a GIS-enabled digital twin of the excavation site filled with stunning visuals they can return to whenever they wish and continue analyzing and drawing conclusions about what life was like in ancient Pompeii.
Using the exploratory analysis tools in ArcGIS Pro, archaeologists can investigate the data interactively, including slicing through walls to reveal hidden content as in the short video below.
GIS is central to the Pompeii I.14 Project for its ability to record and share the team’s work with a variety of stakeholders. First and foremost, GIS allows the entire team to access the data and web scene and input their findings into one place simultaneously. This can be done on the spot with their tablets, as opposed to writing notes over dinner after the physical work is done each day. In the past, there would still be the extra step of combining all notes into one geodatabase at the conclusion of the project. While digitization after collection became the norm a decade ago, now they can make the data accessible to the whole team—in real time—by putting it in the cloud.
This level of accessibility goes beyond the excavation site. If they need the opinion of an expert not working at the dig, they can easily share the data with colleagues and collaborators across the globe. “This is what drew me to 3D modeling for data capture to begin with,” Badillo said. “I can share something with, say, a ceramicist, to inspect an object and they can make a judgment call without ever visiting the site.” It saves time and unnecessary travel.
Equally as important to who can access their data is how they access it. Emmerson, self-proclaimed as nontechnical, finds GIS apps to be intuitive. “What’s so great about the web scene is how easy it is to use,” she said. “In the past, 3D modeling required special computers with really good graphic cards and, often, specialist knowledge and specialist software.” The web scene output from GIS can be viewed in any browser, on a smartphone, tablet, or any computer with an internet connection.
As the project continues, Emmerson and her team determined that the structure they’ve uncovered was used for commercial activity such as shopping and dining, which is often identified with the lower classes. Meanwhile, an elite residence was located right next door and the two buildings shared resources.
“We can read this in a lot of ways, but we clearly see the transfer of wealth from the lower classes to the upper classes and connections between them,” Emmerson said.
This is an intriguing finding because it seems at odds with modern cities where neighborhoods tend to be divided along class lines.
The Pompeii I.14 Project team members want to learn how equity factored into city planning and how people’s lives were impacted as a result. Understanding Pompeii society through its structures is important because stories of marginalized people, such as women and those who were enslaved, get less attention than those of wealthy elites. Emmerson recognizes the unique power of archaeology to share these narratives that are usually left out of history books.
Another key finding from the project about how Romans lived relates to waste management. “Everything was getting recycled,” Emmerson commented. “This is a great thing, but it also means that people were living with their trash in a way that presently we do not.”
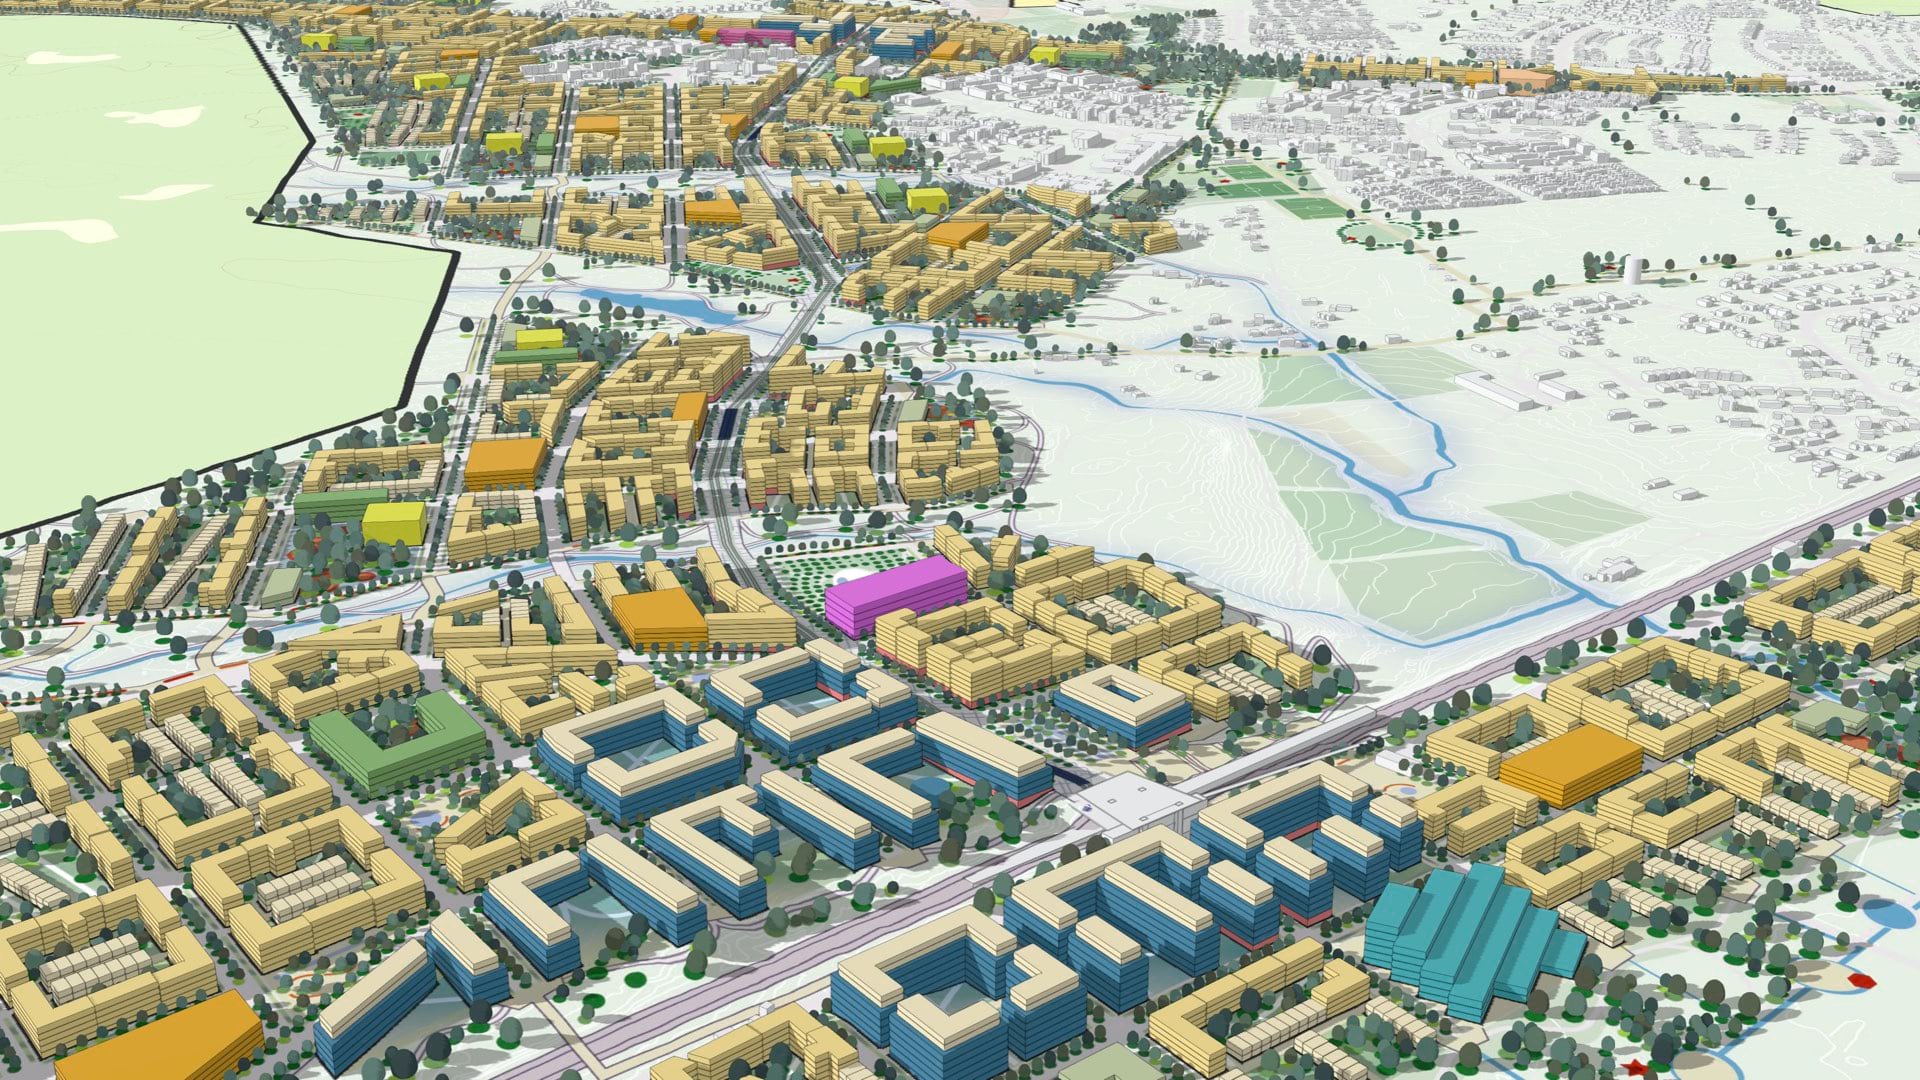
Once the Pompeii I.14 Project is complete, the data will be incorporated into a larger digital twin from the Pompeii Bibliography and Mapping Project (2017) led by Eric Poehler, an associate professor of Classics at the University of Massachusetts Amherst. It will also be added to Pompeii’s central archaeology database and be available to policy makers, educators, archaeologists, and the general public.
Researchers hope that a new understanding of the economic and social life of an ancient city like Pompeii can not only inform us about the past but also help us create a better future. “As archaeologists, we have a responsibility to accurately document the past, especially since we’re destroying the site by studying it,” Emmerson said. “There’s a real ethical call there, and GIS helps us to answer it with a digital twin that people can analyze and learn from for years to come.”
Learn more about the GIS app-based workflows used for digital archaeology. Read more about the use of ArcGIS on the Pompeii I.14 Project from the scientists who applied it to the workflows and awareness needs of archaeologists.