June 23, 2026 |
Lain Graham
| Mapping
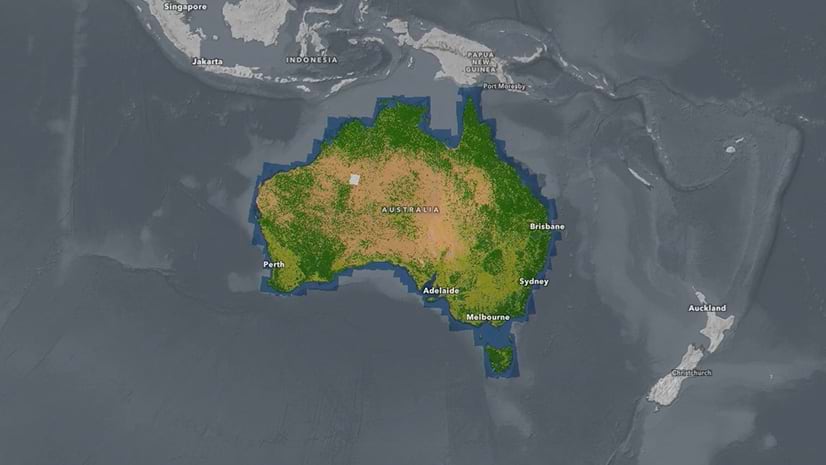
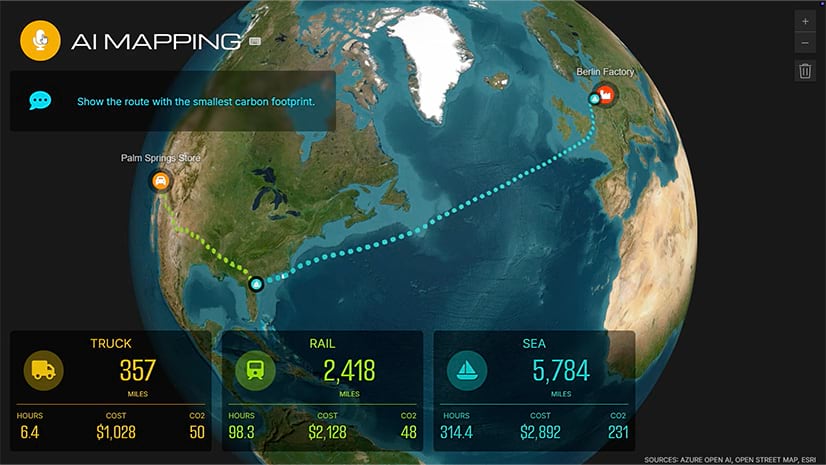
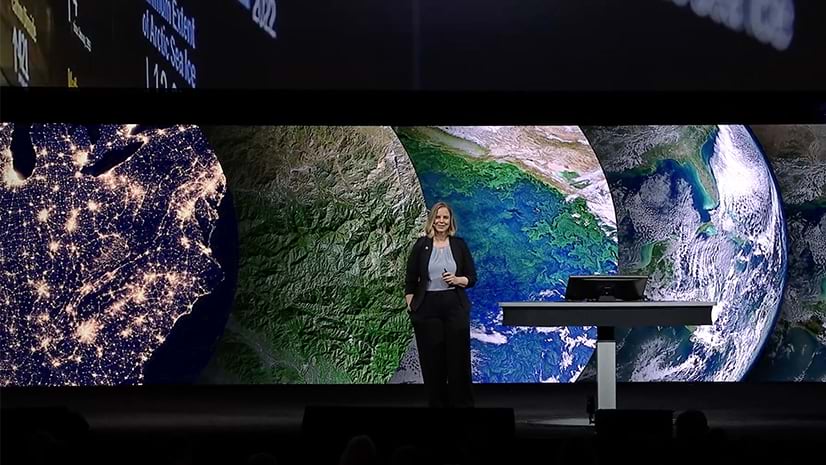
Mapping, charting, statistical, policy, and research organizations use GIS to create more accurate maps, charts, and metrics that track societal challenges and progress. These outputs include detailed indoor and outdoor representations, as well as maps that highlight socioeconomic disparities to guide stakeholder action.
July 5, 2026 |
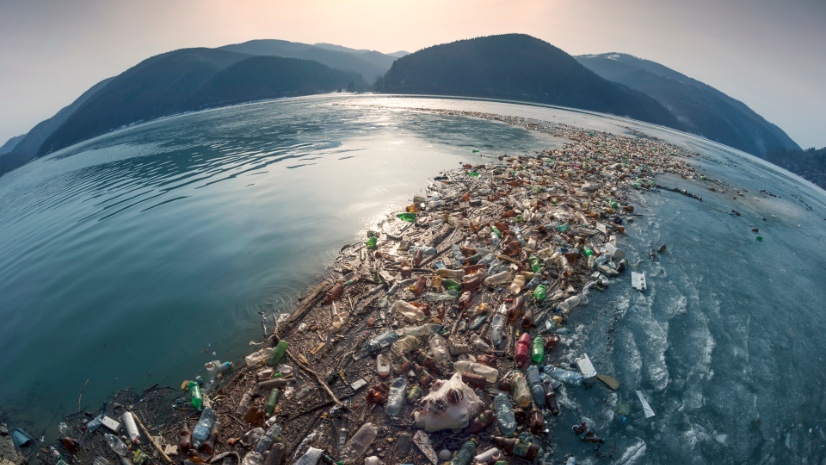
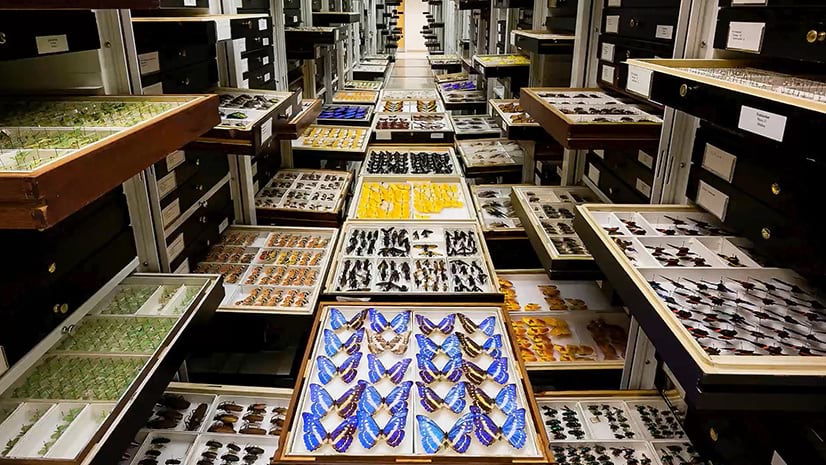
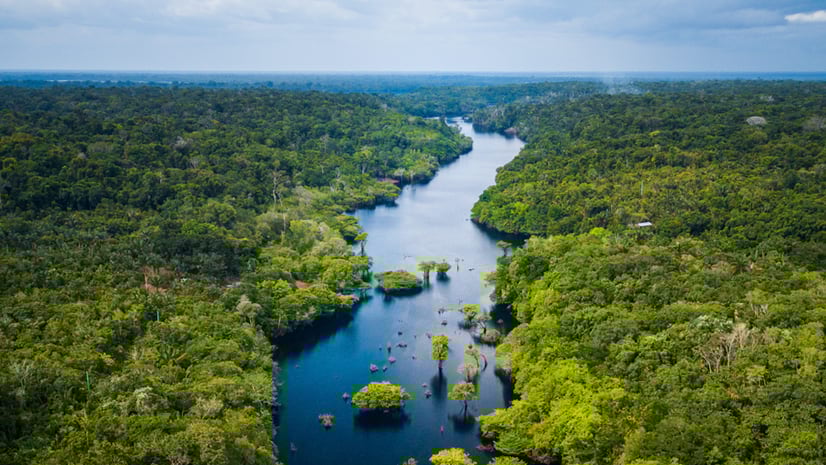
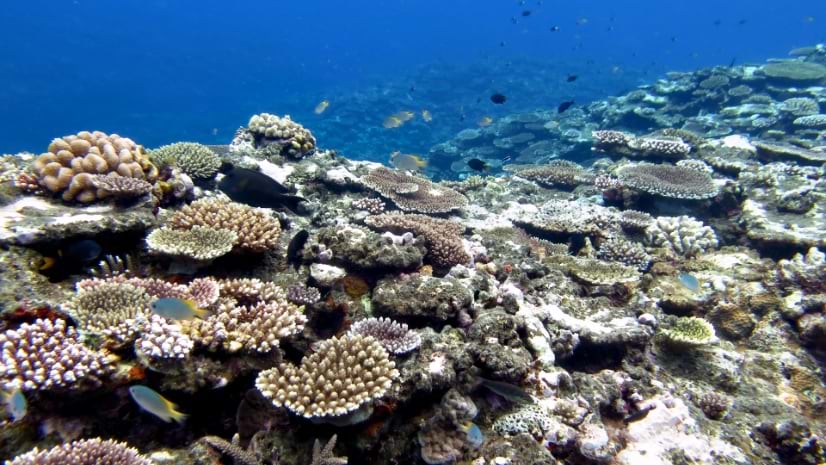
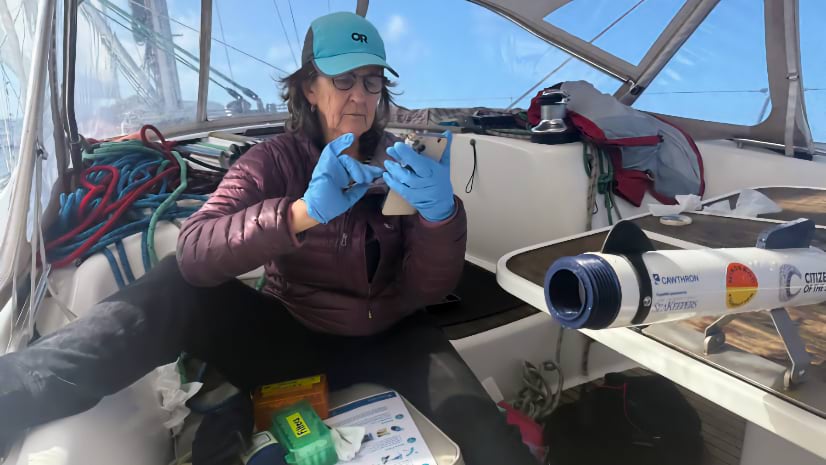
Volunteer sailors are mapping Pacific Ocean biodiversity that scientists can't afford to reach—one water sample at a time.