
March 21, 2019 |
November 12, 2020

As the coronavirus pandemic endangers and upends the lives of millions, it perhaps affects no group more universally than children. Adults fortunate enough to retain jobs they can do from home are at least familiar with the concept of remote work. For kids, live video classwork reflects an alien pedagogy, and the lack of in-person peer interaction hinders the development of social skills.
Pivoting to computer-based remote learning has also deepened existing fault lines in American education. With broadband integral to schoolwork, researchers at the Pew Research Center documented a widening homework gap.
Teens in households earning less than $30,000 are nearly three times as likely to report having trouble completing homework assignments, due to lack of access to a computer or reliable broadband connection, compared to households with incomes above $75,000. Nearly half of teens in low-income families say they sometimes do their homework on a cell phone.
Pew also found that the homework gap involves racial disparities. More than one in five Black teens are forced to search out public Wi-Fi sources for connectivity. Hispanic teens are twice as likely as white teens to report they lack access to a home computer.

The pandemic made the problem impossible to ignore. “The digital divide was suddenly starkly apparent,” said Mark Wheeler, chief information officer for the city of Philadelphia’s Office of Innovation and Technology (OIT). “There were families who couldn’t afford reliable internet. They were using whatever they could to get by—public computing centers, free wi-fi through businesses, libraries—and with those shuttered we had a sizeable population that couldn’t participate in daily life.”
The school closures that roiled American life last spring underscored a crisis within a crisis. Almost overnight, school districts, especially those with large populations of students from low-income families, had to devise ways to keep the gap from swallowing students whole. Here, we look at what has happened in two of the largest school districts in the US.
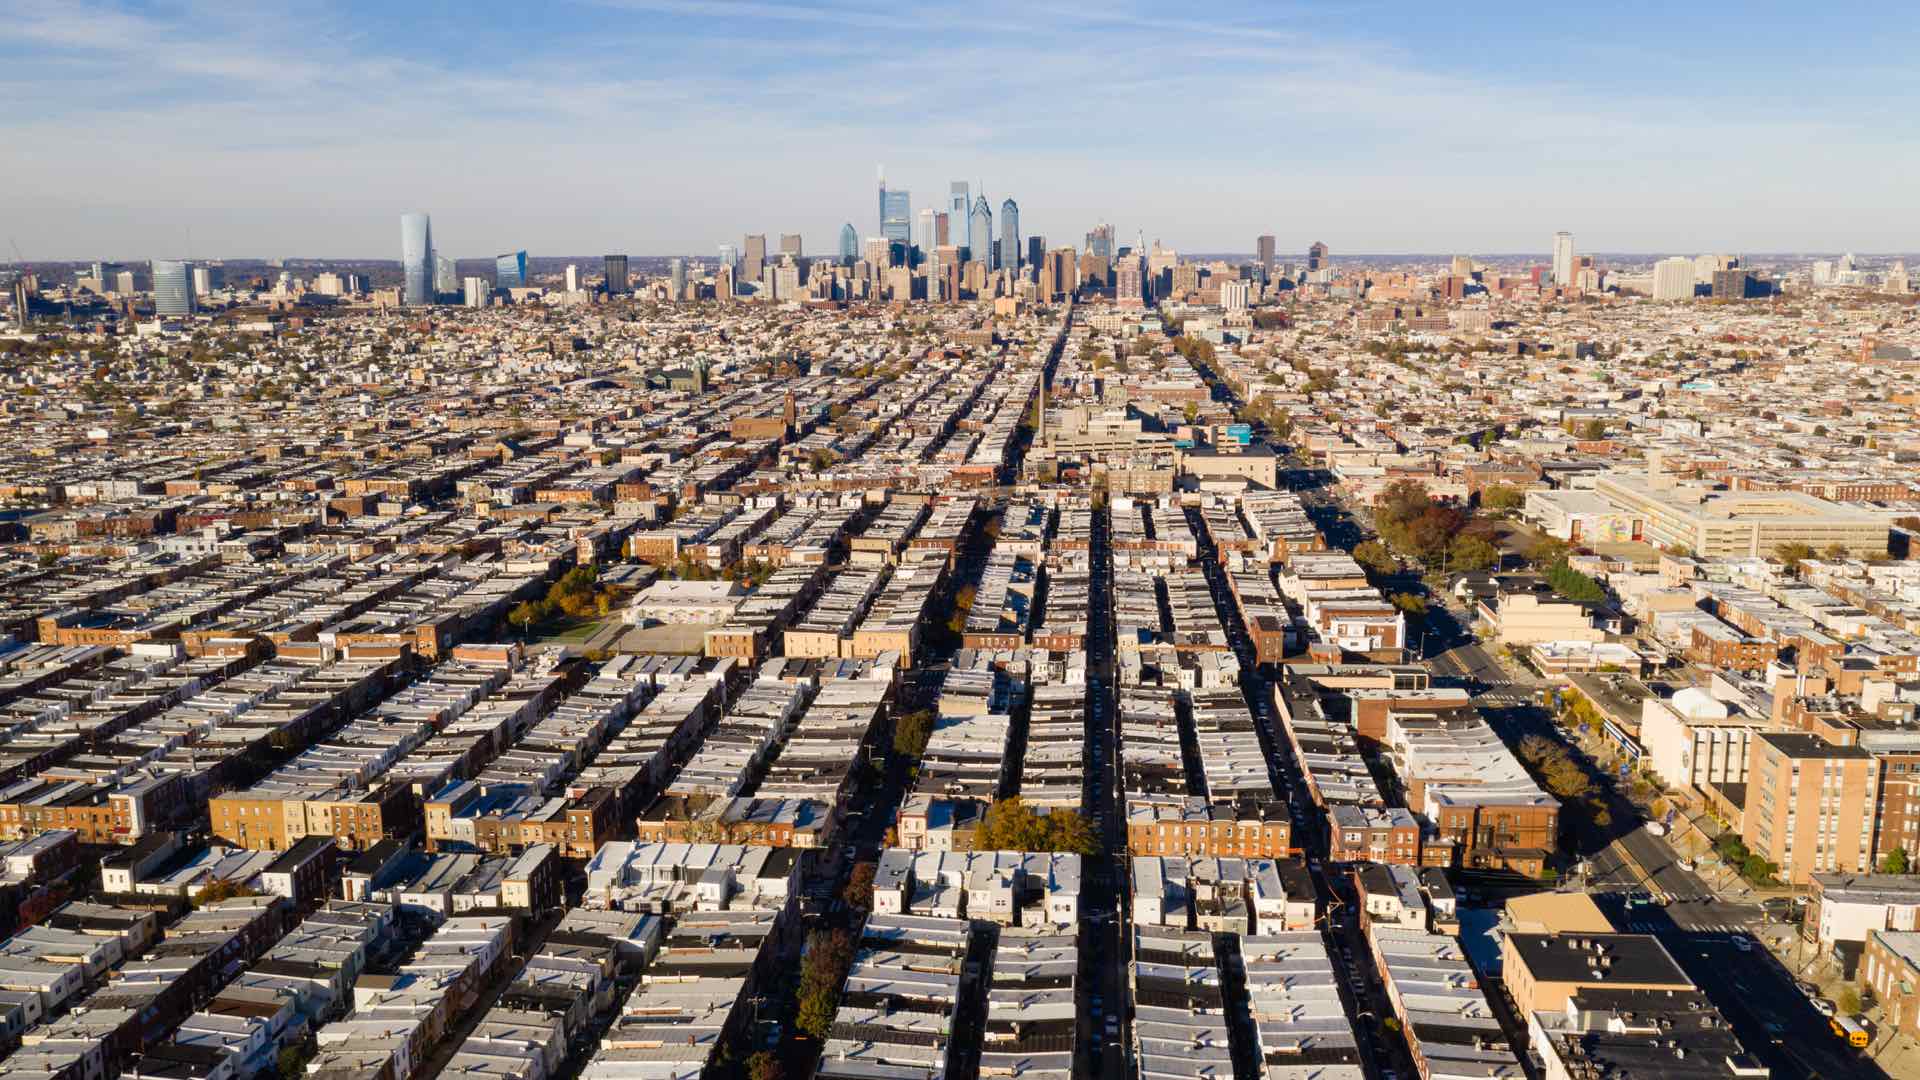
At first glance, the city and county of Philadelphia would seem to have little in common with southeastern Florida’s Palm Beach County. Each has a population of around 1.5 million, but Philadelphia’s is squeezed into an area one sixteenth the size of its distant neighbor on the tropical end of the Eastern Seaboard. Philadelphia has twice the poverty, two-thirds the median income, and significantly less sunshine.
Scratch the surface, however, and Philadelphia and Palm Beach look more alike. Although Philadelphia is one of America’s poorest large cities, it contains pockets of high affluence. Although Palm Beach County’s considerable wealth is mostly concentrated on the Atlantic coast, in cities like Palm Beach and Boca Raton, poverty persists in several communities sandwiched between the ocean and the I-95 freeway. The poverty rate in the Glades, the inland area near Lake Okeechobee, is higher than Philadelphia’s, and the median income is much lower.
Philadelphia and Palm Beach also share a civic quirk. Both counties consolidate their schools into a single school district that each serves around 200,000 students. One out of every 130 public school pupils in the country lives in one of these two districts.

The arrival of COVID-19 forced the school districts of Philadelphia and Palm Beach County to quickly determine who was most at risk before the school year ended.
Each district acquired 80,000 Chromebook computers, using a combination of philanthropic and public funds. To understand better who most needed computers, and how to ensure these students and others also had broadband access, both districts adopted similar data-driven approaches.
To assess needs, the Palm Beach County schools’ Division of Performance Accountability sought the advice of Donna Goldstein, an IT manager with the district. Goldstein’s area of expertise is geographic information systems (GIS), software that analyzes people and places based on location-specific data.
Goldstein began her analysis by using geocoded student data to see where students lived. The data contained demographic information relating to each student, which could be displayed as layers on a map showing where incomes were lowest. She could also see who had already accessed the online student portal.
Goldstein’s team was especially interested in students coded as eligible for subsidized school lunch, thinking these might be families with limited access to technology. Using GIS, she performed a “point density analysis” that displayed geographic clusters of families, which Goldstein then color-coded into three levels of concentration.
These clusters helped the county devise where to place wi-fi hotspots, pole-mounted transmitters that broadcast wi-fi signals that students nearby can access with a special receiver.

To refine the data, Goldstein added more layers, including municipalities, census tract data, and the location of neighborhoods already earmarked for community revitalization funds. She also mapped housing subdivisions, since the county would need to request easements to install the receivers on private property.
The map also helped the county plan where to lay fiber to bring the signals to the Glades. To reach far-flung homes, officials used the map to pick buildings on which to mount poles, including schools, a church, a library, and an Animal Care and Control office.
“We combined all this data to give us a really well-rounded view of what’s going on in the county, and where the greatest areas of need were,” Goldstein said. “If the team wasn’t able to work with the data geographically, and had to look through raw databases, I don’t know how long it would’ve taken, but it would’ve been an extraordinarily long time.”
Meanwhile, a similar process was unfolding in Philadelphia. A program called PHLConnectED, a joint effort launched by the OIT and the Mayor’s Office of Education, was helping families obtain computers and establish home wi-fi hotspots, while also making plans to establish community computing access centers. By late October, more than 11,000 public school families were receiving free internet access thanks to the collaborative effort of city government, the school district, and business and philanthropic leaders.
As in Palm Beach, the initial difficulty PHLConnectED faced was how to identify families that needed the program the most. Those experiencing housing insecurity were hard to contact. An even bigger problem was finding families in relatively stable situations, but with very limited incomes. “We have to make them realize what we offer them is free, and that this isn’t a rug that will be pulled out from under them after a few weeks,” Wheeler said.
To help organize efforts, Wheeler’s office tapped CityGeo, a dedicated team within OIT devoted to mapping and spatial analysis. CityGeo was already using GIS to maintain a city “stress index” that compiles geographic data on crime, homelessness, drug abuse, and other issues that would suggest the existence of students in need. The data helped PHLConnectED prioritize the distribution of wireless routers to create mobile hotspots for students.
“A lot of our work is focused not only on mapping, but on keeping data dynamically up to date through the dashboard,” said Hank Garie, CityGeo’s geographic information officer. “So whether it’s meal sites or access centers, it’s all fed into the GIS, which gives us a great way to visualize and analyze where we might want to target outreach programs based on need or affordability.”
The progress made around bridging the homework gap in Philadelphia and Palm Beach County has implications for broader equity issues. “As spinoffs from this initiative, we’ve been able to do parallel work with our Commerce Department,” Garie said. “A lot of these same datasets are applicable, and we can even use them to view the city’s budget through an equity lens.”
Wheeler noted frequent references to the “stress index” in city meetings as the spatial analysis “really brings into stark relief that so much of this is about where people live.”
“The work the CityGeo team has done has really laid the groundwork for me, as a CIO, to have conversations at the mayor’s level about where populations we’re trying to reach live, and how they’re aligned with so many other critical problems we’re trying to solve in the pandemic,” Wheeler said.
Goldstein agreed. “For me, it goes beyond kids,” she said. “That’s our primary focus, but now you’ve got parents and other adults in the home who have broadband access, which opens up whole new worlds of possibilities for them economically.”
She sees the effort as providing a small silver lining during the crisis. “From my perspective, this is one of the only good things to come out of the pandemic,” she added. “As educators, we’ve been fighting the digital divide for eons. So this is really exciting.”
Visit Esri’s Racial Equity GIS Hub to view resources that help organizations address racial inequalities.

March 21, 2019 |

October 13, 2020 | Multiple Authors |

January 18, 2019 |