

June 7, 2018 |
June 19, 2019
The Super Bowl creates a great deal of excitement, and with the world watching, it can tempt individuals to try and grab the spotlight in ways that are harmful to others. This year was no exception, case in point:
Like most major sporting events, and all national parks, the Super Bowl is a No Drone Zone. Despite that edict, many people still try flying drones over sports stadiums and monuments to film from above.
One team, made up of government staff and experts in geographic information system (GIS) technology, sought to thwart this for the 2019 Super Bowl in Atlanta. The GIS crew created a DroneSpotter application for public safety officials to record the flight plans of authorized drone flights.
Whenever an unauthorized drone was detected, the Federal Bureau of Investigation (FBI), working with the Federal Aviation Agency (FAA), and a company called Fortem Technology, deployed a drone to chase down and capture it using a net gun and tethering system.
Leading up to the Super Bowl kickoff, six drones were detected and seized. While this kind of action may have made for good television, thankfully no such incidents happened during the game.
“Anyone could go into the app and confirm if the drone they were seeing was permitted or not,” said Jeffrey Johnson, GIS manager at the City of Atlanta. “The game itself wasn’t very exciting, and the level of incidents that went on during the game wasn’t terribly exciting either. But that was a good thing.”
Johnson and the rest of the team in Atlanta credit strategic planning and strong collaboration for keeping the event free of major problems.
It’s an example of how public safety professionals combine their expertise, using technology to create a real-time shared awareness, to deliver safe events.

Connecting Many Collaborators
Game day readiness went far beyond the detection and interception of drones.
With an anticipated full stadium of more than 70,000 Super Bowl fans and a global television audience of more than 100 million people, Atlanta city officials knew they had to be prepared to make the events safe and successful.
Serious operational preparations started six months ahead of time, in July 2018. The game, scheduled for Feb. 3, 2019, at Mercedes-Benz Stadium, was just one of many Super Bowl events the city needed to be ready for, with pre-game festivities, entertainment, and concerts drawing large crowds over a 10-day span.
“Our interim CIO and our Director of Emergency Preparedness got together and decided that GIS should be part of Super Bowl preparations—helping us get into ready mode, dealing with traffic plans, permitting, and all the other details of event management,” Johnson said.
A broad range of organizations that work with GIS on a daily basis came together to help the city. They collaborated and shared data using ArcGIS Online—a software-as-a-service offering from Esri. Participants included staff from multiple departments of the City of Atlanta, Fulton County, Cobb County, the Georgia Emergency Management Agency (GEMA), the Georgia Bureau of Investigation, the FBI, the Federal Emergency Management Agency, and the Department of Homeland Security, and others. The collaborators totaled 77 members, who shared 189 layers of content.
“Having one centralized repository for data was fantastic, because we didn’t have to worry about finding or creating the data we needed,” said Jennifer Lana, GIS Manager with Cobb County, Georgia. “For instance, Atlanta shared the layout of the new Mercedes-Benz Stadium, with floor plans, exits, evacuation routes. A lot of our officers were stationed there, and it was great to have the details we needed.”
Starting five weeks prior to the game, this diverse team convened every Friday to discuss plans and share information.
“Everybody just piggybacks off of each other, with all of us on the same page and seeing live updates of everything people add to the group,” said Robbie Bagby, GIS Coordinator at GEMA. “Somebody can create a data service that spurs innovation and ideas because somebody else can create additional data from that service.”
Managing Large Crowds
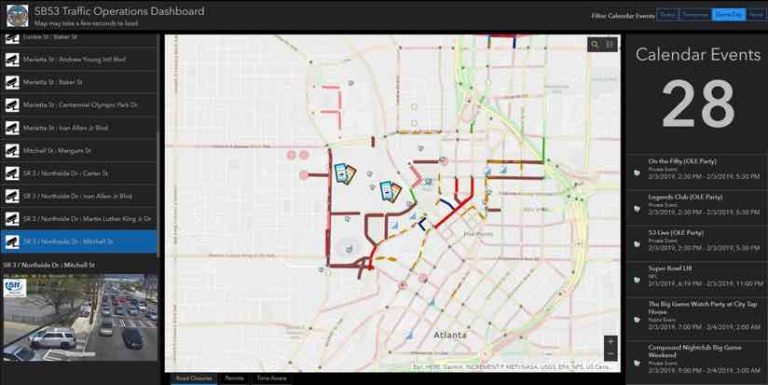
The Super Bowl host committee hired traffic engineering company Kimley-Horn to create daily traffic plans that included routes to and from events, accounted for normal and special event traffic flow, and included emergency evacuation routes.
“We received the traffic plans, which were in GIS format, and imported those into ArcGIS Online as one of our shared layers so that everyone had access to details such as which roads were closed or partially closed each day,” Johnson said.
The Cobb County police force and its leadership joined Atlanta to help manage public safety and the movement of people. While Cobb County officers knew how to handle crowds, they weren’t that familiar with Atlanta.
“We have the Atlanta Braves stadium in our county, so we’re used to large events,” Lana said. “Our police chief wanted a way to see where our officers were at all times, and GIS apps allowed us to keep tabs on them. If something big happened, we would know where they were, and we had a record of officer movements in case we needed to reconstruct any incidents for an after-action report.”
Sniffing for Danger
Atlanta welcomed many bomb-sniffing dog teams from around the region to monitor event venues and surroundings. The dogs could detect any explosive material odors in or around cars or suspicious belongings.
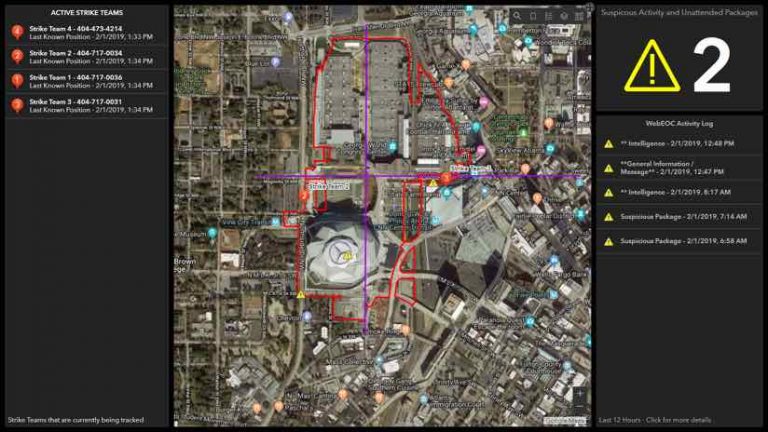
“We could zoom and flash to where all the strike teams were on the map,” Bagby said. “If a team was done with their shift or on a break, they would disappear off the map.”
Dashboards displayed the locations of strike teams for the state operations center at GEMA, the bomb management center a few blocks from the stadium, and the Joint Operations Center. During the course of the event, there were 5.5 million requests for just that live data layer alone. That equates to roughly 381 requests per second over the course of the four-hour event, proving that ‘who is where’ is a foundational question.
Atlanta’s GIS team staffed the Joint Operations Center around the clock for a 10-day period. The most intense days were the Thursday, Friday, and Saturday prior to the big game, and then Super Bowl Sunday. Fulton County staffed the Emergency Operations Center, which is where all the Emergency Medical Service personnel were being routed from. The rest of the broader GIS team had a variety of assignments and kept busy answering any location-related questions.
“We’re kind of mind readers by trade, trying to do things in advance that people are going to ask for later,” Bagby said. “Thinking back to the Boston Marathon, I created a map that showed how far someone could get whether they were walking or driving five, 10, and 15 minutes from the stadium. If you recall, those bombers were on foot, and I wanted to figure out where we’d need to set up a perimeter if anything like that happened.”

Carrying the Collaboration Forward
Many GIS mapping innovations initiated in Atlanta for the Super Bowl have now become standard practice for the city when coordinating any major function.
For example, the Atlanta GIS team created a permit-editing map for the Mayor’s Office of Film and the Mayor’s Office of Special Events. The city gets an average of two filming requests per day and constantly issues permits for local fairs, races, and other special event. Now, each event is mapped in GIS with event type, date, time of day, number of attendees, and other details.
“Setting that up before Super Bowl, and getting people using it allowed us to continue that after Super Bowl,” Johnson said. “Now, all filming and event permits are mapped in GIS and integrated with our Public Works right-of-way permits to track the shutdown of a lane, a roadway, or a sidewalk. We now have a quick place to see if it’s okay to issue a permit for a specific place and time.”
Atlanta city staff and leaders also now have a shared understanding of the value and inputs needed to create a common operational picture.
“I think it would have taken another year or two to achieve that if we didn’t have the Super Bowl,” Johnson said. “The event spurred us to get folks together to agree and adopt that innovation.”
Explore the many ways that GIS supports public safety with real-time situational awareness.

June 7, 2018 |

November 20, 2017 |

November 1, 2018 |