World travelers love the possibilities inherent in exploring new destinations. The airlines that take them there prefer a degree of certainty; new routes must turn a profit. And yet, airline planners can’t afford to idle on the runway waiting for a sure bet. As they look for a balance between first-mover status and profitability, they do what other modern businesses do: consult the data.
In a recent Wall Street Journal interview, a United Airlines executive explained how his team combines hard data analysis and social media buzz to discover the latest hot routes for savvy travelers.
Recently, United fast-tracked service to Bangkok to capture demand stoked by the latest season of the Netflix series White Lotus. The executive told the WSJ that Thailand was already on their radar—they were primed to flip the switch with staff and aircraft when demand reached critical mass.
When deciding where to expand, United looks for clues in the geographic patterns of booking records and consumer purchases, the WSJ article revealed. Credit card data shows where travelers are spending at overseas hotels and restaurants. Government data, like USDOT origin and destination records, back up hunches with concrete numbers and demographics.
Mindful of the delicate balance between demand signals and profitable expansion, the United executive said new international routes have a short leash. The team knows after about a year whether they will pan out.
For any business executive, knowing where demand is too low to support a profitable expansion is just as important as knowing where the next hot spot is.
Mapping Expansion in Other Industries
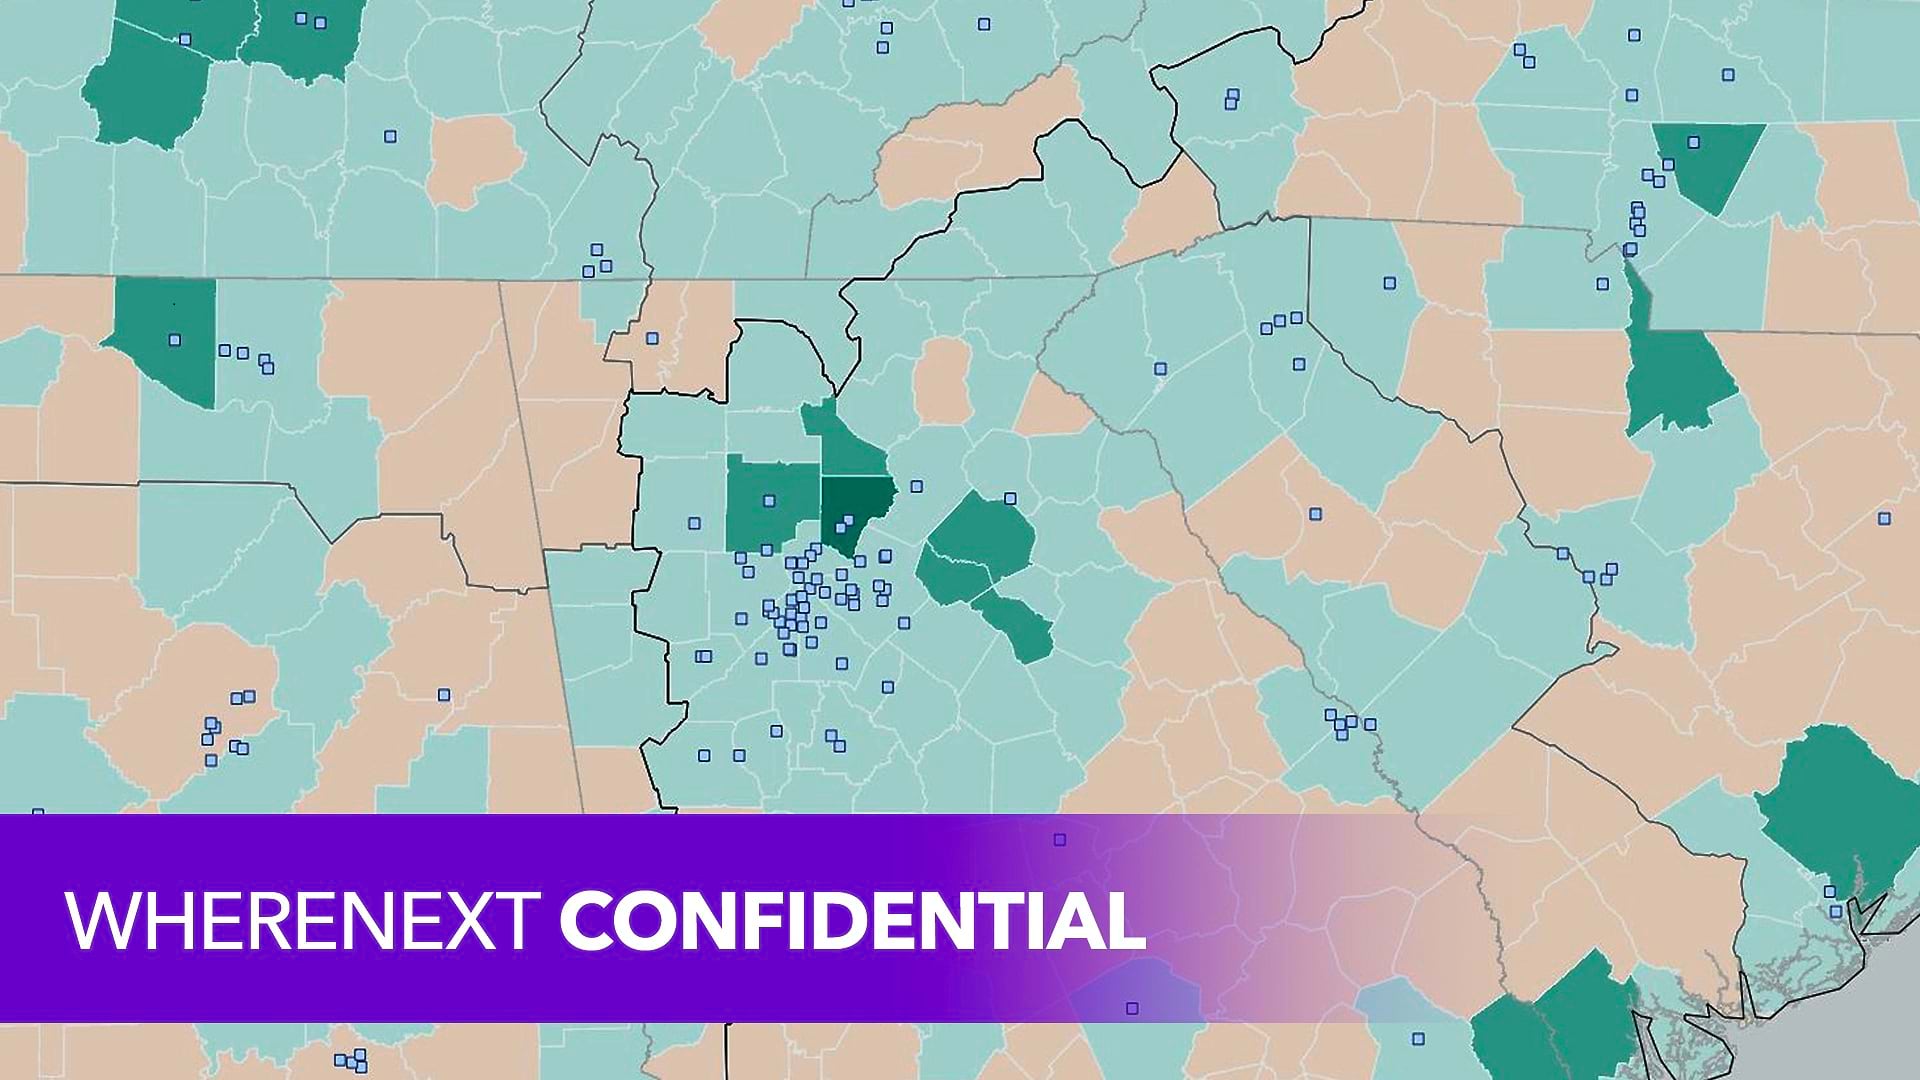
Airlines expand like firms in other industries—by understanding where their best customers are, where others like them live, and by assessing whether it’s profitable to reach them. Many prominent businesses map demand signals with geographic information system (GIS) technology.
In one case, location-specific demand signals helped a major brewing company analyze neighborhoods for a new chain of branded brewpubs. Analysts investigated several cities in multiple countries, placing demographic information on maps to show executives where craft beer was already popular. They refined the analysis to areas where the retail mix and nighttime movement patterns indicated high potential for walk-in traffic from neighboring establishments.
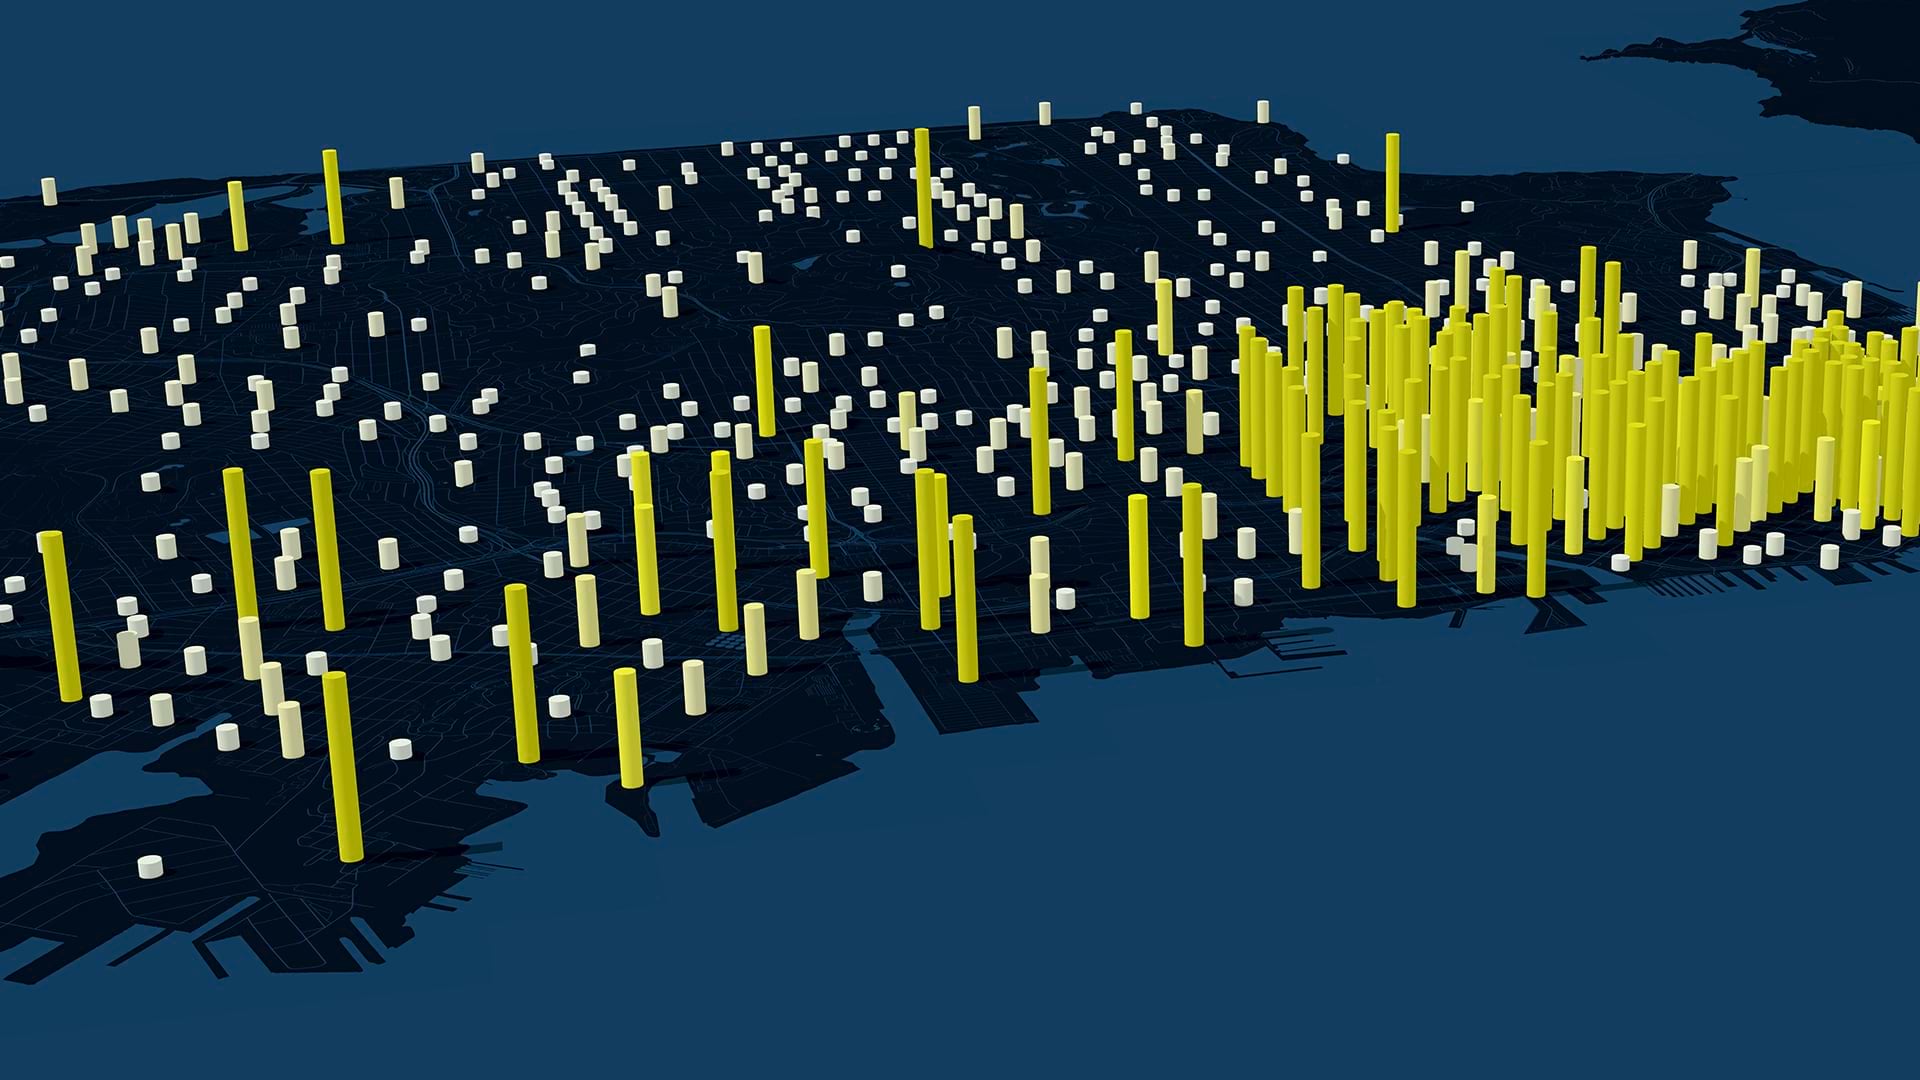
In another case, a light bulb came on for executives at one of the world’s largest sports retailers when GIS analysts plotted demand signals on a map. A halo of strong online sales performance circled many of the company’s physical store locations, revealing a synergistic relationship between in-store and online customer behavior. The halo effect, according to retail analysts, can add as much as 20 to 30 percent to a physical store’s sales.
Demand Signals and Profitability—An Assessment for Geospatial AI
As companies search for the sweet spot between demand and profitability, GIS can illuminate the halo effect on expansion scenarios. Halo forecasting blends location data, transaction history, consumer profiles, and geospatial AI to predict in-store and online sales, helping executives plan profitable business locations in markets around the world.
Geospatial AI is helping agriculture equipment dealers predict local demand at a continental scale. With GIS-powered regression models, executives identify markets with traits similar to successful operations. That includes a market’s psychographic makeup—consumer habits that often make the difference between a profitable location and an unprofitable one.
Whether companies are selling tractors, craft beer, baseball gloves, or transatlantic flights, expansion follows a formula. The key is to predict demand—and determine whether it’s enough to turn a profit. Industry innovators map data with GIS technology to read the demand signals and expand with more certainty.
The Esri Brief
Trending insights from WhereNext and other leading publicationsTrending articles

December 5, 2024 |

June 23, 2026 |

June 2, 2026 |

March 3, 2026 |

April 7, 2026 |

March 17, 2026 |