To understand how economic jitters and inflation have played out at the kitchen tables of everyday Americans, pay attention to where consumers choose to shop.
Retail foot traffic data reveals trends in consumer sentiment more nuanced than any headline. As consumer moods, movements, and price sensitivities shift, business leaders need more than statistics—they need context. They need a map.
Geographic information system (GIS) mapping transforms raw visitation data into actionable intelligence. With a glance at a GIS-powered map and dashboard, executives can instantly visualize shifts in year-over-year consumer behavior across grocery chains and value retailers, revealing both national trends and critical local market variations that otherwise remain hidden.
Retail Foot Traffic: How Shopping Behavior Varies by Geography
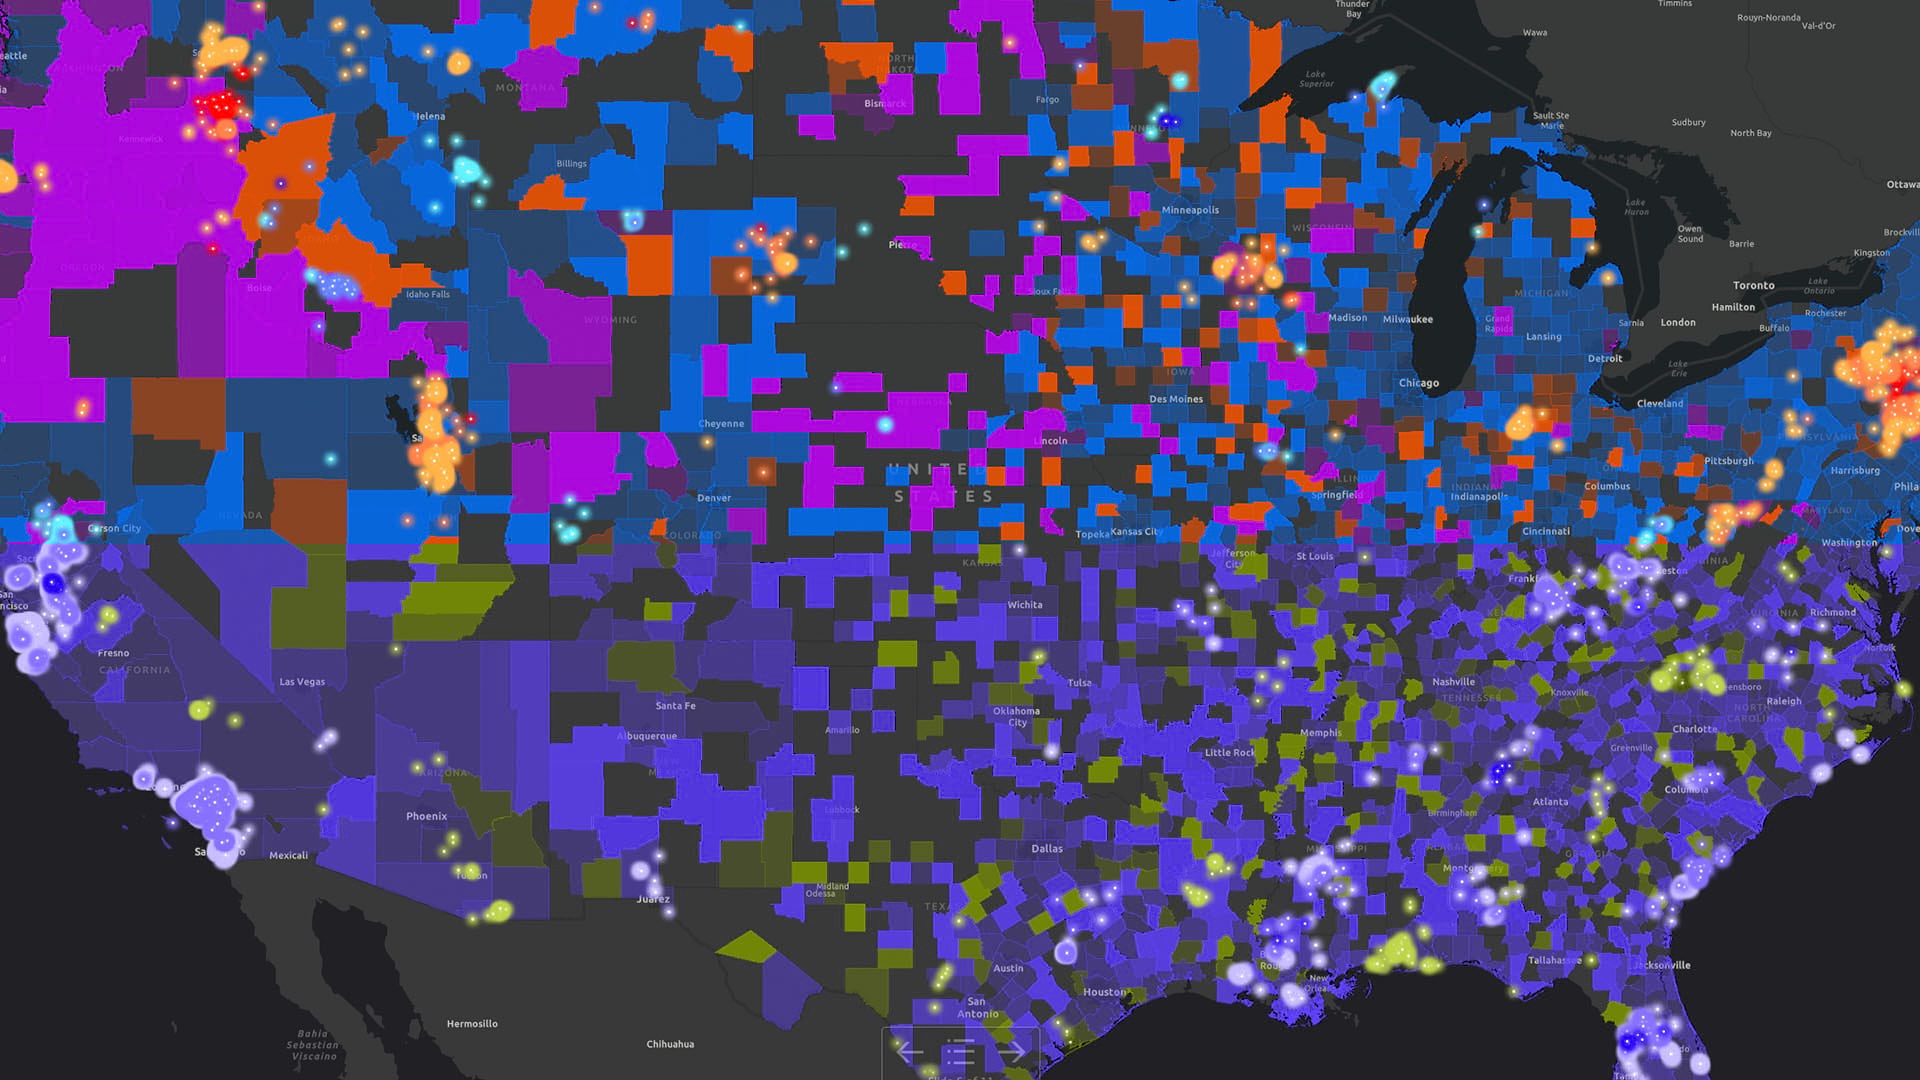
The video below analyzes Placer.ai footfall data for grocery stores and discount shops in 2023 and 2024.
The GIS analysis reveals a striking pattern: in some markets, a rise in dollar store activity appears to have come at the expense of grocery stores, a potential signal of consumer downshifting. But other regions defied this trend completely, showing parallel growth or even parallel declines. Only by layering demographic data, economic indicators, urbanization metrics, and even weather patterns can executives understand what’s truly driving consumer behavior in each distinct market—and how to respond strategically.
The Rust Belt emerged as a bright spot for discount stores, showing some of the category’s biggest gains. In Pennsylvania, discount store foot traffic rose by the highest amount of any state (18 percent) followed by Michigan (16 percent) and Ohio (13 percent). In each of those states, grocery stores saw slight declines—a trend possibly spurred by higher food costs.
In the West, grocery stores saw healthy increases in visitation, with chains in Idaho, Montana, Wyoming, Colorado, Utah, and New Mexico enjoying rising activity. States on the West Coast, like California and Oregon, were among the few on the map to go dark blue—indicating strong visitation growth for grocers. In California, competition among grocery chains and the growing popularity of brands like Trader Joe’s and Aldi have buoyed the category, and likely contributed to the rise in retail foot traffic.
Seeing the Details That Matter to Store Visitation Trends
Location-specific food industry trends can affect site selection and operational decisions not only for companies in the sector, but for those that partner with them or do business near their stores.
For example, a location analyst for an organic grocer might use a map to show executives why a disparity exists between store performance in the suburbs surrounding Washington, DC and in the Oklahoma City area.
Zooming in for the granular view of a market illuminates the location-based forces that shape outcomes. A GIS infographic, for instance, spotlights the number of stores in the area, the level of urbanicity, and psychographic and demographic data on the market.
In the suburbs surrounding Washington, DC, discount store traffic fell modestly while grocery store traffic rose. With a median income hovering around $122,000, the area is home to some of the wealthiest socioeconomic groups in the US, who tend to purchase fresh organic goods and cook at home.
In the area around Oklahoma City, by contrast, retail foot traffic at both grocery stores and discount chains dropped by around nine percent. Median household income is just over $70,000, and there’s a sizeable concentration of busy, working families that rely on online shopping to save time. In addition, weak retail demand in Oklahoma has triggered store closures for a number of brands.
Why Retail Foot Traffic Matters
When retail executives understand the social and economic forces behind store visits, they make smarter choices about where to operate and what to sell.
By analyzing GIS maps, they can assess whether a store is thriving because the area has the right demographic makeup or because it’s located in a food desert. They can use psychographic data to gauge whether to expand a produce section or stock more high-protein products.
In today’s volatile economy, maps help answer these critical questions by bringing context and strategic intelligence to footfall data, enriching what continues to be one of the best metrics of a brand’s vitality: a company’s power to attract consumers through its doors.
The Esri Brief
Trending insights from WhereNext and other leading publicationsTrending articles

December 5, 2024 |

June 23, 2026 |

March 3, 2026 |

March 17, 2026 |

April 7, 2026 |

June 2, 2026 |