As coffee chain Starbucks climbed to US market dominance during the 2000s, its stores became so ubiquitous that, at one point, consumers could famously find two locations at one intersection in Houston.
Dollar General, the country’s largest discount store chain with over 20,000 locations, is courting similar levels of penetration: It has 10 storefronts in a seven-mile stretch east of Tulsa.
Brands with high store density must weigh site-selection risks, such as cannibalizing sales, against rewards like higher visibility and lower logistics costs.
To find the optimal balance between customer convenience and an overcrowded retail network, companies increasingly use the sophisticated analysis of geographic information system (GIS) software.
Site Selection Challenge: Are These Stores Complementary—or Competing?
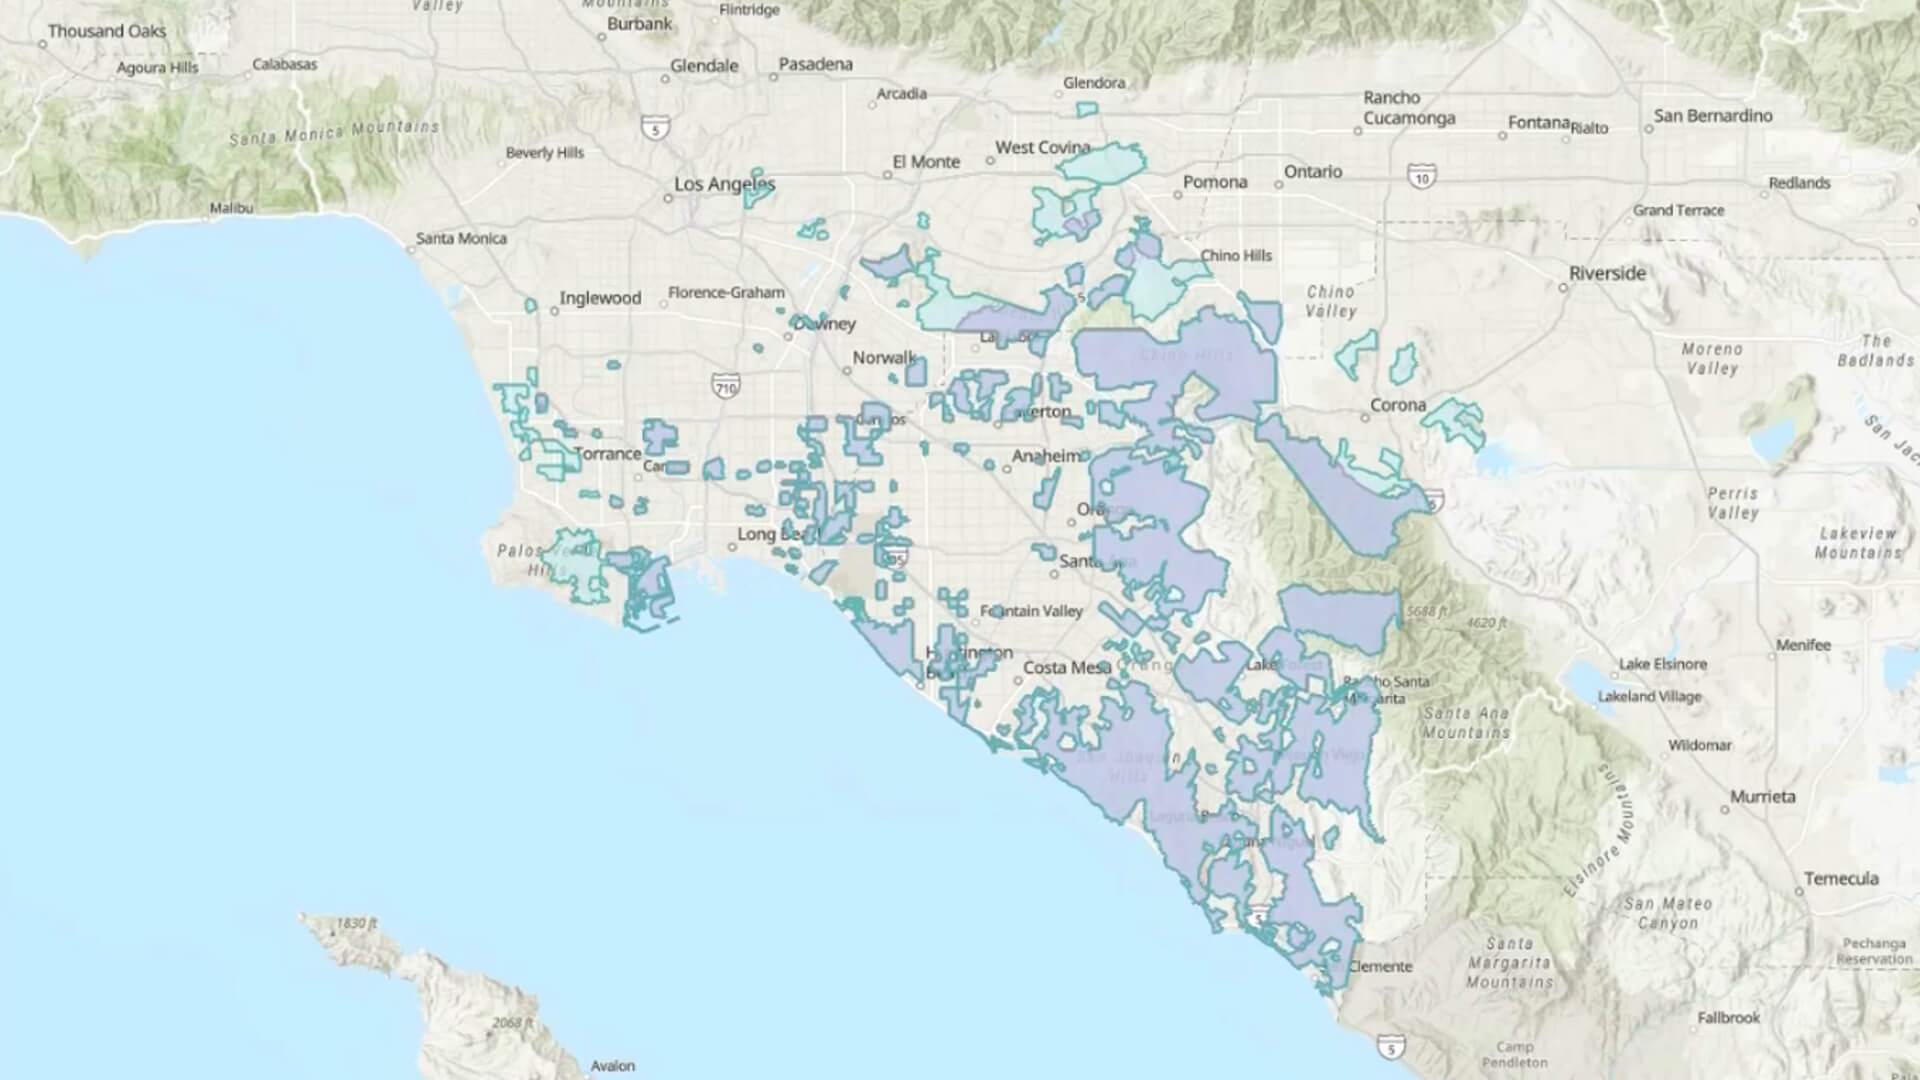
In the video below, a hypothetical luxury retailer uses GIS to analyze the trade areas of two nearby stores in upscale Los Angeles malls.
Banks, fitness chains, urgent care providers, accounting firms, and other businesses use these same techniques to analyze whether locations are complementary or competing.
A map of a 45-minute drive time around one store in Costa Mesa, California’s South Coast Plaza provides a baseline of the store’s potential reach. But at 2.2 million households, that area is too broad to provide much intelligence about target shoppers for the brand.
What company executives really want to know is where anonymous groups of target customers are within that large mosaic of neighborhoods. Leveraging the demographic and psychographic insights of GIS makes this possible.
On a map, a retail analyst can highlight all the places where disposable income exceeds $100,000 and net worth is greater than $1 million—the true trade area of interest for the luxury retailer.
To compare this area with that of a second store—12 miles away in the Fashion Island mall in Newport Beach—the analyst adds the second location to the map and displays target customer groups living within 45 minutes of each store.
A side-by-side comparison reveals that the trade areas are nearly twins in terms of demographics, with similar median ages, income levels, and home values.
An executive seeing similar consumer profiles for two stores might speculate: If the South Coast Plaza store closed, would the Fashion Island location attract the customers that formerly shopped in Costa Mesa?
The best answer comes not from guesswork but from the location intelligence produced by mapping and analytics. The analyst uses GIS tools to identify customer areas unique to the South Coast Plaza location. Then, by comparing the demographics of that cohort with the broader group, the company can see if a distinct customer profile emerges around Costa Mesa.
Indeed, the analytics reveal important nuances: The blocks of customers unique to South Coast Plaza, while still wealthy and highly educated, are more diverse and more likely to work from home or own their own business. They also spend a smaller percentage of their income on housing costs, offering clues to how they might spend their disposable income.
Replacing Market Generalities with Precise Location Insights
The close-or-keep decision is ultimately a capital-allocation decision—and without precise location intelligence, executives make it on instinct about neighborhoods they’ve never analyzed.
The company might decide that the audience unique to South Coast Plaza isn’t large enough to support that location in addition to the one at Fashion Island, arguing for closure. Alternately, the team might add competing brands to the map and conclude that the combined force of the two stores has largely warded off other brands, supporting a decision to keep both stores open.
By moving from generalities to specifics—from broad-brush markets to a pinpoint customer understanding—GIS technology equips brands with better knowledge about who they’re serving and where. Companies that build this capability change how leadership makes decisions: by replacing intuition with analytically grounded answers to high-stakes investment decisions.
The Esri Brief
Trending insights from WhereNext and other leading publicationsTrending articles
December 5, 2024 |

January 11, 2024 |
May 26, 2026 |

September 8, 2026 |
September 22, 2026 |

September 15, 2026 |